Difference between revisions of "Extracting Shoreline Polygons and Polylines from Sentinel-2 Imagery"
(Added Step 7. Merging Raster Images) |
(Added Step 8. Symbolizing Raster Layers in Qgis) |
||
| Line 142: | Line 142: | ||
===Step 7. Merging Raster Images === |
===Step 7. Merging Raster Images === |
||
| + | |||
| − | ''' |
||
:*Repeat steps 5 to 6 using the second Seninel-2 image giving the output GoeTIFFs different names like '''"TCI_2"''' and '''"ColourComp_2"''' |
:*Repeat steps 5 to 6 using the second Seninel-2 image giving the output GoeTIFFs different names like '''"TCI_2"''' and '''"ColourComp_2"''' |
||
:*You should now have two colour composite images and two true colour images, one for each half of the full Senienl-2 Scene |
:*You should now have two colour composite images and two true colour images, one for each half of the full Senienl-2 Scene |
||
| Line 154: | Line 154: | ||
:*You should now have two complete rasters, one a true colour image and one a colour composite image |
:*You should now have two complete rasters, one a true colour image and one a colour composite image |
||
:*Right click the unmerged rasters and remove them from the project using the '''Remove Layer''' option |
:*Right click the unmerged rasters and remove them from the project using the '''Remove Layer''' option |
||
| + | |||
| + | |||
| + | ===Step 8. Symbolizing Raster Layers in Qgis=== |
||
| + | |||
| + | :*In Qgis you are able to change the way raster layers are symbolized |
||
| + | :*To change a raster’s symbolization right click the layer and select '''Properties''' |
||
| + | :*Under the various headers there are options for changing the image’s saturation, contrast, brightness, minimum value, maximum value and band mapping |
||
| + | :*We will now create a false colour image from the colour composite merge layer |
||
| + | :*Right click the colour composite merge raster and select '''Properties''' |
||
| + | :*Under the band rendering window, you should be able to see what bands have been assigned to the '''Red''', '''Green ''' and '''Blue''' bands ('''Note:''' the band numbers have changed in this image after creating the first colour composite image back in step 6 '''Band 1''' in this image is the '''Red''' band from the Sentinel 2 data, '''Band 2''' is the '''Green''' band and '''Band 3''' is the '''Blue''' band, '''Band 4''' is '''NIR''') |
||
| + | :*A common false colour image combination used to view vegetation and water is '''NIR ''' mapped as '''(red) ''', '''Green ''' mapped as '''(blue) ''' and '''Red''' mapped as '''(green) ''' |
||
| + | :*This combination highlights vegetation in red because vegetation reflects large amount of '''NIR'''light |
||
| + | :*Change the assigned bands under the '''Band Rendering''' header so that '''Red''' is assigned to '''band 4''', '''Green''' is assigned to '''band 3''' and '''Red''' is assigned to '''band 2''', click '''OK''' |
||
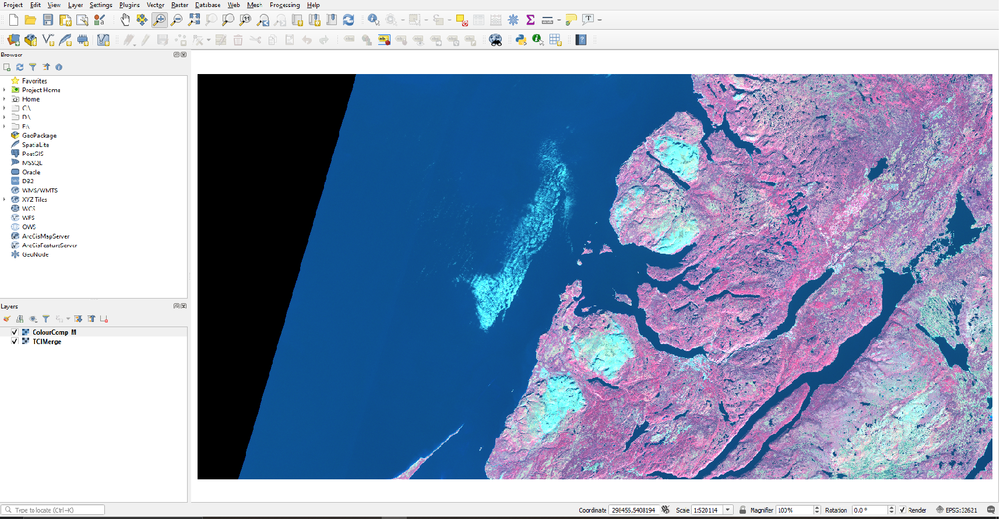
| + | :*The image should now appear as a false colour image seen below |
||
| + | :::[[File:Step8_FalseColour.png|1000px]] |
||
| + | :*You can adjust the brightness on both the false colour and true colour image to your liking using the brightness slider in the '''Layer Properties''' window |
||
== References == |
== References == |
||
Revision as of 21:17, 5 November 2019
Contents
- 1 Introduction
- 2 Data
- 3 Tutorial Methods and Instructions
- 3.1 Step 1. Using the Copernicus Open Access Hub
- 3.2 Step 2. Browsing the Copernicus Open Access Hub
- 3.3 Step 3. Browsing the Copernicus Open Access Hub
- 3.4 Step 4. Installing Plugins for Qgis
- 3.5 Step 5. Opening Sentinel 2 Data in Qgis
- 3.6 Step 6. Combining and Exporting Seninel-2 Data to GeoTIFF Format
- 3.7 Step 7. Merging Raster Images
- 3.8 Step 8. Symbolizing Raster Layers in Qgis
- 4 References
Introduction
The delineation of shoreline polygons can have a variety of practical applications from shipping and navigation to change detection and mapping coastal erosion. Often shoreline shapefiles are created using a semi-automated method combining automated boundary extraction and manual interpretation. This tutorial will focus on delineating shoreline polygons and polylines from Seninel-2 satellite data using the Naturalized Difference Water Index [NDWI] to define the boundary between water and land. This boundary will then be extracted and manually corrected to produce a final shoreline polygon and polyline file.
The purpose of this tutorial is to show the user how to extract shoreline polygons from satellite data in the Qgis software package. For this tutorial the Copernicus Open Access Hub will be used to access the required satellite imagery. The report will explore how to use this data portal to brows and download the available Sentinel-2 imagery. The satellite imagery will then be imported in to Qgis where polygons and polylines of the shoreline will be created.
Both Qgis and the Copernicus Open Access Hub are free to use, however the Copernicus Open Access Hub does require the user to create an account to download the data. The latest version of Qgis can be downloaded from the following link: (https://www.qgis.org/en/site/ )
Note: QGIS version 3.8.1. was used to create this tutorial. A newer version of the software may be available.
Data
This report will use Sentine-2 satellite data collected by the European Space Agency. The Copernicus Sentinel-2 satellite mission is a constellation of two multispectral polar orbiting satellites [1]. The satellites offer data in the form of Level-1C and Level-2A data products. The Level-C1 products are multispectral satellite images that include the top of atmosphere reflectance. This means they do not have any atmospheric correction applied. Level-2A data products are derived from Level-1C data and offer bottom of atmosphere reflectance. In this case atmospheric corrections have been applied to the image to remove some effects of the atmosphere on the image’s reflectance [2]. It is worth noting that Level-2A data may not be offered for many regions outside of Europe. For this reason, the study will use Level-1C data.
Both the Level-1C and Level-2A data products have differing spatial resolutions depending on the multispectral bands being viewed. This study will use the Red, Green, Blue and NIR bands. All four of these bands have a spatial resolution of 10m with a swath width of 290m. In addition, when the data is downloaded it is projected in the relevant UTM zone using the WGS 83 datum [3].
Tutorial Methods and Instructions
Step 1. Using the Copernicus Open Access Hub
Click on the following link to access the Copernicus Open Access Hub: https://scihub.copernicus.eu/dhus/#/home
- Click on the Login
 icon at the top right of the screen, create an account if you currently do not have an account or login to an existing account (Note: you cannot browse or download the data without creating an account)
 - After logging in you can now browse all of the data offered on the Copernicus Open Access Hub
- To pan the field of view you can click and drag the underlying map you can also zoom in and out using your scroll wheel
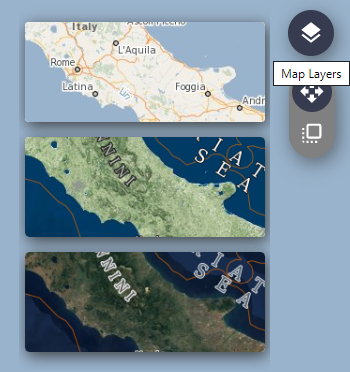
- You can change the basemap of the data portal by clicking on the Map Layers button on the top right of the screen
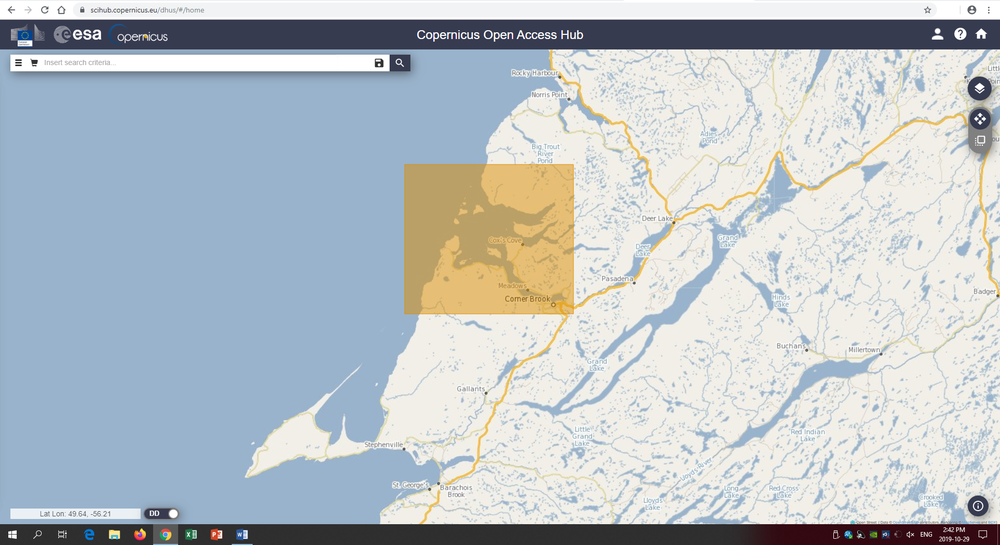
- You can click and drag the scroll wheel to manually draw a rectangle over your area of interest, when you do this a yellow box should appear over the area you selected (Note: if you click and drag the scroll wheel again you will draw a new area of interest and the previous one will be lost)
- Zoom in to the city of Corner Brook, on the west coast of the island of Newfoundland, Canada
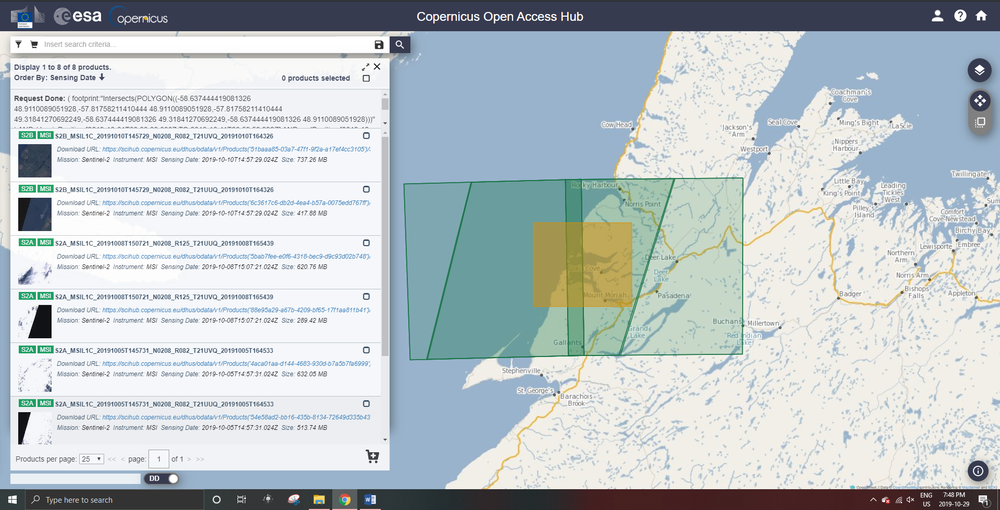
- Click the scroll wheel and draw an area of interest encasing Cox’s Cove, the bay above Corner Brook as seen in the image below.
- Click on the Login
Step 2. Browsing the Copernicus Open Access Hub
- Click on the List
 button on the left of the data search bar
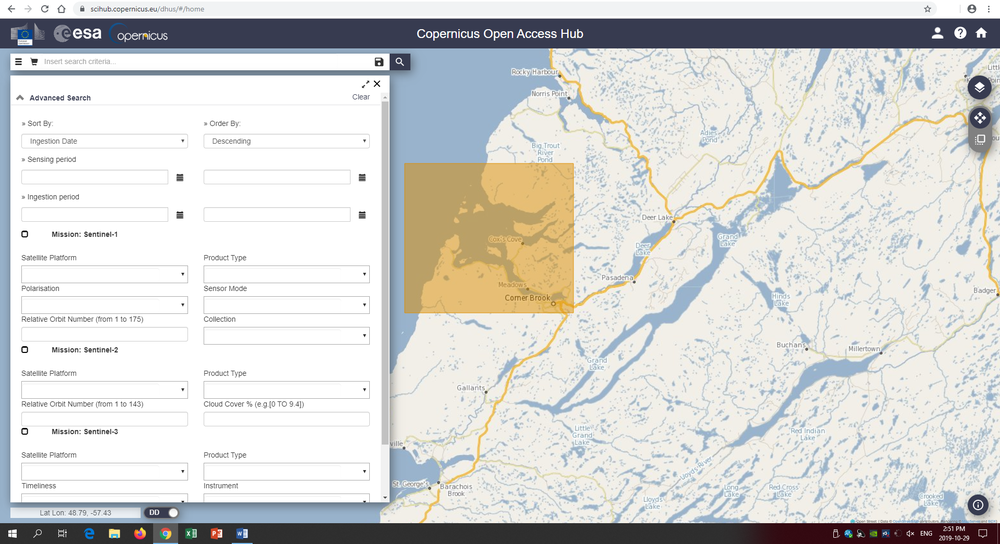
 - You should now see an Advanced Search drop-down menu appear below the search bar as seen below
- This menu will allow you to filter all of the data products offered by the data portal and allow you to search for specific criteria and date ranges
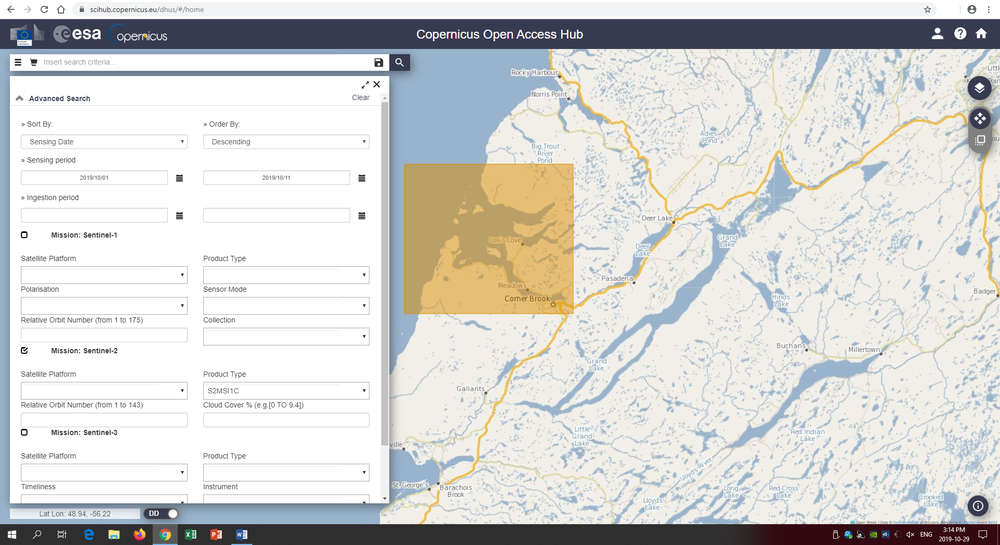
- Under the Sort By header change the option to Sensing Date, this will show you all specified data products in order of when each image was taken
- Under the Sensing Period header select the starting date October 1st 2019 on the left and the end date October 10th 2019 on the right (this will filter the search results to images that were taken on the date range specified)
- Note: if you use the Ingestion Period option you will filter images based on the date they were added to the Copernicus Open Access Hub archive not when the images were taken
- Check the box beside the Mission: Seninel-2 header to restrict all images to only the Seninel-2 satellites
- Under the Product Type header in the Mission: Seninel-2 option select the S2MSI1C option, this will restrict all images to the Level-C1 product type
- Note: using the Satellite Platform option will restrict the filtered images to the selected satellite from the Seninel-2 constellation
- Note: using the Cloud Cover % option allows the user to specify what proportion of the image will be taken up by could cover, this can be useful to quickly filter out cloudy images from your search
- Your search menu should look like the following
- Click on the List
Step 3. Browsing the Copernicus Open Access Hub
- You should now see a list of different images that fit your search criteria from above
- Notice on the basemap the outline of each image footprint can be seen as a green outline
- When you hover your mouse over the images on the left of the screen the corresponding footprint will darken
- Notice how the track of the satellite is broken down into multiple images, very often you will need to download multiple images to get the full coverage needed in a study site
- Examine the different images available, you can click on the View Product Details
 button to get a better look at the image you have selected
 - When you click the View Product Details
 button you will be able to see additional information about the image, including the image footprint, time of acquisition and a variety of metadata
 - Notice each image has an associated name that quickly describes the image and some key pieces of information, here is a breakdown of the most important parts of the naming convention for Sentinel-2 data
- For example, you have the image…
- S2B_MSIL1C_20191010T145729_N0208_R082_T21UVQ_20191010T164326
- S2B: This is the mission ID and satellite that acquired the image (Seninel-2 using the Seninel-2B satellite)
- MSIL1C: This is the product level (Level-C1)
- 20191010T145729: This is the date and start time of acquisition (October 10th, 2019 at 14:57:29pm)
- In addition to this each name acts as a unique identifier for the image
- Find the two following images in the list of search results and click the Download
 icon to download a zipfile of both images
- S2B_MSIL1C_20191010T145729_N0208_R082_T21UVQ_20191010T164326
- Find the two following images in the list of search results and click the Download
- S2B_MSIL1C_20191010T145729_N0208_R082_T21UUQ_20191010T164326
Note: if you are having trouble finding these two images, clear your selections in the search window then cut and paste the image name into the search bar to find each of the images one by one
Step 4. Installing Plugins for Qgis
- Go to the folder where you downloaded the two images and extract both file folders
- Open Qgis
- On the top of your screen click on the Plugin tab
- A window of all the available plugins for Qgis should now appear
- Plugins are different tools created by the Qgis community that add additional functionality to the base Qgis software
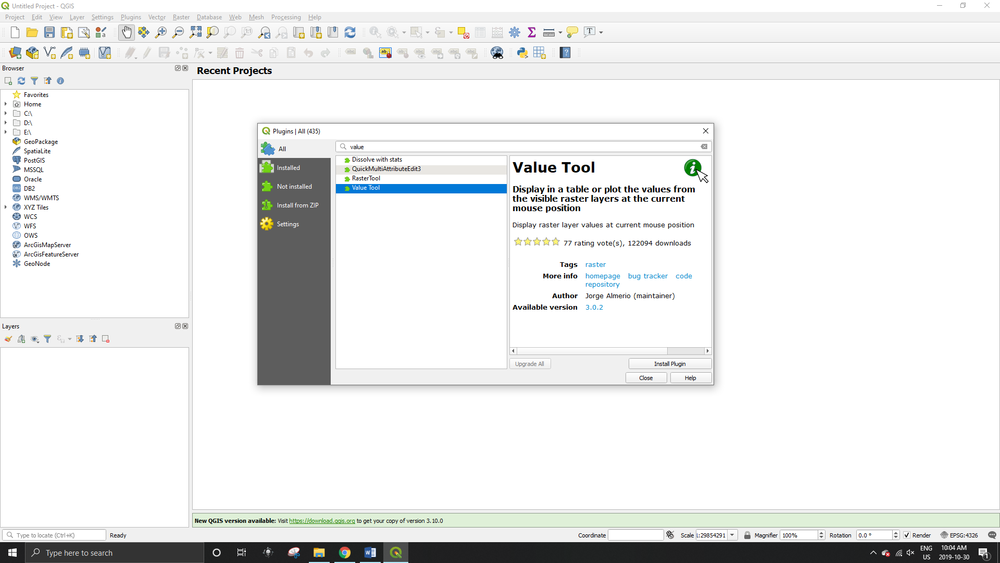
- Search for and download the Value Tool plugin and the Virtual Raster Builder plugin
- After the plugins are installed make sure they are enabled by clicking the checked box next to the tools name
Step 5. Opening Sentinel 2 Data in Qgis
- You can now import the Sentinel-2 imagery into Qgis
- Click on the Open Data Source Manager
 button at the top left of your screen
 - The data source manager window should now pop up, navigate to your folder where the extracted Sentinel-2 images have been stored
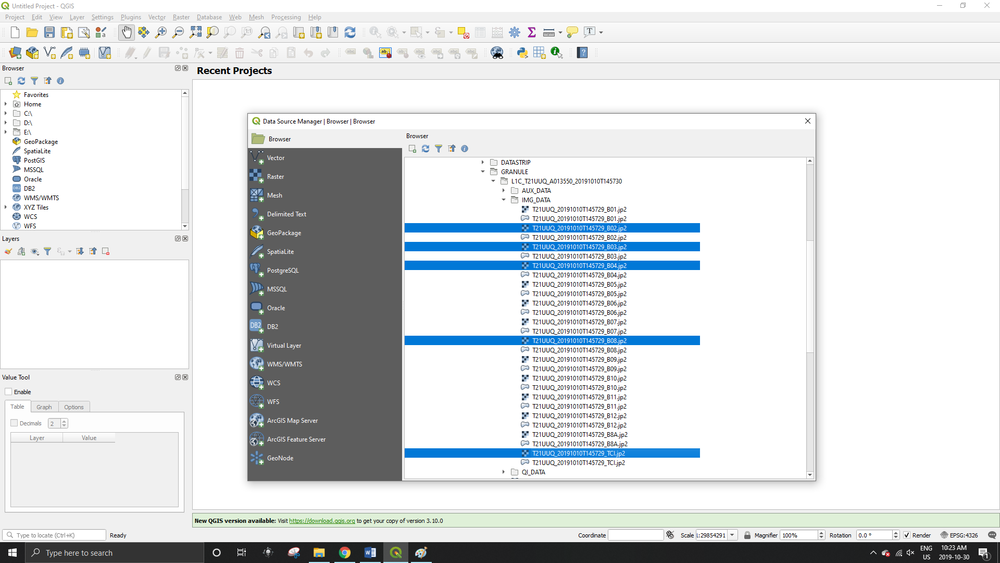
- In the file folder for the first image navigate to the GRANULE > L1C_T21UUQ_A013550_20191010T145730 > IMG_DATA folder
- You should now see a series of .jp2 images that correspond to the bands of the satellite image
- In a Sentinel-2 image Band 2 is the Red band, Band 3 is the Green band, Band 4 is the Blue band and Band 8 is the NIR band
- Each raster image in this file tells you the band number with the last three characters of the name (Example: B02 is the band number 2 corresponding to the Red band)
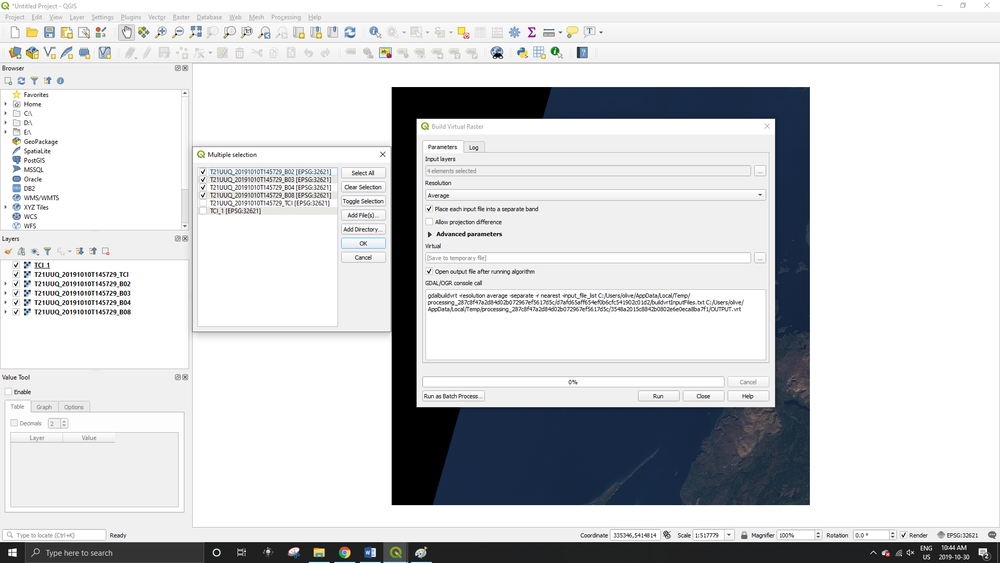
- Select bands 2,3,4,8 and the TCI image from this folder by holding the CTRL key and clicking each file (Note: select the raster image not the polygon file with the same name, see the image below)
- Right click one of the selected bands and select the Add Selected Layers to Project option
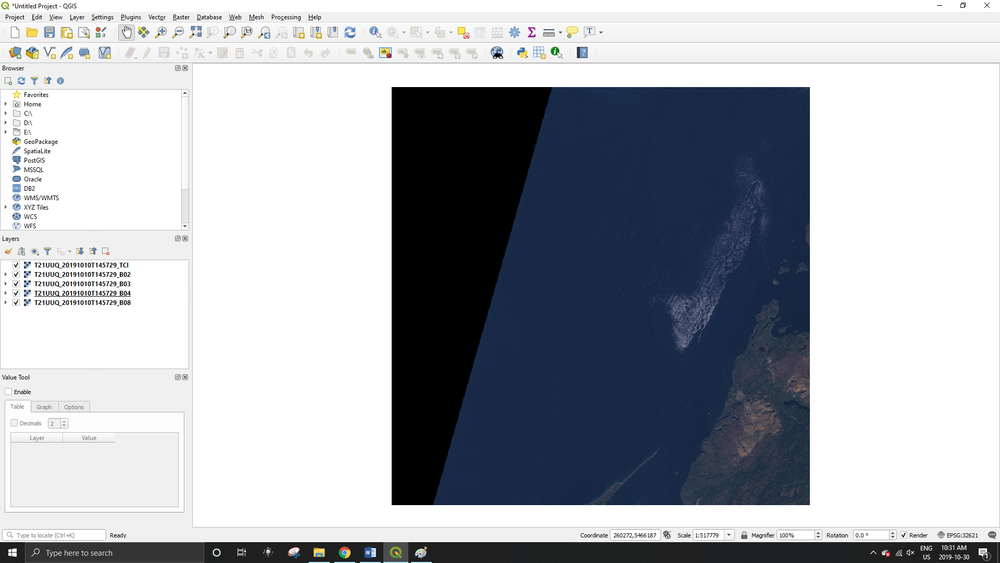
- The selected bands should now be added to your project under the Layers table of contents
- Click through the five bands and look at each (Note: you can change the order of what image is on top by clicking and dragging a raster image under the Layers table of contents)
- Bands 2,3,4 and 8 should all be individual greyscale images
- The TCI image is the true colour image and has the RGB bands mapped to 2,3,4 respectively this is why it is the only colour image out of the five
Step 6. Combining and Exporting Seninel-2 Data to GeoTIFF Format
- The five bands that you imported in step 5 can be opened by Qgis however, most cannot be used with other raster tools in the software
- This is why the Create Virtual Raster plugin has been installed, it gives Qgis some extra functionality so that we may create colour composites out of these individual raster images
- Frist, right click on the TCI band and select Export > Save As…
- Make sure the output format is GoeTIFF and save the file to your working file folder where the two Seninel-2 images are stored, give it a name like "TCI_1.tif"
- Keep all the default parameters and click OK
- The GeoTIFF version of the TCI image should now be added to your Layers table of contents
- Second, we will create a colour composite image from the four individual bands you previously imported
- Navigate to the Build Virtual Raster tool by clicking on Raster > Miscellanies > Build Virtual Raster… under the main toolbar
- The Build Virtual Raster tool window should now pop up
- Under the Input Layers header click the … button and add bands 2, 3, 4, 8 in this order
- Keep all default options and click Run
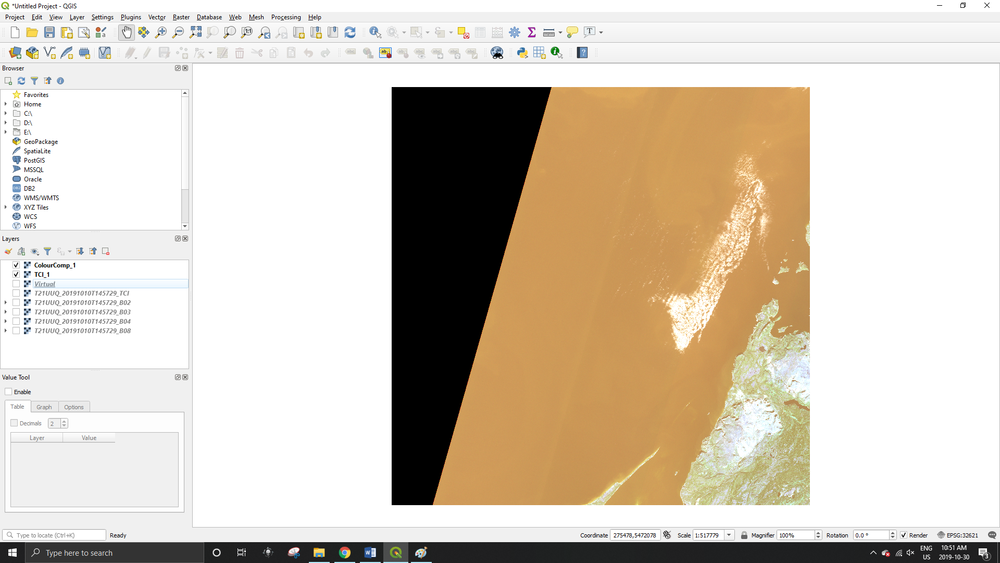
- After the tool has completed you should now have a temporary virtual raster added to your Layers table of contents
- The image may look slightly orange like in the example below (This is due to the way the image is symbolized, don’t worry we will change this later)
- Note that the bands have been renamed in the virtual raster from 2,3,4, 8 to 1,2,3, and 4 respectively (They should still be in the order in which you added them to the Build Virtual Raster tool)
- Right click the virtual layer and select Export > Save As…
- Make sure the output format is GoeTIFF and save the file to your working folder, give it a name like "ColourComp_1.tif"
- Keep all the default parameters and click OK
- You should now have a GeoTiff version of the TCI image and a Colour Composite image
- Under the Layers table of contents select the five bands previously imported and the temporary virtual raster by holding the CTRL key and clicking each image
- Right click one of the selected rasters and select Remove Layer to remove them from your project
Step 7. Merging Raster Images
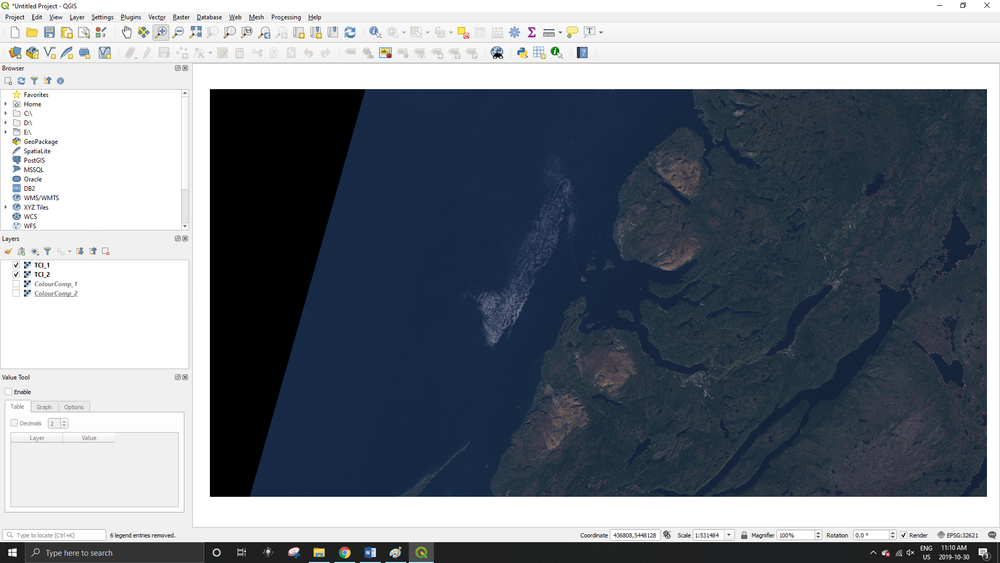
- Repeat steps 5 to 6 using the second Seninel-2 image giving the output GoeTIFFs different names like "TCI_2" and "ColourComp_2"
- You should now have two colour composite images and two true colour images, one for each half of the full Senienl-2 Scene
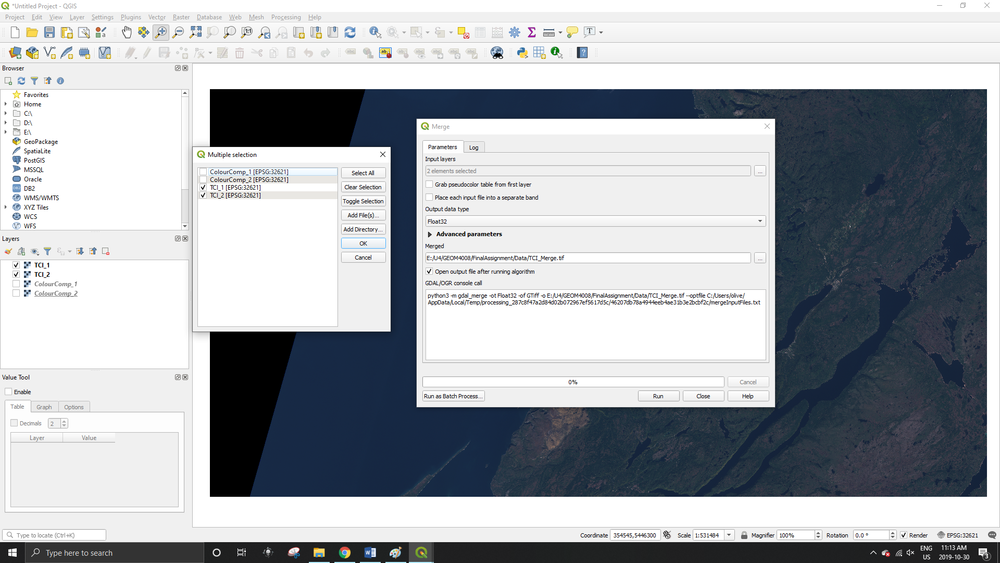
- We can now merge the two halves of both the true colour and colour composite scenes using the Merge raster tool
- Navigate to Raster > Miscellanies > Merge the merge raster tool window should now appear
- Select the two TCI rasters then click run
- This will produce another temporary raster so you will need to export and save the merged file to a new GeoTIFF file using Export > Save As…
- Repeat the merge process with the two halves of the colour composite image
- You should now have two complete rasters, one a true colour image and one a colour composite image
- Right click the unmerged rasters and remove them from the project using the Remove Layer option
Step 8. Symbolizing Raster Layers in Qgis
- In Qgis you are able to change the way raster layers are symbolized
- To change a raster’s symbolization right click the layer and select Properties
- Under the various headers there are options for changing the image’s saturation, contrast, brightness, minimum value, maximum value and band mapping
- We will now create a false colour image from the colour composite merge layer
- Right click the colour composite merge raster and select Properties
- Under the band rendering window, you should be able to see what bands have been assigned to the Red, Green and Blue bands (Note: the band numbers have changed in this image after creating the first colour composite image back in step 6 Band 1 in this image is the Red band from the Sentinel 2 data, Band 2 is the Green band and Band 3 is the Blue band, Band 4 is NIR)
- A common false colour image combination used to view vegetation and water is NIR mapped as (red) , Green mapped as (blue) and Red mapped as (green)
- This combination highlights vegetation in red because vegetation reflects large amount of NIRlight
- Change the assigned bands under the Band Rendering header so that Red is assigned to band 4, Green is assigned to band 3 and Red is assigned to band 2, click OK
- The image should now appear as a false colour image seen below
- You can adjust the brightness on both the false colour and true colour image to your liking using the brightness slider in the Layer Properties window
