Difference between revisions of "Albedo Data and Surface Reflectance Data Visualizations in SNAP using MODIS Imagery"
SpenserZhang (talk | contribs) |
SpenserZhang (talk | contribs) |
||
| Line 38: | Line 38: | ||
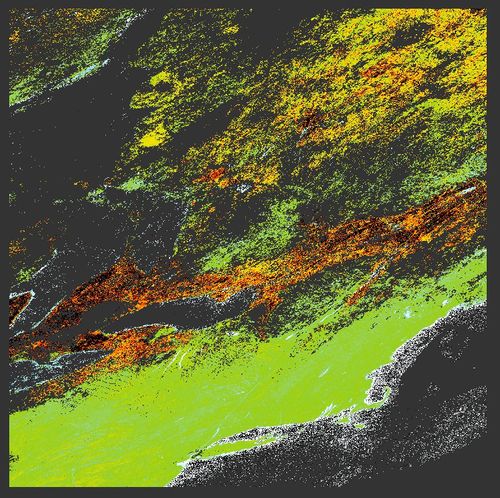
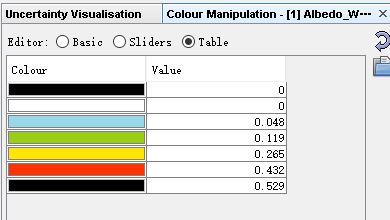
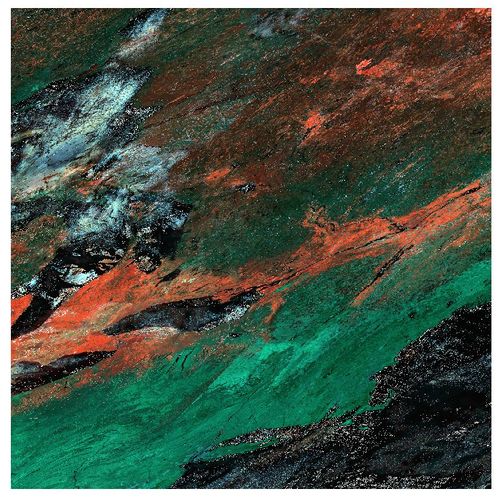
The output map with albedo value is shown below, and you can view each colour correspond to the relative albedo value under (Colour Manipulation - Table). |
The output map with albedo value is shown below, and you can view each colour correspond to the relative albedo value under (Colour Manipulation - Table). |
||
| − | [[File:Albedo snap.JPG | 500px]] |
+ | [[File:Albedo snap.JPG | 500px]] [[File:Tablealbedo.JPG | 500px]] |
===Surface Reflectance Visualization=== |
===Surface Reflectance Visualization=== |
||
Revision as of 17:01, 3 December 2019
Contents
Purpose
Introduction
Albedo
Albedo is the ratio of the amount of irradiance that is reflected by a surface to the total incoming irradiance. Albedo measured on a scale from 0 to 1. For example, a white-colored object reflects most of the incoming light and absorbs very little whereas, a black object will absorb most of the incoming light.
MODIS
MODIS is Moderate Resolution Imaging Spectroradiometer.
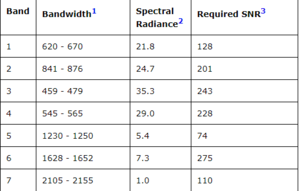
MODIS has 36 bands in total, but we are going to use band 1 to band 7 in this project. Band wavelength for all 1 to 7 are in nm.
Methods
Data Acquisition
Albedo Visualizations
Open the albedo product in SNAP and select "Albedo_WSA_shortwave" under the band selection. The MODIS albedo product provides three different types of albedo value, bidirectional, black sky albedo and white sky albedo. In this tutorial, we are going to visualize WSA (white sky albedo).
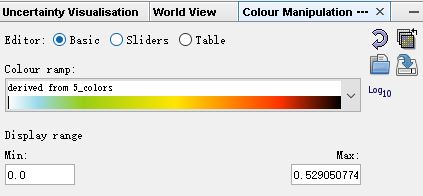
Go to Colour Manipulation, select "Basic" as editor type and choose a proper colour ramp. For albedo product, we usually choose light colour to represent small albedo area and dark red colour to represent high albedo area.
The output map with albedo value is shown below, and you can view each colour correspond to the relative albedo value under (Colour Manipulation - Table).
Surface Reflectance Visualization
NDSI
Remote sensing index can be calculate by MODIS image.
NDSI is Normalized Difference Snow Index. NDSI are commonly used in cloud or snow differentiation. Cloud and snow are all shown as bright colour in a true colour image, however, snow is getting darker when the wavelength is greater than 1.6mm. According to the MODIS band wavelength above, for MODIS data the NDSI is calculated as:
NDSI = (Band 4 - Band 6) / (Band 4 + Band 6)
The calculation can be done by "Raster Calculator" under Data Management Tool.
