Difference between revisions of "Using map algebra in GRASS"
| Line 79: | Line 79: | ||
== Conclusion == |
== Conclusion == |
||
| + | map calc is a very useful skill to know in GRASS as GRASS is used to do a lot of analysis of raster data and in order to do that you need to know how to manipulate raster data. I made this tutorial because I had trouble with GRASS and hopefully this will help someone else have not as much trouble. |
||
| − | waiting until all the other sections are done |
||
| − | will say how important this skill is and try to relate it to real world |
||
== References == |
== References == |
||
Revision as of 02:29, 21 December 2020
Using Map Algebra and the command line in GRASS
Contents
Introduction
GRASS is a geographic information system (GIS) software that is used for geospatial data management and analysis. If you find yourself working on raster data specifically in GRASS it may be very useful to know how to use map algebra in order to manipulate the data so that you can properly analyze it. also it is important to know how to use this tool using the command line instead of the graphical user interface (GUI) and so to that end for this whole page all of the examples will be done using the command line commands.
Map algebra
What is Map Algebra?
map algebra is a way in GRASS to perform arithmetic on raster layers in maps. the way that it works is that it will take two raster layers and it performs an operation on them based on what you tell it to do. for example if you wanted to cut a raster image down to the study area of another you could do that by using the fallowing command:
r.mapcalc --overwrite rasterAnew=”if(rasterB, rasterA)”
this command basically tells the program that for the new raster that you are creating if raster B(the study area) is in that location then put raster A(the raster you are cutting) there, meaning that the end result should be whatever you are measuring in raster A in just the area of raster B.
What can you do with Map Algebra?
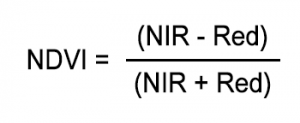
there is a lot that you actually can do with map algebra it is not just limited to changing the shape of raster files it can also be used to shift raster files geographically or to edit the values of each pixel of raster files meaning that you could subtract or add raster layers to landsat photos. this is one way to create colour photos from landsat imagery if you add the red green and blue layers together you get real colour photos. you can also use this technique to make different indexes from satellite photos which can be used to tell things like plant life from the inferred layer and the red layer to create an NDVI index.
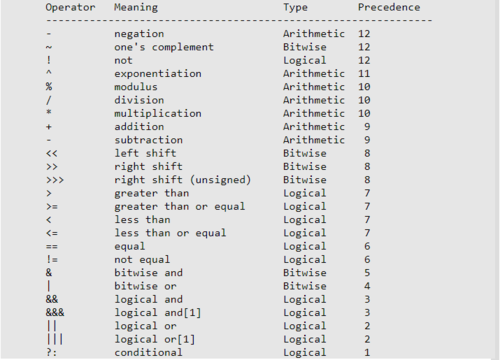
The method for using these operators works like this:
- Start with the command which in this case is: r.mapcalc
- Then you want to add the file you are creating: newFile=
- Then you add in your operator and variables for example: !fileA which means not file A
r.mapcalc newFile= !fileA
this will give you a raster that is the inverse of file A
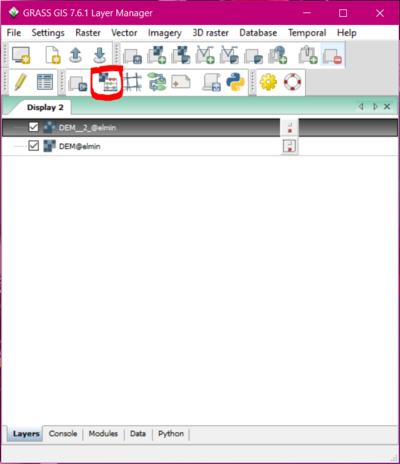
the other way to do map calc is without the command line using the map calculator built into the GUI which is accessed using the button shown below.
Examples
Subtracting raster to fit into study area
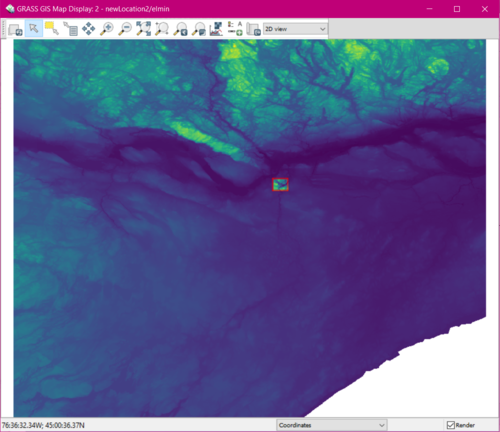
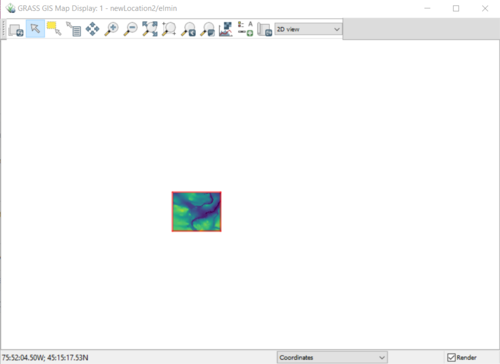
For this first example the DEMs that are used can be obtained from the Government of Canada website. However, this example will work with any raster file in the same situation. to start I have two DEMs one that is smaller than the other as you can see in the picture.
In order to subtract the excess from the large DEM to make it the same size as the as the smaller DEM which for this example will be our study area I used the command
"r.mapcalc --overwrite expression=DEM = DEM@elmin if( DEM@elmin, DEM__2_@elmin)" (elmin is the mapset name just happens that is my username on my computer).
the result as you can see in this picture is that both rasters fit in the study area.
Creating NDVI index using landsat data
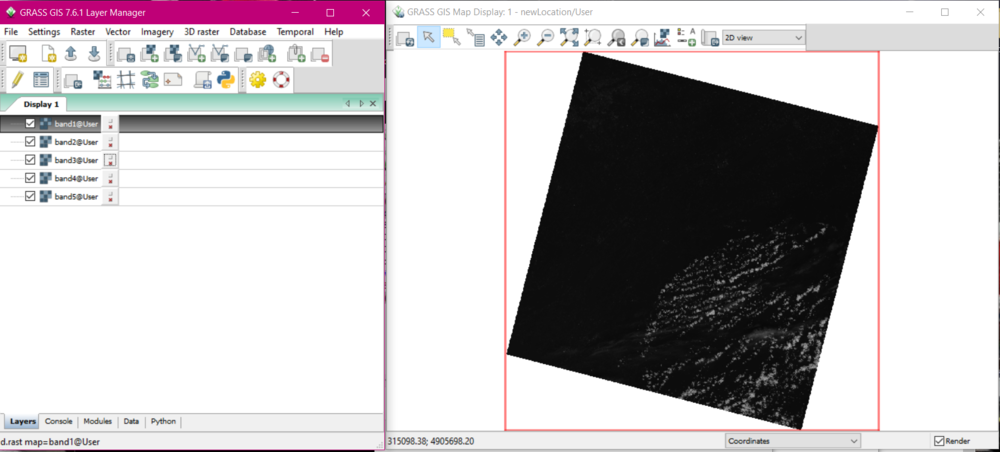
for this example I have obtained some data from USGS which is free to get you just need to create account with them. In this example we will be calculating NDVI which stands for normalized difference vegetation index from landsat images. this index is used to help tell the health of plants from satellite images as you can see from the image below you need to start by uploading your landsat imagery into GRASS for this particular index you need bands four and five I have bands one through five here. You can use this method to create any index but for the example I have chosen NDVI because it is a very common index.
next you have to open the command line so that you can enter the following command:
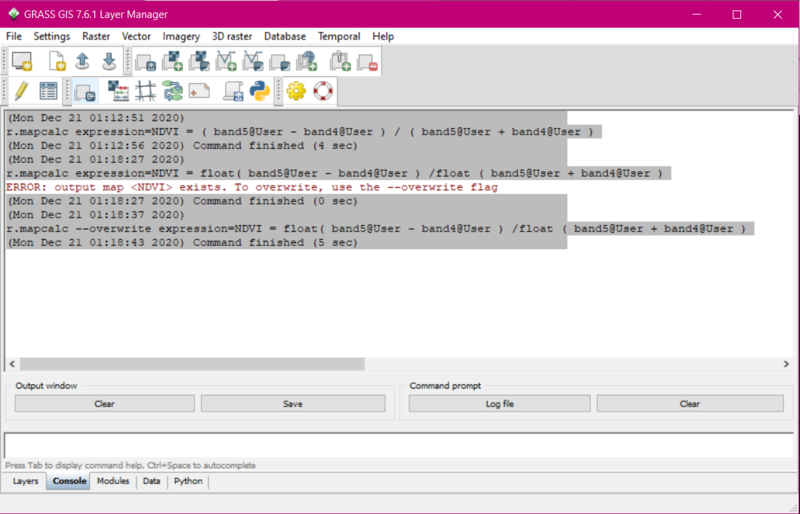
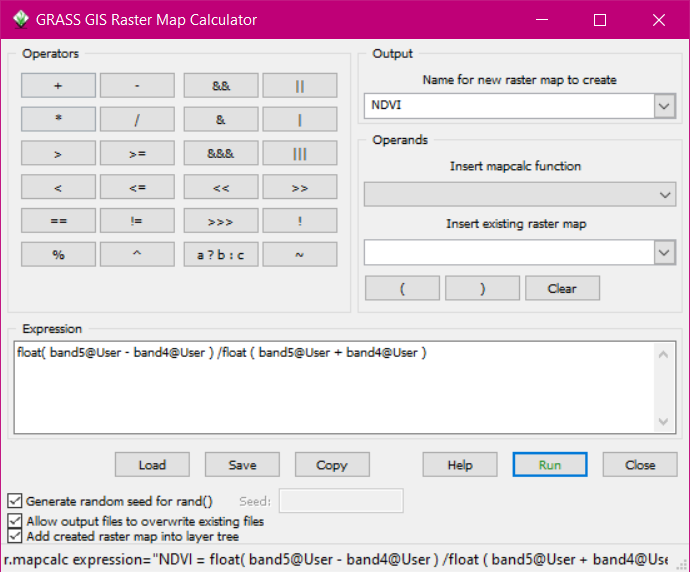
NDVI = float(band5 - band4)/float(band5 + band4)
in the example you can see that I forgot to add the float for each calculation the first time I tried it. it is important to add that because without that your result won't be correct, this is because the actual number for each pixel in an index is not an integer it is usually a decimal number so making sure the type of number is a float is important.
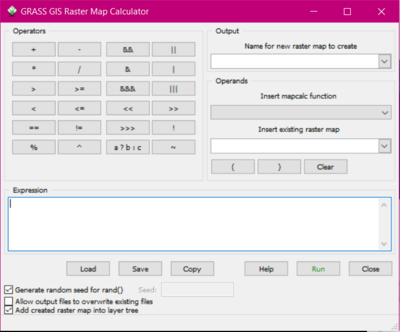
if you were to use the mapcalc calculator in the GUI it would like this:
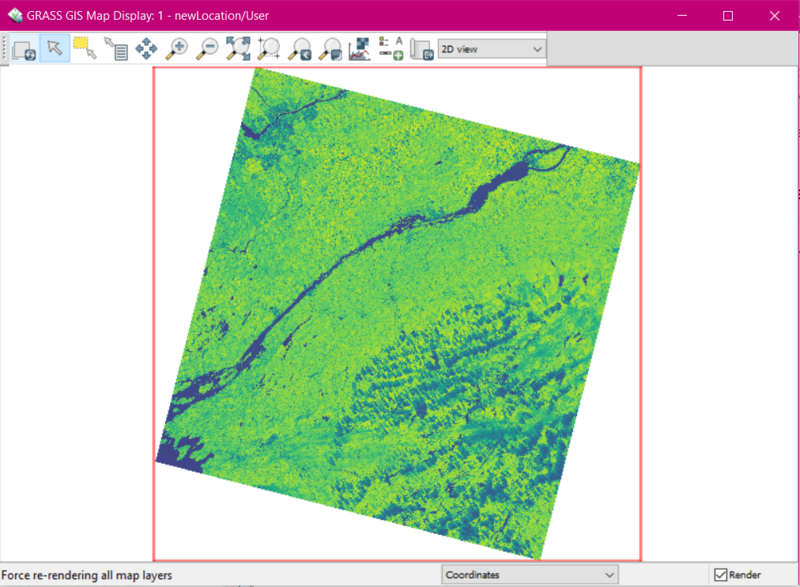
then after you run the command it will look like this:
that is how you make an index using mapcalc.
Conclusion
map calc is a very useful skill to know in GRASS as GRASS is used to do a lot of analysis of raster data and in order to do that you need to know how to manipulate raster data. I made this tutorial because I had trouble with GRASS and hopefully this will help someone else have not as much trouble.
References
“Mapcalc Manual.” GRASS GIS Manual: R.mapcalc, GRASS Development Team, grass.osgeo.org/grass76/manuals/r.mapcalc.html.
