Difference between revisions of "Exploring the Thematic Capabilities of OpenJump"
Stephenplume (talk | contribs) |
|||
| (75 intermediate revisions by 4 users not shown) | |||
| Line 1: | Line 1: | ||
== Purpose == |
== Purpose == |
||
| − | The purpose of |
+ | The purpose of this tutorial will be to demonstrate the thematic capabilities of the software OpenJUMP, inclusing how the program visualizes vector data and how users can add and change feature layer properties and symbologies. Basic capabilities will be shown through a series of examples using data from the National Capital Commission. Additional features of the program will also be discussed. Upon learning about and exploring the software's thematic capabilities, users will become more familiar with OpenJUMP and may potentially use this open source program in the future as an alternative or a complement to other proprietary GIS software. |
== Introduction == |
== Introduction == |
||
| + | OpenJUMP is an open source Geographic Information System (GIS), formally known as JUMP (JAVA Unified Mapping Platform), created by Vivid Solutions Inc. in 2002. Today, the software is developed and maintained by a group of global volunteers. The program is free to use and runs on Windows, Linux, and Mac platforms. OpenJUMP can read and write shapefiles and utilizes Open Geospatial Consortim (OGC) standards such as GML, WFS and WMS. Learn more about OpenJUMP [http://ojwiki.soldin.de/index.php?title=Main_Page HERE]. In this tutorial, you will explore the program's capabilities in editing and symbolizing attribute data and creating maps for export. |
||
| − | OpenJump is an open source Geographic Information System that has been created by volunteers around the world. The program is capable of analyzing shapefiles and simple GML files, and displays the images. The particular strength of this program is its ability to edit geometry and attribute data which this tutorial will demonstrate. Using datasets provided from the Carleton database, this tutorial will pick data that can be easily understood and displayed on the program and then alter and edit it. This project will use data provided from the City of Ottawa, National Capital Commission, and the Rideau Valley Conservation Authority Thematic Data. These files have provided a number of geospatial datasets that include activities, assets, biophysical, boundaries, mapping, and planning. |
||
== Methods == |
== Methods == |
||
| − | ---- |
||
=== Getting Started === |
=== Getting Started === |
||
| − | The first step of this tutorial |
+ | The first step of this tutorial is to download the OpenJUMP software. [https://sourceforge.net/projects/jump-pilot/files/OpenJUMP/1.16/ HERE]. OpenJUMP 1.16 is the latest version of the software released in January 2021. |
| + | ''Note: OpenJUMP is written in the Java programming language. Users who do not have the Java Runtime Environment intalled on their machines will be prompted to install it prior to launching the GIS.'' |
||
| − | </center>"[[File:Figure133.jpeg|700px|]]"</center> |
||
| + | [[File:OpenJUMPdownload.png]] |
||
| − | Figure 1. The red circle shows where you can click to download the software and all of its packages |
||
| + | ''Figure 1. Screenshot of the JUMP Pilot Project webpage - Select "Download Latest Version" to get started (09/25/21)'' |
||
---- |
---- |
||
=== Collecting the Data === |
=== Collecting the Data === |
||
| − | The data |
+ | The data used for the purposes of this tutorial is provided by the National Capital Commission (NCC) under the Carleton Unviersity GIS Data Use Agreement. Authorized users including Carleton students, faculty and staff can download the data from the MacOdrum Library [https://library.carleton.ca/find/gis/geospatial-data/national-capital-commission-thematic-data HERE]. |
| + | [[File:NCCDataDownload.png]] |
||
| − | </center>[[File:blahblahblah.jpeg|700px|]]</center> |
||
| + | ''Figure 2. Screenshot of MacOdrum Library data webpage - Select the text highlighted in red to access the data (09/25/21)'' |
||
| − | </center>''Figure 2. This is where you can access the information used in this tutorial''</center> |
||
| + | Only a select few of the datasets available are needed for the tutorial. Download the .Zip files from the list below (see also Figure 3) and save them to a designated folder on your computer. |
||
| + | *Activities.ZIP |
||
| + | *Boundaries.ZIP |
||
| + | *CanMap.ZIP (found in "Mapping" folder) |
||
| + | [[File:NCCDataFiles.png]] |
||
| + | |||
| + | ''Figure 3. NCC thematic datasets available for download - Select the files beside the arrow and underlined in red to begin downloading (09/25/21)'' |
||
---- |
---- |
||
| − | === |
+ | === Importing the Data === |
| + | To import the downloaded data, launch OpenJUMP and select the folder icon in the left-hand corner of the toolbar. In the dialog box (Figure 4), browse for the data and select the files (Activities.zip, Boundaries.zip, CanMap.zip) to load them into the project space, then click "Next". When prompted to select the type of file for each file extension, simply click "Finish" to import the data and complete this step. |
||
| − | Open up OpenJump, then click on the file in the top left corner of the screen and then locate the downloaded files provided from the National Capital Commission. For this tutorial only the select few layers will be needed: Activities, Boundaries, and CanMap. |
||
| − | [[File: |
+ | [[File:ImportData.png]] |
| − | Figure |
+ | ''Figure 4. Blank project in OpenJUMP - Click the folder icon circled in red, select the three .zip files shown and click "Next"'' |
| + | Once the data is loaded into the project, you will need to tidy and organize the feature layers. Start by selecting or 'toggling on' the layers needed for this tutorial from the list below: |
||
| − | From this step on, you will need to select the files that this tutorial will use to edit which are: |
||
'''Activities:''' |
'''Activities:''' |
||
| + | *Picnic_Areas_2011.shp |
||
| − | *Picnic Areas |
||
| + | *Recreations_Paths_and_Trails_2011.shp |
||
| − | *Recreation, Paths, and Trails |
||
| − | *Canoe and Camping |
||
'''Boundaries:''' |
'''Boundaries:''' |
||
| + | *Gatineau_Park_New_1997.shp |
||
| − | *Regions |
||
| + | *Municipal_Parks.shp |
||
| − | *Gatineau Park |
||
| + | *National_Capital_Region.shp |
||
| − | *Municipal Parks |
||
| − | '''CanMap''' |
+ | '''CanMap:''' |
| − | *Roads |
+ | *Roads.shp |
| − | [[File: |
+ | [[File:ProjectMapView.png]] |
| − | + | ''Figure 5. Map view in OpenJUMP - Once data is imported, organize the feature layers in the table of contents on the left (Colours may vary)'' |
|
| + | |||
| + | To delete unnecessary layers from the project, right-click on the layer in the table of contents and select "Remove Selected Layers" (Figure 6). Next, determine the layers' drawing order on a map by ordering the list of layers in the table of contents. This can be done by clicking and dragging each layer to the desired position. Layers can also be renamed for easier identification by double-clicking on the layer. |
||
| + | |||
| + | [[File:FeatureLayerMenu.png]] |
||
| + | |||
| + | ''Figure 6. Feature layer pop-up menu - Remove selected layers, view attribute data or open the style dialog by selecting the option highlighted in red'' |
||
---- |
---- |
||
| − | === |
+ | === Symbolizing the Data === |
| + | We will now symbolize the imported feature layers using a variety of symbolization methods available in the software. This section will primarily focus on single symbol, graduated colours, and unique values symbologies. Colour-based symbology options will also be explored to represent specific attributes. This will allow us to combine symbols with map elements to visualize selected geographic features and have the ability to create a range of thematic maps for academic or professional use. |
||
| + | ;Single Symbol (Polygons) |
||
| + | To change the colour of a polygon layer, simply right-click on the layer, find "Style" on the side menu, then select "Change Styles" (Figure 6). A dialog box will appear with a number of tabs that allow you to change the visual properties of a layer. In the "Rendering" tab, you can change the fill, line width and transparency of a polygon layer (Figure 7). OpenJUMP offers a number of presets, or you can customize the colour of a symbol by clicking on the three dots to open the "Change Colour" dialog (Figure 8). A range of colour swatches are available to choose from or you can create a colour scheme using tools such as ColorBrewer [https://colorbrewer2.org/] and input custom RBG and HEX colour codes. Once finished, select "Apply" then "OK" to close the dialog. |
||
| + | For this example, start by changing the colour of the Gatineau Park boundary layer (see Figure 7). Next, try changing the colour of the boundary layer for the National Capital Region. |
||
| + | |||
| + | [[File:SingleSymbolPolygon.png]] |
||
| + | |||
| + | ''Figure 7. Applying single symbol symbology - In the "Rendering" tab, change the fill and line colours from the presets on the right or click on the three dots circled in red for more options. Click "Apply" to save and view your changes'' |
||
| + | |||
| + | [[File:AdvancedColours.png]] |
||
| + | |||
| + | ''Figure 8. Advanced colour options in OpenJUMP'' |
||
---- |
---- |
||
| + | ;Single Symbol (Points) |
||
| − | === Symbology === |
||
| + | To change the symbol and colour of a point feature layer, open the “Change Styles” dialog box again by right-clicking on the desired layer. In the “Rendering” tab, check the “Vertices Size” box and use the sliding scale or text box to adjust the size of point features (Figure 9). From the “Point Display Type” drop-down menu, you can choose from shapes including square, circle, triangle, cross, star, or Bitmap. This option allows you to select an image to represent the data. The line and fill colours of the symbol can then be changed in the same manner as the above example. |
||
| + | |||
| + | [[File:SingleSymbolPoint.png]] |
||
| + | |||
| + | ''Figure 9. Point feature symbology – In the “Rendering” tab, select the option for “Vertices Size”, adjust the symbol size, and choose the display type/shape'' |
||
| + | |||
| + | To access more symbol options within the program, use the “VertexSymbolPlugin” tool. This tool can be accessed in the right-hand corner of the toolbar. First, ensure that the desired layer is in editable mode by right-clicking on the layer in the table of contents. Within the “Vertex Symbol Dialog” box (Figure 10), select from the options in the “Vector” and “WKT Shapes” tabs. Enter the size in the text box and click “OK” to apply changes. |
||
| + | [[File:VertexPlugin.png]] |
||
| + | ''Figure 10. Vertex Symbol Plugin – For more point symbol options, open the dialog from the paint icon on the toolbar, choose the desired symbol, and set the size'' |
||
---- |
---- |
||
| + | ;Unique Values |
||
| − | === Digitizing === |
||
| + | To symbolize data based on unique attribute values, a colour theme will be chosen to symbolize each respective value. The number of colours will vary depending on the number of unique values in a given attribute and will allow map viewers to differentiate between different qualitative features. |
||
| + | For this tutorial, you will use unique value symbology to visualize the different types of trails within the area of interest. To begin, right-click on the Activities/Recreation_Paths_and_Trails layer and open the “Change Styles” dialog box. Select the “Colour Theming” tab and check the box to enable colour theming (Figure 11). From this step, choose the attribute “TRAIL_TYPE” from the drop-down menu and set the classification method as “Unique Value”. Then, select the colour scheme of your choice from the options in the drop-down menu. There are a number of sequential, diverging, and random colour schemes from Colour Brewer and Visual Mining Inc. The table displays the unique values and the corresponding colour as well as the label (how it will appear on the map legend). You can also use the sliding scales or text boxes to adjust the transparency and line width of the features. |
||
| + | [[File:UniqueValues.png]] |
||
| + | |||
| + | ''Figure 11. Unique Values Symbology – In the “Colour Theming” tab, enable colour theming, select the attribute ‘TRAIL_TYPE’ and set the classification method as ‘Unique Value’. Choose a colour scheme from the drop-down menu and adjust the transparency and line width highlighted in red'' |
||
---- |
---- |
||
| + | |||
| + | ;Graduated Colours |
||
| + | Graduated colour symbology can be used to classify data into ranges based on a given attribute field. The selected classification method and number of classes determine how the data is distributed between the ranges and the number of assigned colours. Using the NCC data, we can symbolize the municipal parks in the area of interest by their size (hectares). First, open the “Change Styles” dialog for the layer and enable colour theming (Figure 12). From the set of drop-down menus, set the attribute as ‘HECTARES’ and select an appropriate classification method and range count. After this step, select a colour scheme from the drop-down menu and edit your labels to the desired number of decimal places. |
||
| + | |||
| + | Classification Methods in OpenJUMP: |
||
| + | *Unique Value |
||
| + | *Equal Interval |
||
| + | *Quantile/Equal Number |
||
| + | *Mean Standard Deviation |
||
| + | *Maximal Breaks |
||
| + | *Jenks Optimal Method |
||
| + | |||
| + | [[File:GraduatedColours.png]] |
||
| + | |||
| + | ''Figure 12. Graduated Colour Symbology – In the “Colour Theming” tab, set the classification and range count underlined in red and choose a colour scheme from the drop-down menu. Edit the appearance of attribute labels on the map legend by double-clicking each label'' |
||
| + | ---- |
||
| + | |||
| + | === Labeling === |
||
| + | Labels can be used in thematic maps to describe features of an attribute such as names of provinces, parks, and water bodies. To add labels in OpenJUMP, open the “Change Styles” dialog and enable labelling in the “Labels” tab (Figure 13). From this step, select the label attribute field ‘NAME’ and use the drop-down menu to set the position, alignment, and height of the label. You can also change the colour and font of the text. |
||
| + | |||
| + | [[File:Labelling.png]] |
||
| + | |||
| + | ''Figure 13. Adding feature labels – In the “Labels” tab, select the attribute field ‘NAME’ and explore the options for label positioning, alignment and height as well as colours and fonts available'' |
||
| + | ---- |
||
| + | |||
| + | === Final Image === |
||
| + | Now that we have discovered some of the basic thematic capabilities of the software, we can explore how to create and export maps in OpenJUMP. In the program’s layout view (Figure 14), we can view our data frame and add cartographic elements including a title, legend, north arrow, and scale. Select the printer icon in the right-hand corner of the toolbar to view your map in layout view/“Printer Setup”. Next, select the “Furniture” button to open a dialog box. Navigate through the different tabs to customize and add cartographic elements to the print view including a title, scale bar, north arrow (Figure 16), and a legend (Figure 17). Before applying changes, ensure that the “Show” box is checked for each element to display it on the final map image. |
||
| + | |||
| + | [[File:OpenPrinterSetup.png]] |
||
| + | |||
| + | ''Figure 14. Printer Setup in OpenJUMP - Select the printer icon on the main toolbar to view, edit, and export your final map. Add map elements by selecting "Furniture" circled in red and change the orientation of the map by selecting "Page Setup" at the bottom of the dialog'' |
||
| + | |||
| + | |||
| + | [[File:FurnitureNorthArrow.PNG]] |
||
| + | |||
| + | ''Figure 15. Furniture dialog - Add a North Arrow to your map by selecting from the styles available'' |
||
| + | |||
| + | |||
| + | [[File:FurnitureLegend.png]] |
||
| + | |||
| + | ''Figure 16. Furniture dialog - Add a Map Legend to your map by selecting the layers you want to include, creating a title, choosing your type and adding a border (optional)'' |
||
| + | --- |
||
== Conclusion == |
== Conclusion == |
||
| + | From this tutorial, you have hopefully gained some familiarity with the software OpenJUMP and learned about its thematic capabilities. You will also have successfully symbolized different types of data using a selection of methods and explored how to add cartographic elements to your maps. You are now able to explore more of the capabilities in this program including plugins and use them in future mapping projects. |
||
Latest revision as of 11:58, 1 October 2021
Contents
Purpose
The purpose of this tutorial will be to demonstrate the thematic capabilities of the software OpenJUMP, inclusing how the program visualizes vector data and how users can add and change feature layer properties and symbologies. Basic capabilities will be shown through a series of examples using data from the National Capital Commission. Additional features of the program will also be discussed. Upon learning about and exploring the software's thematic capabilities, users will become more familiar with OpenJUMP and may potentially use this open source program in the future as an alternative or a complement to other proprietary GIS software.
Introduction
OpenJUMP is an open source Geographic Information System (GIS), formally known as JUMP (JAVA Unified Mapping Platform), created by Vivid Solutions Inc. in 2002. Today, the software is developed and maintained by a group of global volunteers. The program is free to use and runs on Windows, Linux, and Mac platforms. OpenJUMP can read and write shapefiles and utilizes Open Geospatial Consortim (OGC) standards such as GML, WFS and WMS. Learn more about OpenJUMP HERE. In this tutorial, you will explore the program's capabilities in editing and symbolizing attribute data and creating maps for export.
Methods
Getting Started
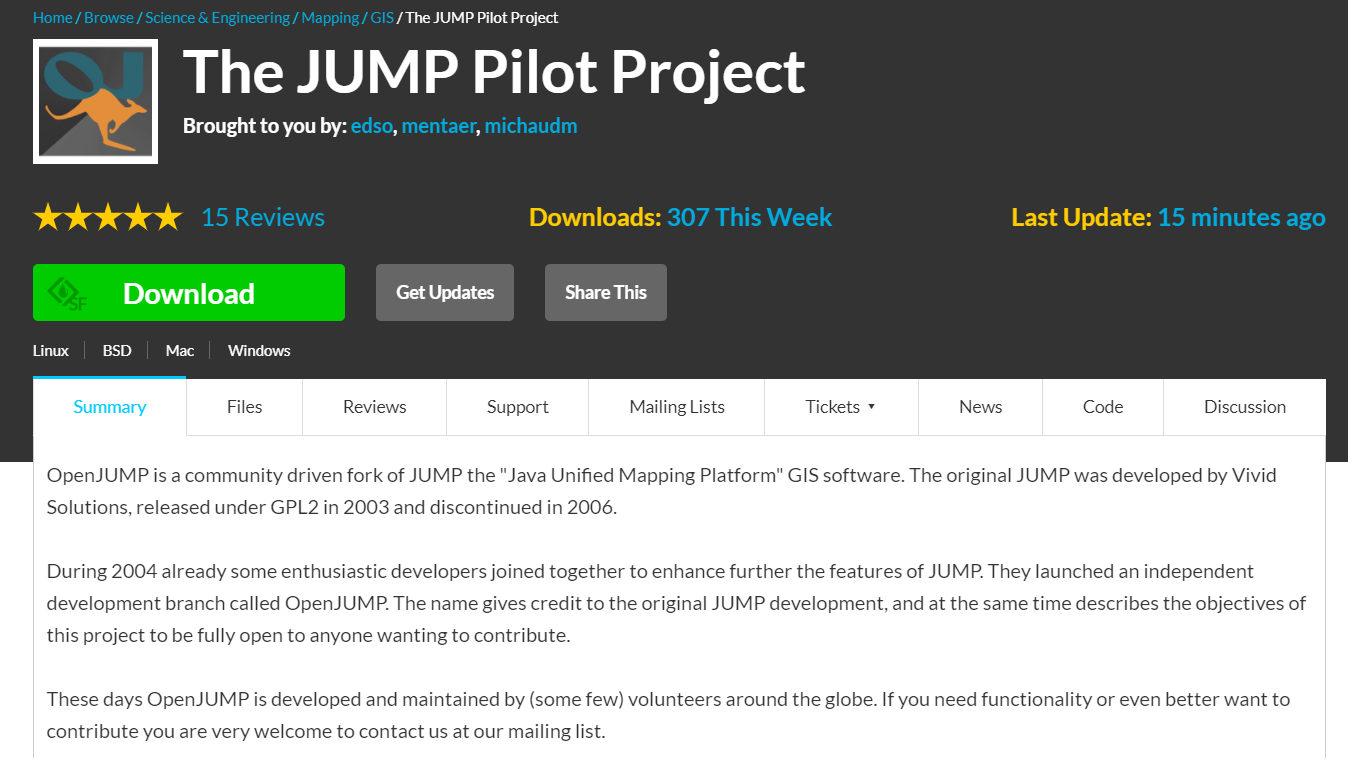
The first step of this tutorial is to download the OpenJUMP software. HERE. OpenJUMP 1.16 is the latest version of the software released in January 2021.
Note: OpenJUMP is written in the Java programming language. Users who do not have the Java Runtime Environment intalled on their machines will be prompted to install it prior to launching the GIS.
Figure 1. Screenshot of the JUMP Pilot Project webpage - Select "Download Latest Version" to get started (09/25/21)
Collecting the Data
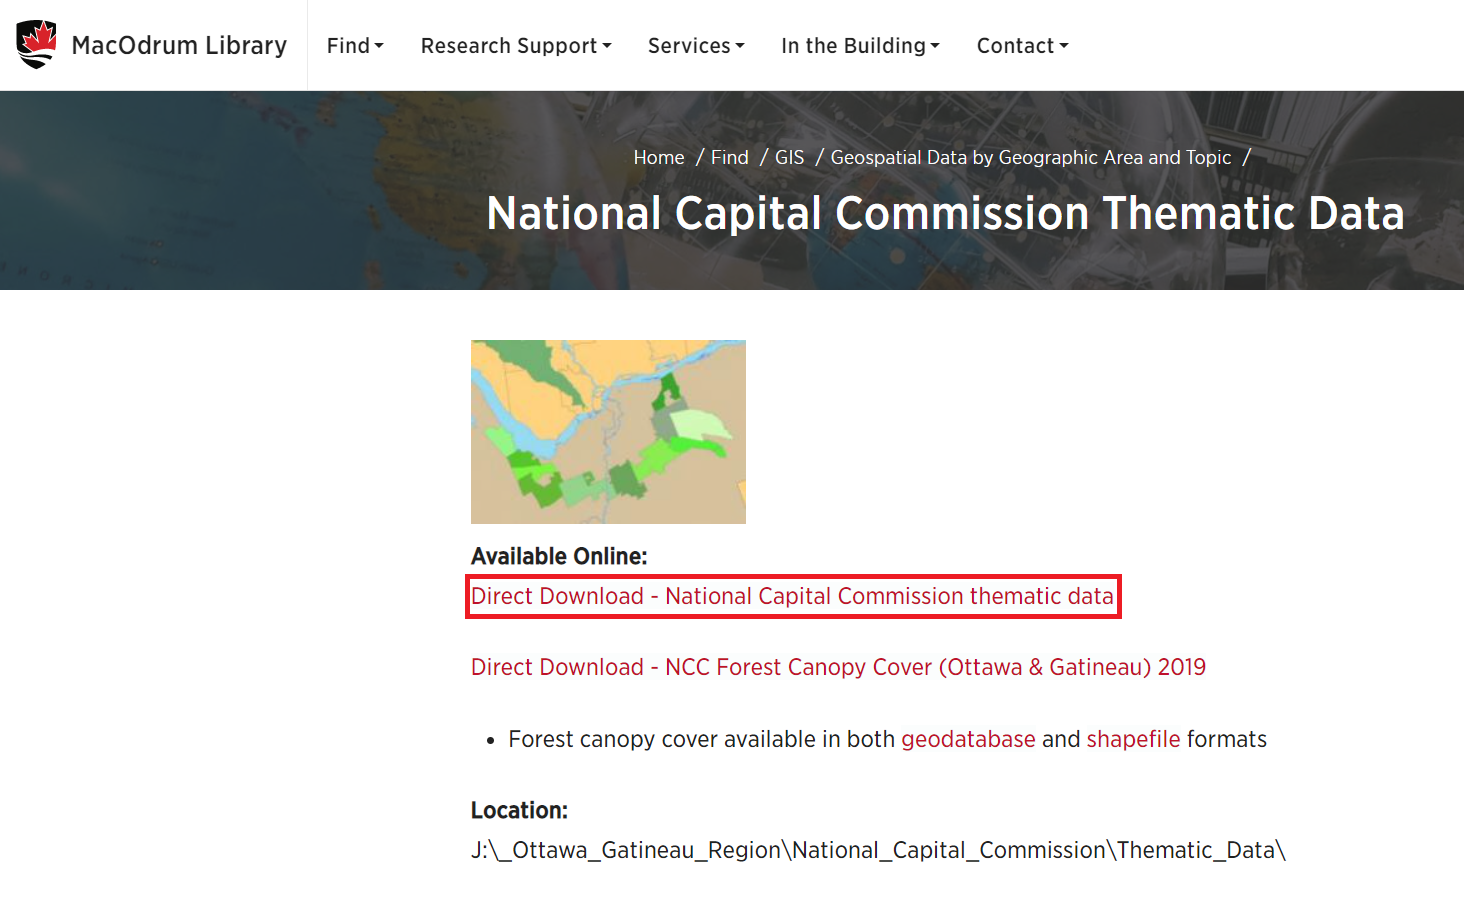
The data used for the purposes of this tutorial is provided by the National Capital Commission (NCC) under the Carleton Unviersity GIS Data Use Agreement. Authorized users including Carleton students, faculty and staff can download the data from the MacOdrum Library HERE.
Figure 2. Screenshot of MacOdrum Library data webpage - Select the text highlighted in red to access the data (09/25/21)
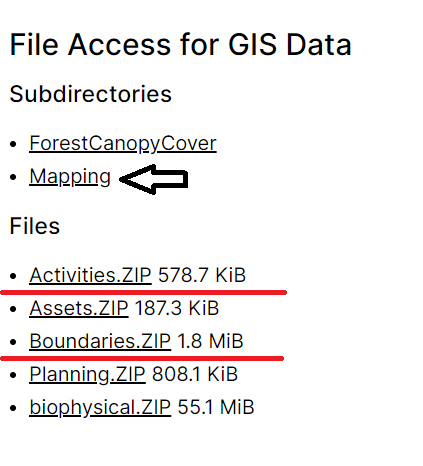
Only a select few of the datasets available are needed for the tutorial. Download the .Zip files from the list below (see also Figure 3) and save them to a designated folder on your computer.
- Activities.ZIP
- Boundaries.ZIP
- CanMap.ZIP (found in "Mapping" folder)
Figure 3. NCC thematic datasets available for download - Select the files beside the arrow and underlined in red to begin downloading (09/25/21)
Importing the Data
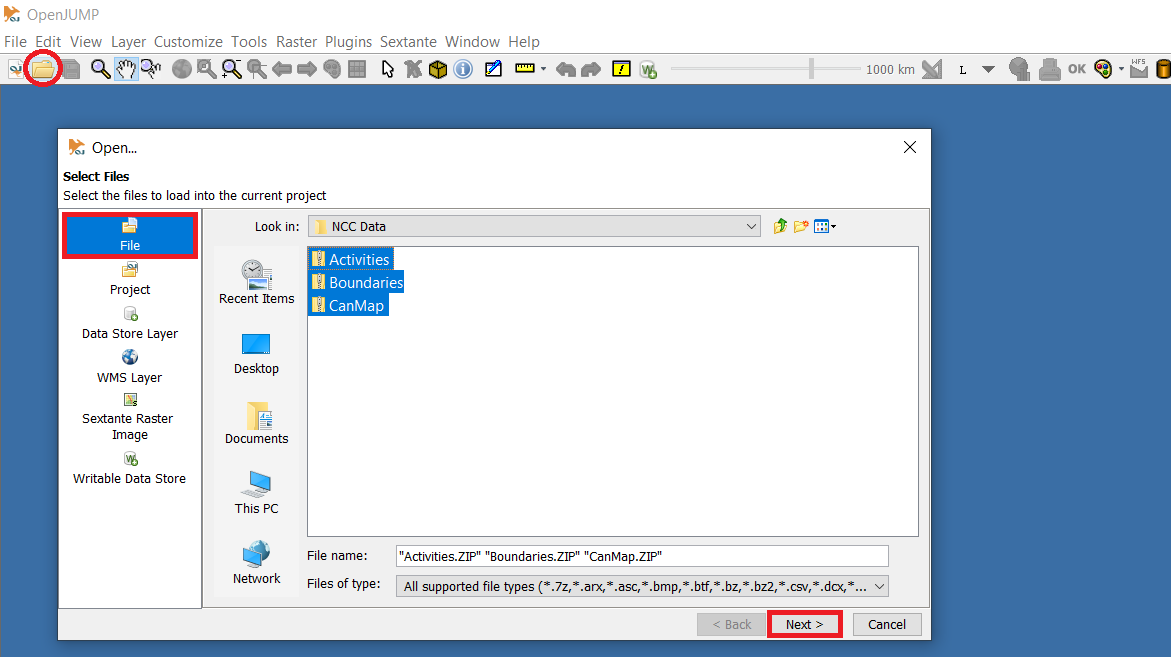
To import the downloaded data, launch OpenJUMP and select the folder icon in the left-hand corner of the toolbar. In the dialog box (Figure 4), browse for the data and select the files (Activities.zip, Boundaries.zip, CanMap.zip) to load them into the project space, then click "Next". When prompted to select the type of file for each file extension, simply click "Finish" to import the data and complete this step.
Figure 4. Blank project in OpenJUMP - Click the folder icon circled in red, select the three .zip files shown and click "Next"
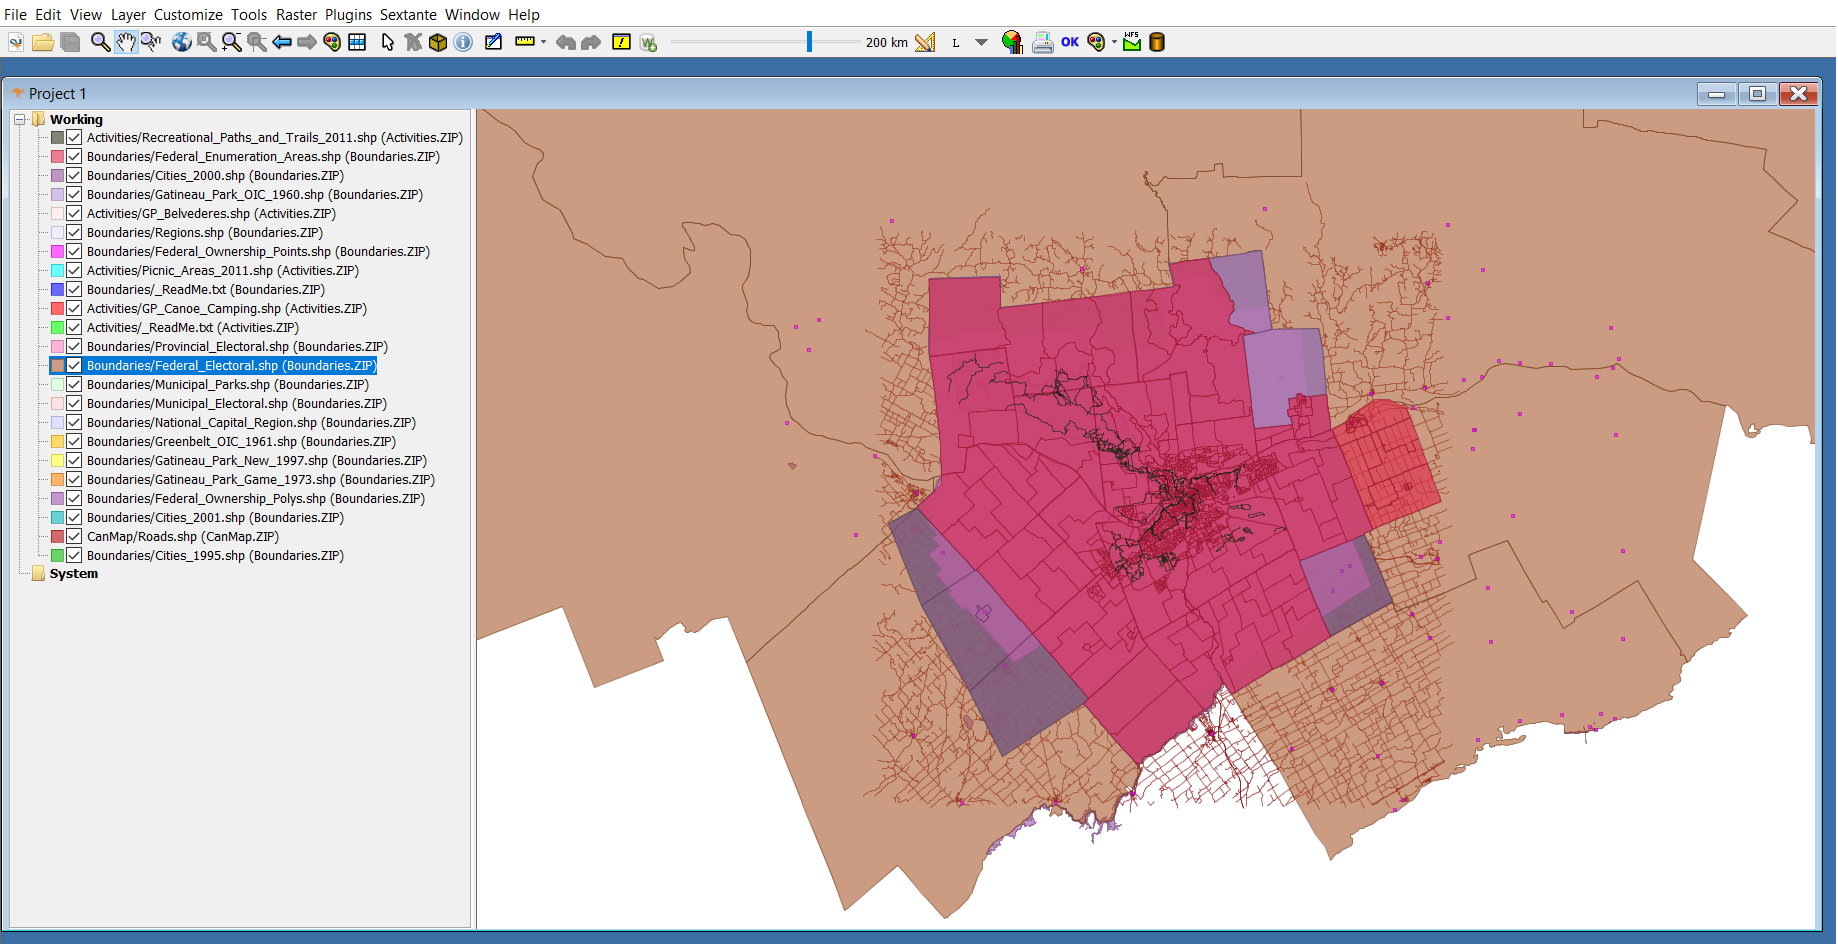
Once the data is loaded into the project, you will need to tidy and organize the feature layers. Start by selecting or 'toggling on' the layers needed for this tutorial from the list below:
Activities:
- Picnic_Areas_2011.shp
- Recreations_Paths_and_Trails_2011.shp
Boundaries:
- Gatineau_Park_New_1997.shp
- Municipal_Parks.shp
- National_Capital_Region.shp
CanMap:
- Roads.shp
Figure 5. Map view in OpenJUMP - Once data is imported, organize the feature layers in the table of contents on the left (Colours may vary)
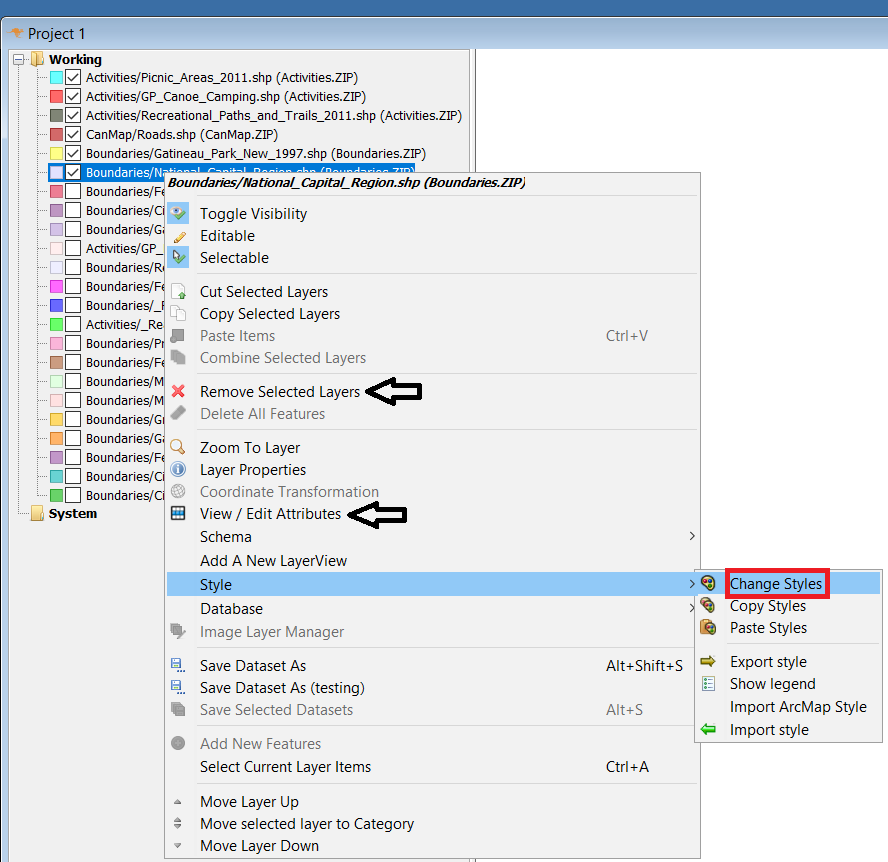
To delete unnecessary layers from the project, right-click on the layer in the table of contents and select "Remove Selected Layers" (Figure 6). Next, determine the layers' drawing order on a map by ordering the list of layers in the table of contents. This can be done by clicking and dragging each layer to the desired position. Layers can also be renamed for easier identification by double-clicking on the layer.
Figure 6. Feature layer pop-up menu - Remove selected layers, view attribute data or open the style dialog by selecting the option highlighted in red
Symbolizing the Data
We will now symbolize the imported feature layers using a variety of symbolization methods available in the software. This section will primarily focus on single symbol, graduated colours, and unique values symbologies. Colour-based symbology options will also be explored to represent specific attributes. This will allow us to combine symbols with map elements to visualize selected geographic features and have the ability to create a range of thematic maps for academic or professional use.
- Single Symbol (Polygons)
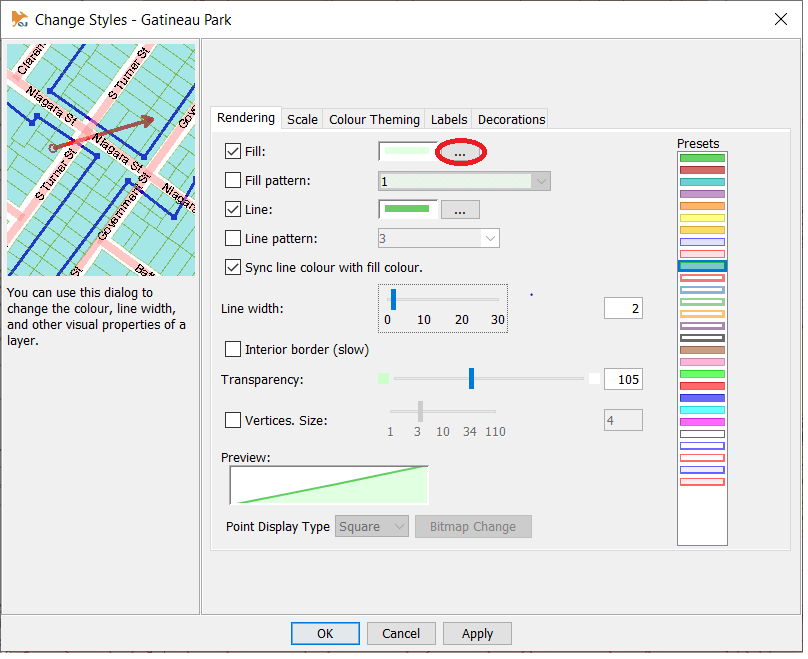
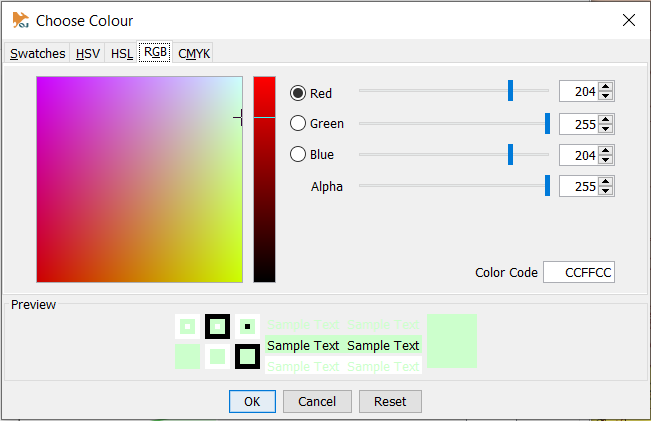
To change the colour of a polygon layer, simply right-click on the layer, find "Style" on the side menu, then select "Change Styles" (Figure 6). A dialog box will appear with a number of tabs that allow you to change the visual properties of a layer. In the "Rendering" tab, you can change the fill, line width and transparency of a polygon layer (Figure 7). OpenJUMP offers a number of presets, or you can customize the colour of a symbol by clicking on the three dots to open the "Change Colour" dialog (Figure 8). A range of colour swatches are available to choose from or you can create a colour scheme using tools such as ColorBrewer [1] and input custom RBG and HEX colour codes. Once finished, select "Apply" then "OK" to close the dialog.
For this example, start by changing the colour of the Gatineau Park boundary layer (see Figure 7). Next, try changing the colour of the boundary layer for the National Capital Region.
Figure 7. Applying single symbol symbology - In the "Rendering" tab, change the fill and line colours from the presets on the right or click on the three dots circled in red for more options. Click "Apply" to save and view your changes
Figure 8. Advanced colour options in OpenJUMP
- Single Symbol (Points)
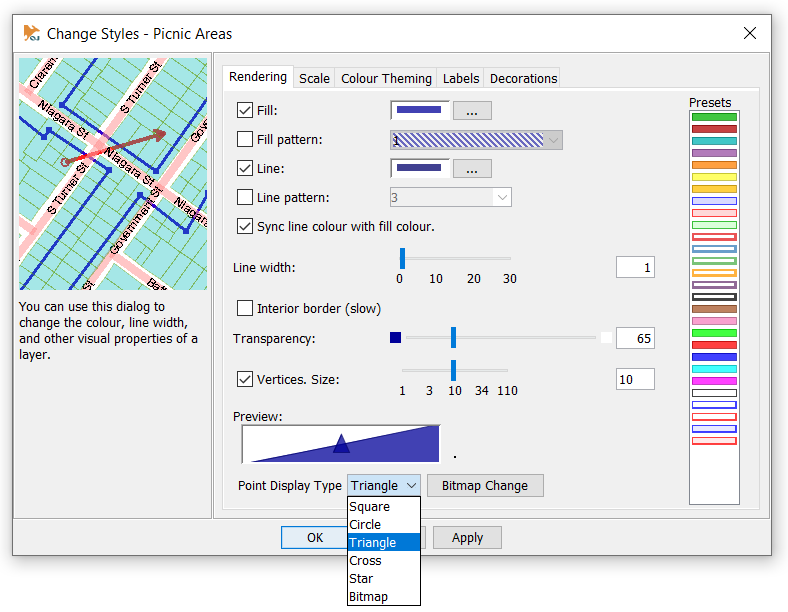
To change the symbol and colour of a point feature layer, open the “Change Styles” dialog box again by right-clicking on the desired layer. In the “Rendering” tab, check the “Vertices Size” box and use the sliding scale or text box to adjust the size of point features (Figure 9). From the “Point Display Type” drop-down menu, you can choose from shapes including square, circle, triangle, cross, star, or Bitmap. This option allows you to select an image to represent the data. The line and fill colours of the symbol can then be changed in the same manner as the above example.
Figure 9. Point feature symbology – In the “Rendering” tab, select the option for “Vertices Size”, adjust the symbol size, and choose the display type/shape
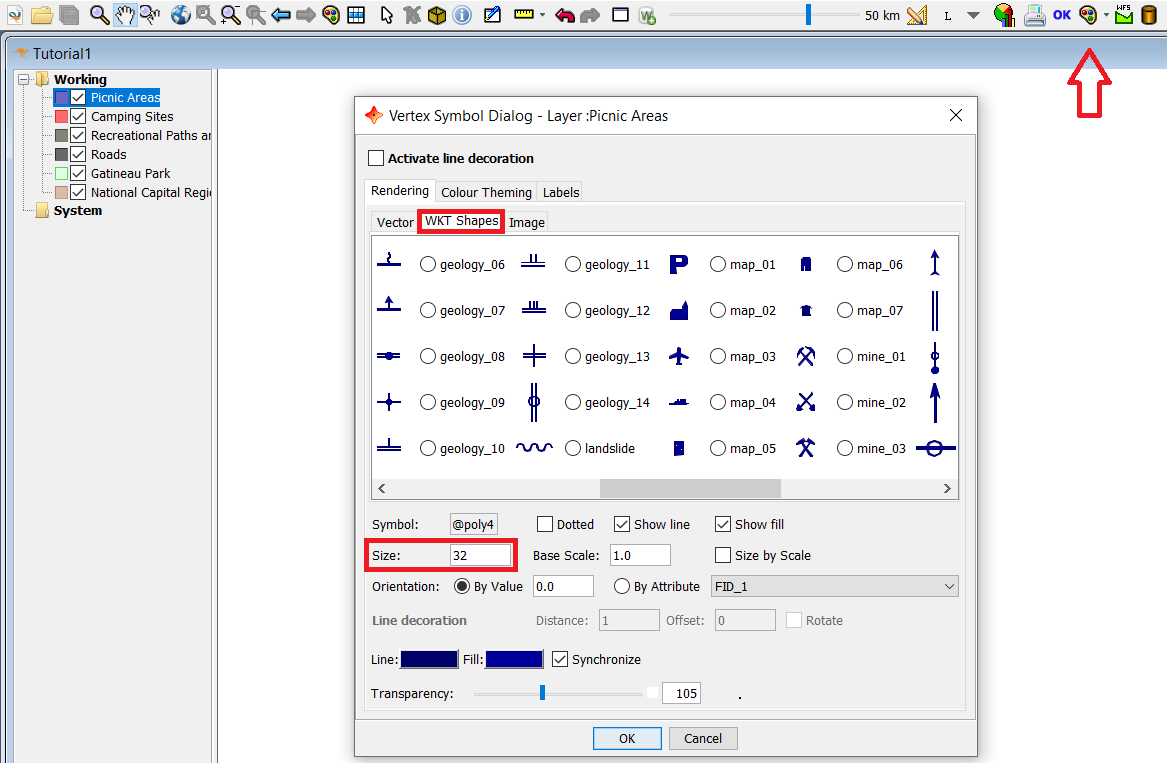
To access more symbol options within the program, use the “VertexSymbolPlugin” tool. This tool can be accessed in the right-hand corner of the toolbar. First, ensure that the desired layer is in editable mode by right-clicking on the layer in the table of contents. Within the “Vertex Symbol Dialog” box (Figure 10), select from the options in the “Vector” and “WKT Shapes” tabs. Enter the size in the text box and click “OK” to apply changes.
Figure 10. Vertex Symbol Plugin – For more point symbol options, open the dialog from the paint icon on the toolbar, choose the desired symbol, and set the size
- Unique Values
To symbolize data based on unique attribute values, a colour theme will be chosen to symbolize each respective value. The number of colours will vary depending on the number of unique values in a given attribute and will allow map viewers to differentiate between different qualitative features.
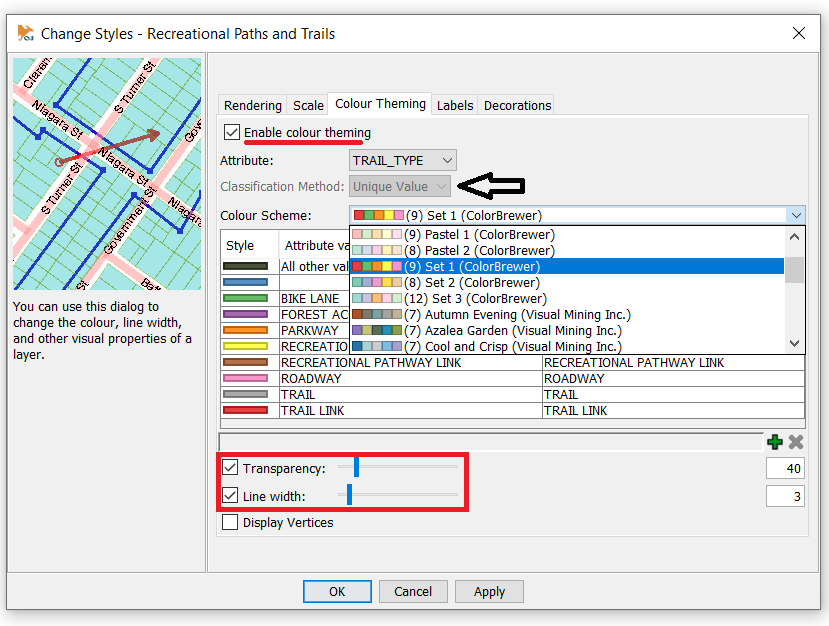
For this tutorial, you will use unique value symbology to visualize the different types of trails within the area of interest. To begin, right-click on the Activities/Recreation_Paths_and_Trails layer and open the “Change Styles” dialog box. Select the “Colour Theming” tab and check the box to enable colour theming (Figure 11). From this step, choose the attribute “TRAIL_TYPE” from the drop-down menu and set the classification method as “Unique Value”. Then, select the colour scheme of your choice from the options in the drop-down menu. There are a number of sequential, diverging, and random colour schemes from Colour Brewer and Visual Mining Inc. The table displays the unique values and the corresponding colour as well as the label (how it will appear on the map legend). You can also use the sliding scales or text boxes to adjust the transparency and line width of the features.
Figure 11. Unique Values Symbology – In the “Colour Theming” tab, enable colour theming, select the attribute ‘TRAIL_TYPE’ and set the classification method as ‘Unique Value’. Choose a colour scheme from the drop-down menu and adjust the transparency and line width highlighted in red
- Graduated Colours
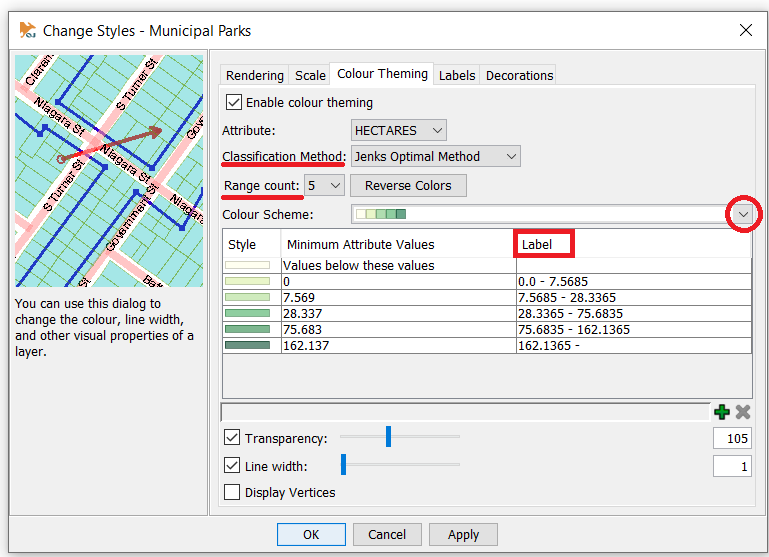
Graduated colour symbology can be used to classify data into ranges based on a given attribute field. The selected classification method and number of classes determine how the data is distributed between the ranges and the number of assigned colours. Using the NCC data, we can symbolize the municipal parks in the area of interest by their size (hectares). First, open the “Change Styles” dialog for the layer and enable colour theming (Figure 12). From the set of drop-down menus, set the attribute as ‘HECTARES’ and select an appropriate classification method and range count. After this step, select a colour scheme from the drop-down menu and edit your labels to the desired number of decimal places.
Classification Methods in OpenJUMP:
- Unique Value
- Equal Interval
- Quantile/Equal Number
- Mean Standard Deviation
- Maximal Breaks
- Jenks Optimal Method
Figure 12. Graduated Colour Symbology – In the “Colour Theming” tab, set the classification and range count underlined in red and choose a colour scheme from the drop-down menu. Edit the appearance of attribute labels on the map legend by double-clicking each label
Labeling
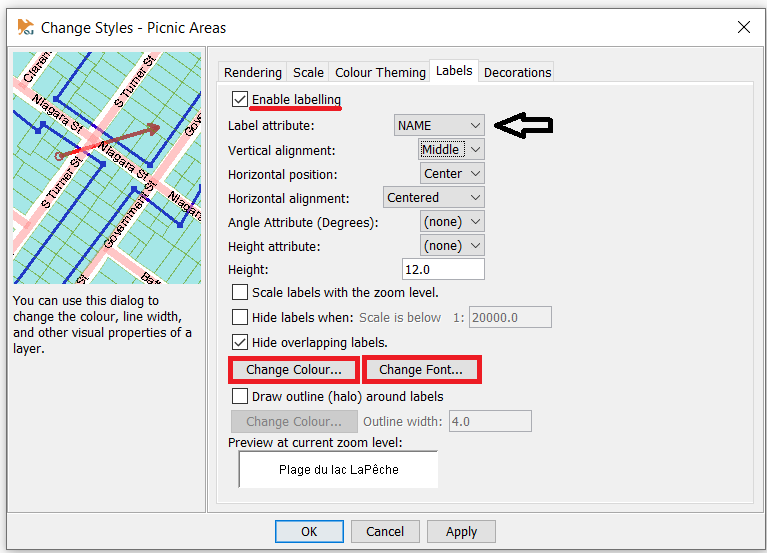
Labels can be used in thematic maps to describe features of an attribute such as names of provinces, parks, and water bodies. To add labels in OpenJUMP, open the “Change Styles” dialog and enable labelling in the “Labels” tab (Figure 13). From this step, select the label attribute field ‘NAME’ and use the drop-down menu to set the position, alignment, and height of the label. You can also change the colour and font of the text.
Figure 13. Adding feature labels – In the “Labels” tab, select the attribute field ‘NAME’ and explore the options for label positioning, alignment and height as well as colours and fonts available
Final Image
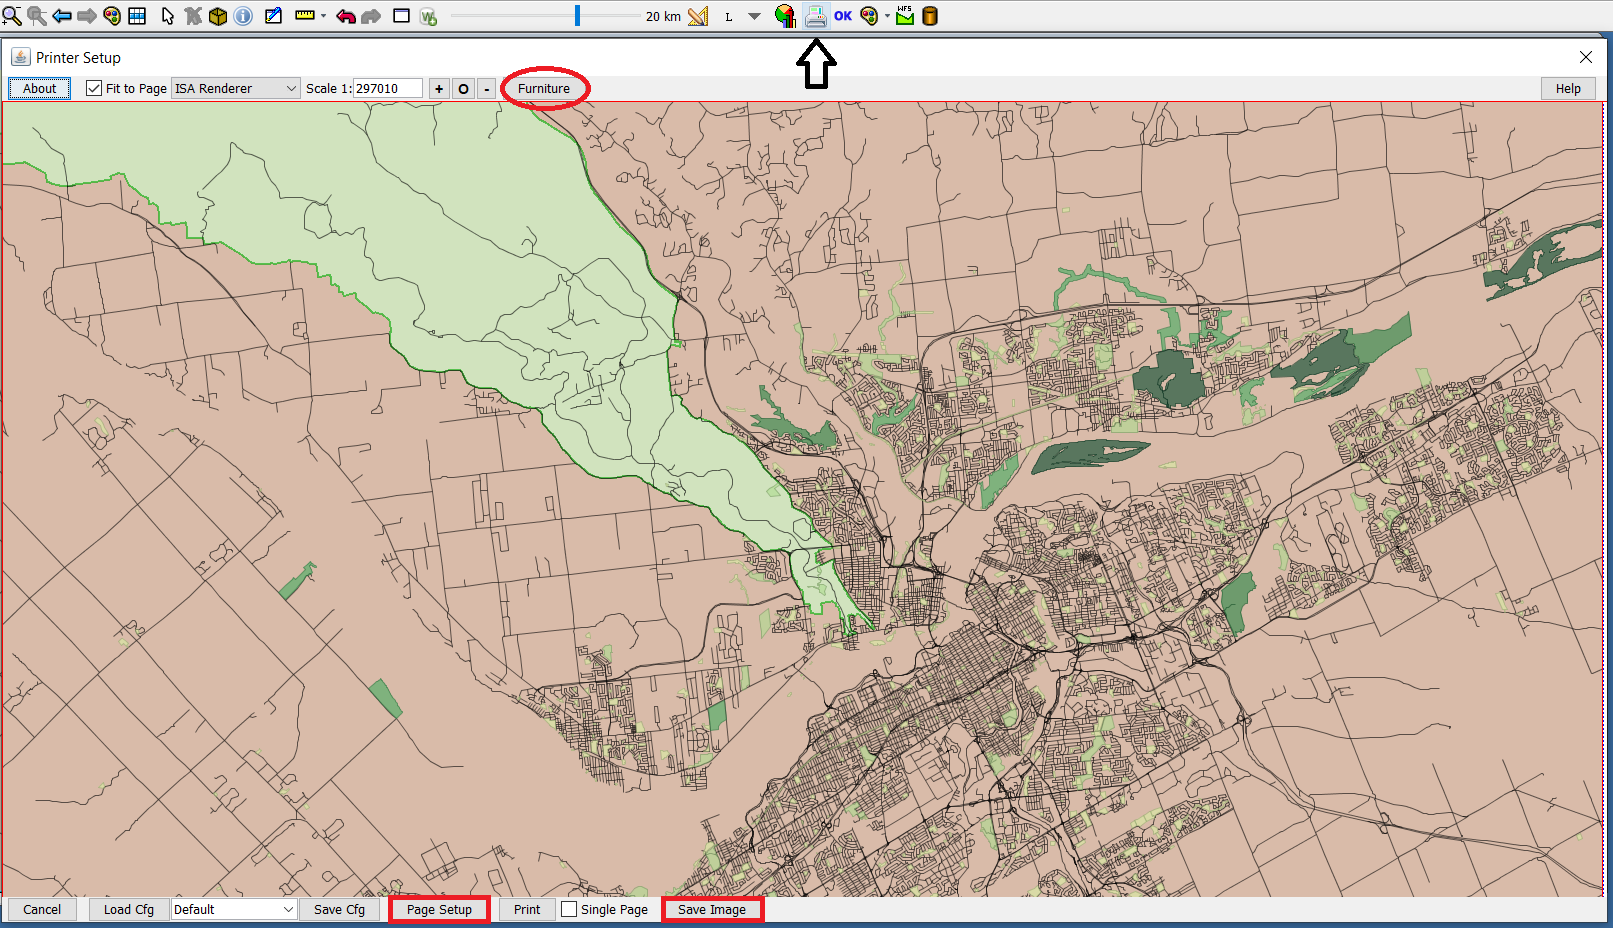
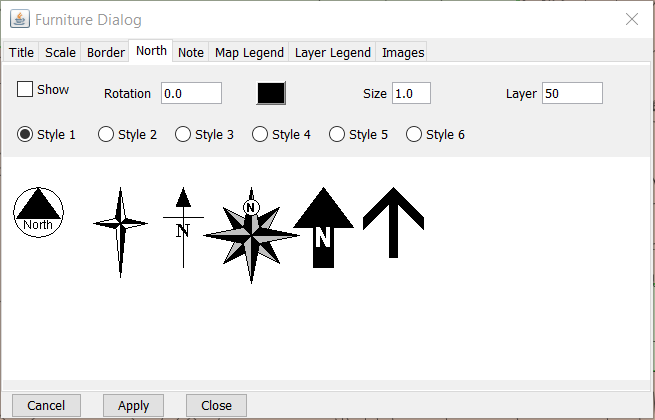
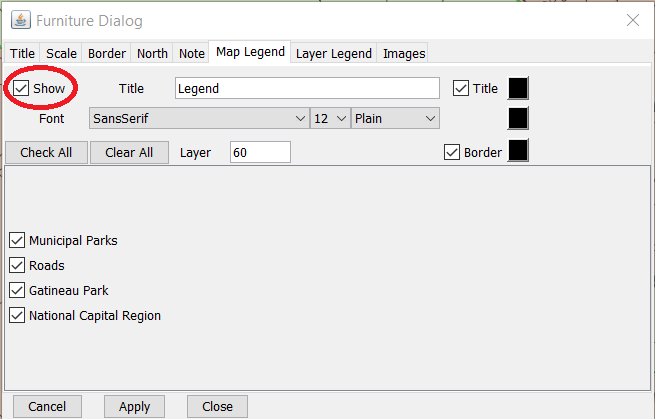
Now that we have discovered some of the basic thematic capabilities of the software, we can explore how to create and export maps in OpenJUMP. In the program’s layout view (Figure 14), we can view our data frame and add cartographic elements including a title, legend, north arrow, and scale. Select the printer icon in the right-hand corner of the toolbar to view your map in layout view/“Printer Setup”. Next, select the “Furniture” button to open a dialog box. Navigate through the different tabs to customize and add cartographic elements to the print view including a title, scale bar, north arrow (Figure 16), and a legend (Figure 17). Before applying changes, ensure that the “Show” box is checked for each element to display it on the final map image.
Figure 14. Printer Setup in OpenJUMP - Select the printer icon on the main toolbar to view, edit, and export your final map. Add map elements by selecting "Furniture" circled in red and change the orientation of the map by selecting "Page Setup" at the bottom of the dialog
Figure 15. Furniture dialog - Add a North Arrow to your map by selecting from the styles available
Figure 16. Furniture dialog - Add a Map Legend to your map by selecting the layers you want to include, creating a title, choosing your type and adding a border (optional) ---
Conclusion
From this tutorial, you have hopefully gained some familiarity with the software OpenJUMP and learned about its thematic capabilities. You will also have successfully symbolized different types of data using a selection of methods and explored how to add cartographic elements to your maps. You are now able to explore more of the capabilities in this program including plugins and use them in future mapping projects.
