Difference between revisions of "Unsupervised Classification using Google Earth Engine"
JulienBelair (talk | contribs) |
JulienBelair (talk | contribs) |
||
| (5 intermediate revisions by the same user not shown) | |||
| Line 1: | Line 1: | ||
==Introduction== |
==Introduction== |
||
| − | [[File:Google Earth Engine Logo.png|thumb|Google Earth Engine]] |
+ | [[File:Google Earth Engine Logo.png|200px|thumb|Google Earth Engine]] |
| + | [[File:2geesignup.png|150px|thumb|right|Google Earth Engine Sign Up Page]] |
||
Google Earth Engine is a cloud-based open source platform for satellite imagery and geospatial data analysis. It allows users to access, visualize, and analyze large-scale datasets of satellite and aerial imagery, providing tools for researching and monitoring the earth's resources and changes over time. With its vast collection of data and powerful analysis tools, Earth Engine enables users to gain insights and make data-driven decisions on a global scale. <br> |
Google Earth Engine is a cloud-based open source platform for satellite imagery and geospatial data analysis. It allows users to access, visualize, and analyze large-scale datasets of satellite and aerial imagery, providing tools for researching and monitoring the earth's resources and changes over time. With its vast collection of data and powerful analysis tools, Earth Engine enables users to gain insights and make data-driven decisions on a global scale. <br> |
||
| Line 6: | Line 7: | ||
Unsupervised classification is a type of machine learning technique that is used to classify data without any pre-existing labels. Unlike supervised classification, which uses labeled data to train the model, unsupervised classification relies on the inherent structure of the data itself to identify patterns and relationships within the data. This allows the model to learn from the data without any human intervention, making it a powerful tool for exploring and analyzing large, complex datasets. Despite its potential, unsupervised classification is not without its challenges, including the need for large amounts of data and the difficulty in interpreting the results of the classification. Overall, unsupervised classification is a valuable tool for uncovering hidden patterns and relationships within data.<br> |
Unsupervised classification is a type of machine learning technique that is used to classify data without any pre-existing labels. Unlike supervised classification, which uses labeled data to train the model, unsupervised classification relies on the inherent structure of the data itself to identify patterns and relationships within the data. This allows the model to learn from the data without any human intervention, making it a powerful tool for exploring and analyzing large, complex datasets. Despite its potential, unsupervised classification is not without its challenges, including the need for large amounts of data and the difficulty in interpreting the results of the classification. Overall, unsupervised classification is a valuable tool for uncovering hidden patterns and relationships within data.<br> |
||
| + | |||
==Setting up a GEE Account== |
==Setting up a GEE Account== |
||
*It is recommended to first create a [https://support.google.com/accounts/answer/27441?hl=en Google account] if you do not have one. |
*It is recommended to first create a [https://support.google.com/accounts/answer/27441?hl=en Google account] if you do not have one. |
||
| + | *Fill this out with your information using this [https://signup.earthengine.google.com/#!/ link ]. |
||
| + | '''Note:'''It usually takes 1-2 days for Google to approve your account. |
||
| + | *After confirming that your account is activated, you can now access the code editor [https://code.earthengine.google.com/ here]. |
||
| + | |||
| + | |||
| + | ==Tutorial== |
||
| + | *You will first need to create a new repository using the big red “NEW” button. This will allow you to save scripts and folders. |
||
| + | *After creating a repository, you can now create a new script file using the same “NEW” button. |
||
| + | *Now that you have a repository and a script, you can start the tutorial. |
||
| + | [[File:Create Repository.png|150px|thumb|left]] |
||
| + | <br><br><br><br><br><br><br><br><br><br><br><br><br> |
||
| + | |||
| + | ===Defining a Study Area=== |
||
| + | Using the “Draw a rectangle tool”, you can select a study area and copy or change the coordinates in the following code. |
||
| + | [[File:Draw a Rectangle Tool.png|thumb|left|Draw a Rectangle Tool in GEE]] |
||
| + | [[File:Rectangle Coordinates.png|thumb|center|Coordinates Gotten through Draw a Rectangle Tool]] |
||
| + | |||
| + | <syntaxhighlight lang="javascript"> |
||
| + | //Define study area |
||
| + | var region = ee.Geometry.Polygon([[-77.8778204291992,48.07440799600473], |
||
| + | [-77.72813170849608,48.07440799600473], |
||
| + | [-77.72813170849608,48.12989193903527], |
||
| + | [-77.8778204291992,48.12989193903527]]);</syntaxhighlight> |
||
| + | '''Note:'''You only need the first four set of coordinates.<br> |
||
| + | You can now delete the "Imports" rectangle.<br> |
||
| + | |||
| + | ===Acquiring an Image=== |
||
| + | To acquire an image to classify, we will first need to import an image collection. |
||
| + | <syntaxhighlight lang="javascript"> |
||
| + | //Get an image collection, Landsat8 in this case |
||
| + | var l8col = ee.ImageCollection('LANDSAT/LC08/C01/T1_SR');</syntaxhighlight> |
||
| + | We will then filter the image collection to get the least cloudy image between a specified timeframe (we usually do between the 1st of June and the 31st of August as this timeframe usually has the less clouds). |
||
| + | <syntaxhighlight lang="javascript"> |
||
| + | //Get a single image |
||
| + | var l8img = l8col.filterBounds(region) //Filters for our study area |
||
| + | .filterDate('2020-06-01', '2020-08-31') //Filters by date |
||
| + | .sort("CLOUD_COVER") //Filters by cloud cover |
||
| + | .first(); //Gets the first image (least cloudy image)</syntaxhighlight> |
||
| + | |||
| + | ===Training Data=== |
||
| + | In order to classify an image, we first need get training data. We can do so by using this code: |
||
| + | <syntaxhighlight lang="javascript"> |
||
| + | //Train data with the Landsat8 Image |
||
| + | var training = l8img.sample({ |
||
| + | region: region, |
||
| + | scale: 30, |
||
| + | numPixels: 5000 |
||
| + | });</syntaxhighlight> |
||
| + | |||
| + | ===K-Means Clustering=== |
||
| + | K-means clustering is an unsupervised learning algorithm that is used to identify groups (or clusters) in a data set. The algorithm works by first identifying a predetermined number of clusters (k) within the data. It then assigns each data point to the nearest cluster, based on the features of the data point. The algorithm then iteratively refines the position of the cluster centroids and the assignments of data points to clusters, until it converges on a solution. This final solution defines the groups (or clusters) within the data set. K-means clustering is a simple and efficient approach for clustering large data sets. The code for K-Means clustering can take in many [https://developers.google.com/earth-engine/apidocs/ee-clusterer-wekakmeans parameters], but we can keep it simple for our use:<br> |
||
| + | |||
| + | <syntaxhighlight lang="javascript"> |
||
| + | //K-Means Clustering |
||
| + | var kmeans = ee.Clusterer.wekaKMeans(5).train(training); |
||
| + | var kmeansresult = l8img.cluster(kmeans);</syntaxhighlight> |
||
| + | |||
| + | ===X-Means Clustering=== |
||
| + | X-means is a type of clustering algorithm that is used to automatically determine the optimal number of clusters to use in a given dataset. It is an extension of the popular k-means algorithm, which simply specifies the number of clusters to use upfront. In contrast, X-means uses a technique called "splitting" to iteratively split clusters in order to find the optimal number of clusters for the data. This can be more efficient and accurate than using k-means with a pre-specified number of clusters. The code for X-Means clustering can take in many [https://developers.google.com/earth-engine/apidocs/ee-clusterer-wekaxmeans parameters], but we can keep it simple for our use: |
||
| + | |||
| + | <syntaxhighlight lang="javascript"> |
||
| + | //X-Means Clustering |
||
| + | var xmeans = ee.Clusterer.wekaXMeans(4, 5).train(training); |
||
| + | var xmeansresult = l8img.cluster(xmeans);</syntaxhighlight> |
||
| + | |||
| + | ===LVQ Clustering=== |
||
| + | While LVQ, or learning vector quantization, is a supervised learning algorithm, it was used to compare the differences between the unsupervised algorithms and a supervised learning algorithm. It uses a training dataset to classify new data points based on their similarity to the labeled examples in the training set. LVQ is a competitive learning algorithm, which means that it trains multiple classifiers and chooses the one that performs the best on the training data. One of the key features of LVQ is that it allows the classifiers to adjust their boundaries to better fit the data, which can improve the accuracy of the model. Overall, LVQ is a useful tool for classification tasks in machine learning, and can be applied to a wide range of applications. LVQ usually uses labeled data to perform classification, but it seems like it still works with unlabeled data. Here is the code that was used: |
||
| + | |||
| + | <syntaxhighlight lang="javascript"> |
||
| + | //LVQ Clustering |
||
| + | var lvq = ee.Clusterer.wekaLVQ(5).train(training); |
||
| + | var lvqresult = l8img.cluster(lvq);</syntaxhighlight> |
||
| + | |||
| + | ===Accuracy Assessment=== |
||
| + | If you want to perform an accuracy assessment, it would be a good idea to obtain verified data for the chosen study area. It would then be possible compare the predicted labels from the algorithm to the true labels in the verified dataset. This can be done using metrics such as overall accuracy, kappa coefficient, or F1 score. You can then use these metrics to compare the performance of the different algorithms and see which one performs best.<br> |
||
| + | |||
| + | ===Clip Images to our Study Area=== |
||
| + | In order to better view all the images together, we will clip them so they are as big as our study area with this code: |
||
| + | <syntaxhighlight lang="javascript"> |
||
| + | //Clip Classification to Region |
||
| + | var l8imgclip = l8img.clip(region); |
||
| + | var kmeansresultclip = kmeansresult.clip(region); |
||
| + | var xmeansresultclip = xmeansresult.clip(region); |
||
| + | var lvqresultclip = lvqresult.clip(region);</syntaxhighlight> |
||
| + | |||
| + | ===Create Colour Palettes for the Images=== |
||
| + | Since we used five classes for all the clustering algorithms, we have to choose five colours for the palette. It was done like this: |
||
| + | <syntaxhighlight lang="javascript"> |
||
| + | //Give a colour palette to the classified images |
||
| + | var palette = ['gray', 'purple', 'green', 'black', 'pink']; |
||
| + | var cluster_vis = { |
||
| + | 'min': 0, |
||
| + | 'max': 4, |
||
| + | 'palette': palette}; |
||
| + | |||
| + | //X-Means classification works differently than the other two, so these vizualization |
||
| + | // parameters will make it the same |
||
| + | var palette2 = ['gray', 'green', 'black', 'purple', 'pink']; |
||
| + | var cluster_vis2 = { |
||
| + | 'min': 0, |
||
| + | 'max': 4, |
||
| + | 'palette': palette2};</syntaxhighlight> |
||
| + | |||
| + | Here are the Landsat 8 Visualization Parameters: |
||
| + | <syntaxhighlight lang="javascript"> |
||
| + | //Landsat8 Visualization Parameters |
||
| + | var visparams = { |
||
| + | 'bands': ['B4', 'B3', 'B2'], |
||
| + | 'min': 0, |
||
| + | 'max': 3000, |
||
| + | 'gamma': 1.4, |
||
| + | };</syntaxhighlight> |
||
| + | |||
| + | ===Visualize Images=== |
||
| + | We can now add all of our images on the map portion of the Google Earth Engine code editor: |
||
| + | <syntaxhighlight lang="javascript"> |
||
| + | //Add Landsat8 Image and Classified Image onto the map |
||
| + | Map.centerObject(region); |
||
| + | Map.addLayer(region, {}, 'region'); |
||
| + | Map.addLayer(l8imgclip, visparams, 'img'); |
||
| + | Map.addLayer(lvqresultclip, cluster_vis, 'lvq'); |
||
| + | Map.addLayer(xmeansresultclip, cluster_vis2, 'xmeans'); |
||
| + | Map.addLayer(kmeansresultclip, cluster_vis, 'kmeans');</syntaxhighlight> |
||
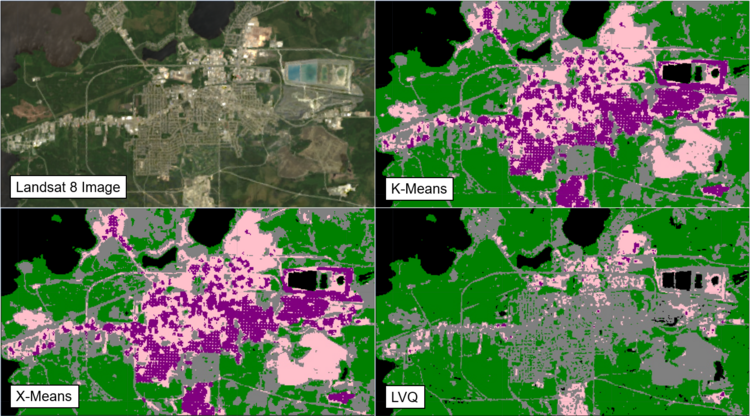
| + | [[File:ClassificationResults.png|750px|thumb|center|Unsupervised Classification Results + LVQ]] |
||
| + | |||
| + | ===Export an Image=== |
||
| + | If you want to export an image in order to use it in another software, here is how you do it: |
||
| + | <syntaxhighlight lang="javascript"> |
||
| + | //Export Image |
||
| + | var image = l8imgclip.toInt16() //Cast to Int16 so all the bands are the same type |
||
| + | var projection = image.select('B2').projection().getInfo(); //Gets the projection information |
||
| + | Export.image.toDrive({ |
||
| + | image: kmeansresultclip, //Change name depending on the image you want to export |
||
| + | description: 'KMeans', |
||
| + | crs: projection.crs, |
||
| + | crsTransform: projection.transform, |
||
| + | region: region |
||
| + | });</syntaxhighlight> |
||
| + | |||
| + | ==Conclusion== |
||
| + | With this tutorial, you should be able to perform unsupervised classification with your own study area. As it is simpler to use than supervised classification, unsupervised classification can be a good starting point in getting to know an area visually. Further analysis can be performed using the classification results if you open them in another software such as QGIS, and it might be interesting to use reference data before performing unsupervised classification as a way to get an accuracy assessment later on. Overall, Google Earth Engine is a very powerful tool that can perform many geospatial tasks and is there to stay as a go to open source software tool for geospatial analysis. |
||
Latest revision as of 20:03, 21 December 2022
Introduction
Google Earth Engine is a cloud-based open source platform for satellite imagery and geospatial data analysis. It allows users to access, visualize, and analyze large-scale datasets of satellite and aerial imagery, providing tools for researching and monitoring the earth's resources and changes over time. With its vast collection of data and powerful analysis tools, Earth Engine enables users to gain insights and make data-driven decisions on a global scale.
One of the key features of Google Earth Engine is its code editor, which allows users to write, execute, and share scripts for processing and analyzing geospatial data. The code editor includes a range of pre-defined functions and libraries for working with Earth Engine data, as well as a built-in code editor and debugger for writing and testing custom code. With the code editor, users can easily access and manipulate large datasets, perform complex analyses, and create customized visualizations of their data. The code editor also enables users to share their scripts and collaborate with others on their work, making it an essential tool for researchers and analysts working with geospatial data.
Unsupervised classification is a type of machine learning technique that is used to classify data without any pre-existing labels. Unlike supervised classification, which uses labeled data to train the model, unsupervised classification relies on the inherent structure of the data itself to identify patterns and relationships within the data. This allows the model to learn from the data without any human intervention, making it a powerful tool for exploring and analyzing large, complex datasets. Despite its potential, unsupervised classification is not without its challenges, including the need for large amounts of data and the difficulty in interpreting the results of the classification. Overall, unsupervised classification is a valuable tool for uncovering hidden patterns and relationships within data.
Setting up a GEE Account
- It is recommended to first create a Google account if you do not have one.
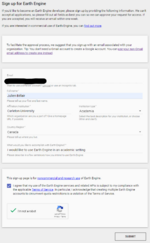
- Fill this out with your information using this link .
Note:It usually takes 1-2 days for Google to approve your account.
- After confirming that your account is activated, you can now access the code editor here.
Tutorial
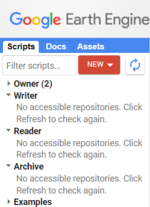
- You will first need to create a new repository using the big red “NEW” button. This will allow you to save scripts and folders.
- After creating a repository, you can now create a new script file using the same “NEW” button.
- Now that you have a repository and a script, you can start the tutorial.
Defining a Study Area
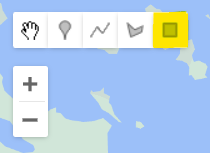
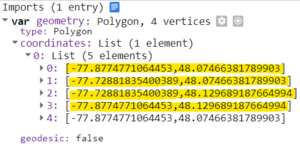
Using the “Draw a rectangle tool”, you can select a study area and copy or change the coordinates in the following code.
//Define study area
var region = ee.Geometry.Polygon([[-77.8778204291992,48.07440799600473],
          [-77.72813170849608,48.07440799600473],
          [-77.72813170849608,48.12989193903527],
          [-77.8778204291992,48.12989193903527]]);
Note:You only need the first four set of coordinates.
You can now delete the "Imports" rectangle.
Acquiring an Image
To acquire an image to classify, we will first need to import an image collection.
//Get an image collection, Landsat8 in this case
var l8col = ee.ImageCollection('LANDSAT/LC08/C01/T1_SR');
We will then filter the image collection to get the least cloudy image between a specified timeframe (we usually do between the 1st of June and the 31st of August as this timeframe usually has the less clouds).
//Get a single image
var l8img = l8col.filterBounds(region) //Filters for our study area
          .filterDate('2020-06-01', '2020-08-31') //Filters by date
          .sort("CLOUD_COVER") //Filters by cloud cover
          .first(); //Gets the first image (least cloudy image)
Training Data
In order to classify an image, we first need get training data. We can do so by using this code:
//Train data with the Landsat8 Image
var training = l8img.sample({
  region: region,
  scale: 30,
  numPixels: 5000
});
K-Means Clustering
K-means clustering is an unsupervised learning algorithm that is used to identify groups (or clusters) in a data set. The algorithm works by first identifying a predetermined number of clusters (k) within the data. It then assigns each data point to the nearest cluster, based on the features of the data point. The algorithm then iteratively refines the position of the cluster centroids and the assignments of data points to clusters, until it converges on a solution. This final solution defines the groups (or clusters) within the data set. K-means clustering is a simple and efficient approach for clustering large data sets. The code for K-Means clustering can take in many parameters, but we can keep it simple for our use:
//K-Means Clustering
var kmeans = ee.Clusterer.wekaKMeans(5).train(training);
var kmeansresult = l8img.cluster(kmeans);
X-Means Clustering
X-means is a type of clustering algorithm that is used to automatically determine the optimal number of clusters to use in a given dataset. It is an extension of the popular k-means algorithm, which simply specifies the number of clusters to use upfront. In contrast, X-means uses a technique called "splitting" to iteratively split clusters in order to find the optimal number of clusters for the data. This can be more efficient and accurate than using k-means with a pre-specified number of clusters. The code for X-Means clustering can take in many parameters, but we can keep it simple for our use:
//X-Means Clustering
var xmeans = ee.Clusterer.wekaXMeans(4, 5).train(training);
var xmeansresult = l8img.cluster(xmeans);
LVQ Clustering
While LVQ, or learning vector quantization, is a supervised learning algorithm, it was used to compare the differences between the unsupervised algorithms and a supervised learning algorithm. It uses a training dataset to classify new data points based on their similarity to the labeled examples in the training set. LVQ is a competitive learning algorithm, which means that it trains multiple classifiers and chooses the one that performs the best on the training data. One of the key features of LVQ is that it allows the classifiers to adjust their boundaries to better fit the data, which can improve the accuracy of the model. Overall, LVQ is a useful tool for classification tasks in machine learning, and can be applied to a wide range of applications. LVQ usually uses labeled data to perform classification, but it seems like it still works with unlabeled data. Here is the code that was used:
//LVQ Clustering
var lvq = ee.Clusterer.wekaLVQ(5).train(training);
var lvqresult = l8img.cluster(lvq);
Accuracy Assessment
If you want to perform an accuracy assessment, it would be a good idea to obtain verified data for the chosen study area. It would then be possible compare the predicted labels from the algorithm to the true labels in the verified dataset. This can be done using metrics such as overall accuracy, kappa coefficient, or F1 score. You can then use these metrics to compare the performance of the different algorithms and see which one performs best.
Clip Images to our Study Area
In order to better view all the images together, we will clip them so they are as big as our study area with this code:
//Clip Classification to Region
var l8imgclip = l8img.clip(region);
var kmeansresultclip = kmeansresult.clip(region);
var xmeansresultclip = xmeansresult.clip(region);
var lvqresultclip = lvqresult.clip(region);
Create Colour Palettes for the Images
Since we used five classes for all the clustering algorithms, we have to choose five colours for the palette. It was done like this:
//Give a colour palette to the classified images
var palette = ['gray', 'purple', 'green', 'black', 'pink'];
var cluster_vis = {
  'min': 0,
  'max': 4,
  'palette': palette};

//X-Means classification works differently than the other two, so these vizualization
// parameters will make it the same
var palette2 = ['gray', 'green', 'black', 'purple', 'pink'];
var cluster_vis2 = {
  'min': 0,
  'max': 4,
  'palette': palette2};
Here are the Landsat 8 Visualization Parameters:
//Landsat8 Visualization Parameters
var visparams = {
  'bands': ['B4', 'B3', 'B2'],
  'min': 0,
  'max': 3000,
  'gamma': 1.4,
};
Visualize Images
We can now add all of our images on the map portion of the Google Earth Engine code editor:
//Add Landsat8 Image and Classified Image onto the map
Map.centerObject(region);
Map.addLayer(region, {}, 'region');
Map.addLayer(l8imgclip, visparams, 'img');
Map.addLayer(lvqresultclip, cluster_vis, 'lvq');
Map.addLayer(xmeansresultclip, cluster_vis2, 'xmeans');
Map.addLayer(kmeansresultclip, cluster_vis, 'kmeans');
Export an Image
If you want to export an image in order to use it in another software, here is how you do it:
//Export Image
var image = l8imgclip.toInt16() //Cast to Int16 so all the bands are the same type
var projection = image.select('B2').projection().getInfo(); //Gets the projection information
Export.image.toDrive({
  image: kmeansresultclip, //Change name depending on the image you want to export
  description: 'KMeans',
  crs: projection.crs,
  crsTransform: projection.transform,
  region: region
});
Conclusion
With this tutorial, you should be able to perform unsupervised classification with your own study area. As it is simpler to use than supervised classification, unsupervised classification can be a good starting point in getting to know an area visually. Further analysis can be performed using the classification results if you open them in another software such as QGIS, and it might be interesting to use reference data before performing unsupervised classification as a way to get an accuracy assessment later on. Overall, Google Earth Engine is a very powerful tool that can perform many geospatial tasks and is there to stay as a go to open source software tool for geospatial analysis.
