Difference between revisions of "Visualizing Multi-Temporal Data with Temporal Controller"
m (testing image) |
m (Images Size change) |
||
| (14 intermediate revisions by the same user not shown) | |||
| Line 1: | Line 1: | ||
==Introduction== |
==Introduction== |
||
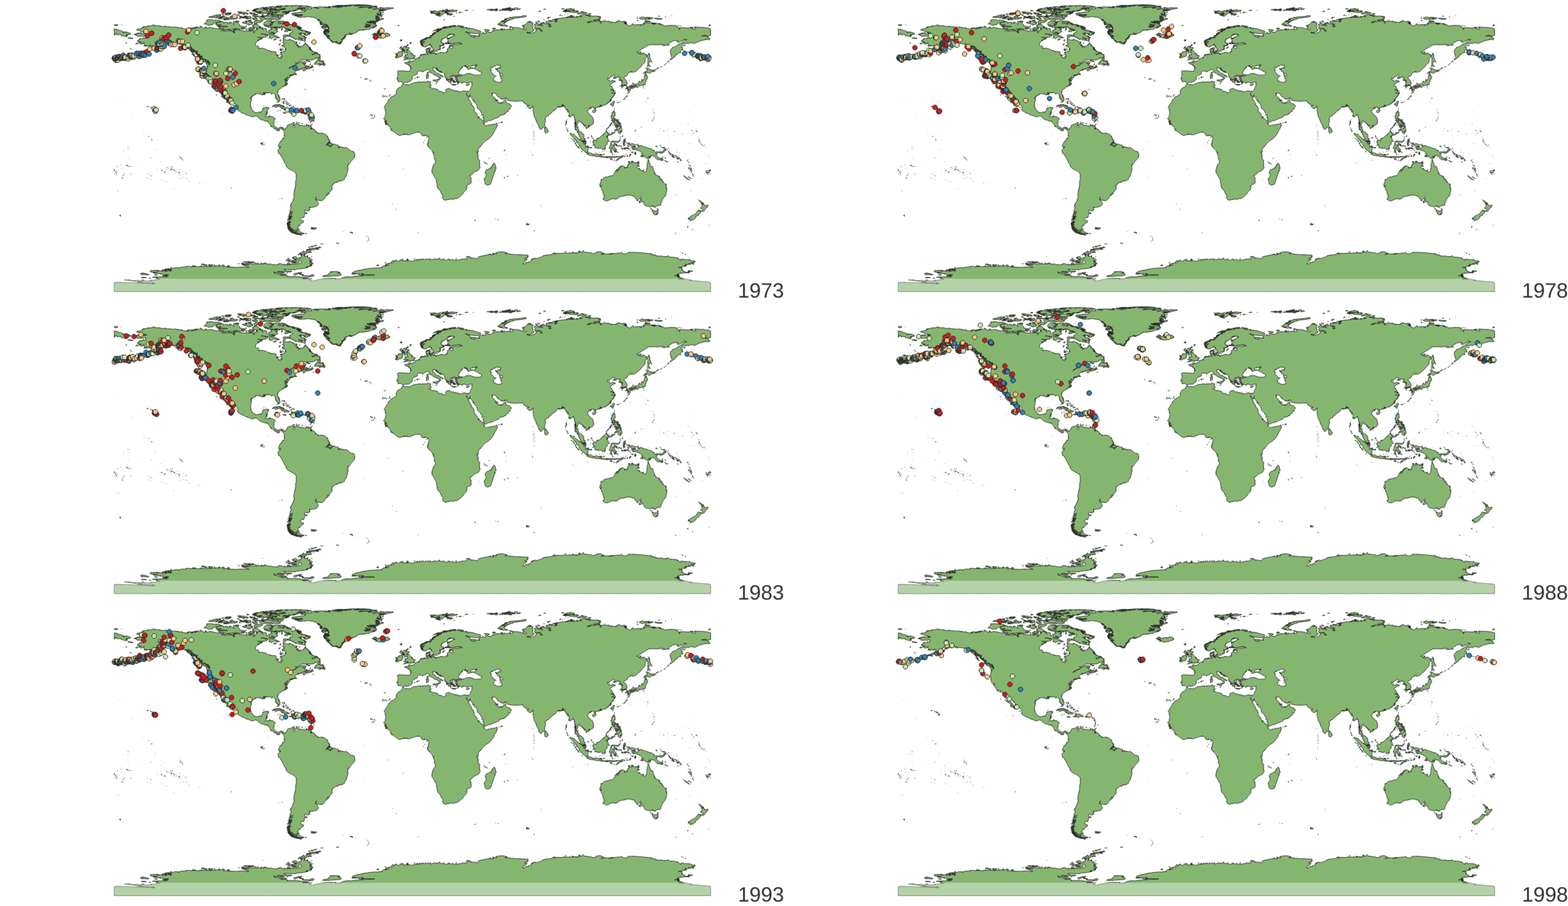
| + | This is a short tutorial on how to operate the Temporal Controller tool in QGIS for the sake of visualizing multi-temporal data. You will learn how to use the Temporal Controller by going through this tutorial on using the tool through a short exercise. In this exercise you will be visualizing the magnitude of Earthquakes in and around the USA to show each year from 1973 to 1998. You will learn of the different types of selections that you can make with the Temporal Controller and how to adjust your time series animation. At the end you will be able to export your time series images and can create a GIF animation for your presentation. |
||
| − | In a distant universe, 500 milliseconds ago, you embarked on a mission of temporal exploration and spatial pattern analysis. Your task is to map and visualize the occurrences of emergencies in the City of Seattle within your selected timeframe from the year 2020. You will learn to use Time Manager, a plugin for QGIS, so you may conduct spatial analysis at any point in time. Your analyses will be an option of the following: weekly, bi-weekly, or monthly emergency calls. The analyses you will conduct are |
||
| Line 7: | Line 7: | ||
Temporal Controller is a built in plugin of QGIS that allows for surfing through temporal geospatial data. It allows for temporal visualization of layers in QGIS. The Temporal Controller was incorporated into QGIS from version 3.14 onward. If you have an older version of QGIS refer to [[Visualizing Multi-Temporal Data with Time Manager]] for it's plugin tutorial. |
Temporal Controller is a built in plugin of QGIS that allows for surfing through temporal geospatial data. It allows for temporal visualization of layers in QGIS. The Temporal Controller was incorporated into QGIS from version 3.14 onward. If you have an older version of QGIS refer to [[Visualizing Multi-Temporal Data with Time Manager]] for it's plugin tutorial. |
||
| − | |||
| − | ===Introduction to Earth Quakes in the US from 1973 to 1997=== |
||
| − | |||
| Line 16: | Line 13: | ||
<br/> |
<br/> |
||
*[https://qgis.org/en/site/forusers/download.html QGIS (3.32 was the latest stable release when this document was last updated)] |
*[https://qgis.org/en/site/forusers/download.html QGIS (3.32 was the latest stable release when this document was last updated)] |
||
| + | |||
==Getting the data== |
==Getting the data== |
||
===Getting Earthquake and Landmass data=== |
===Getting Earthquake and Landmass data=== |
||
| − | * |
+ | * Press this link [https://www.qgistutorials.com/downloads/ne_10m_land.zip] to download a zip containing continental landmass shapefile and [https://freegistutorial.com/download-u-s-earthquake-point-shapefiles/#google_vignette] that will bring you to a website with the USA Earthquake data. |
| − | * |
+ | * Once downloaded and save and un-zip the files in an appropriate location on your computer |
| Line 27: | Line 25: | ||
* Once you have imported the two shapefiles into your QGIS project you need to make sure that your shapefile has the proper reference Field within it's attribute table. |
* Once you have imported the two shapefiles into your QGIS project you need to make sure that your shapefile has the proper reference Field within it's attribute table. |
||
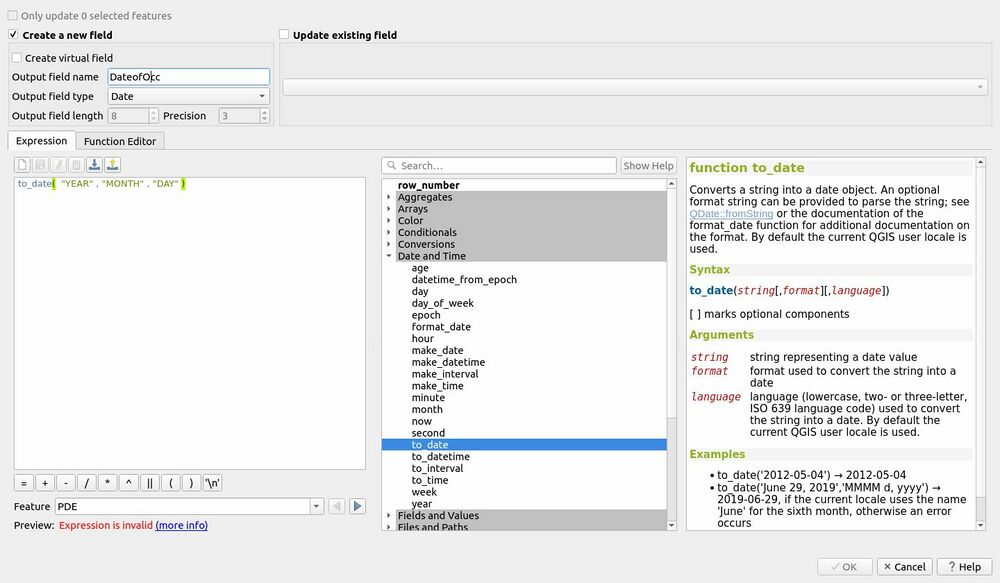
* You need a "Date" type field with whatever time unit you are going to be using. For this tutorial you must create a new field called "Dateofocc" and use the "to_date" expression to fill in the Field |
* You need a "Date" type field with whatever time unit you are going to be using. For this tutorial you must create a new field called "Dateofocc" and use the "to_date" expression to fill in the Field |
||
| − | [[File:Field Calculator.jpg| |
+ | [[File:Field Calculator.jpg|1000px]] |
| + | <br/> |
||
| − | * |
||
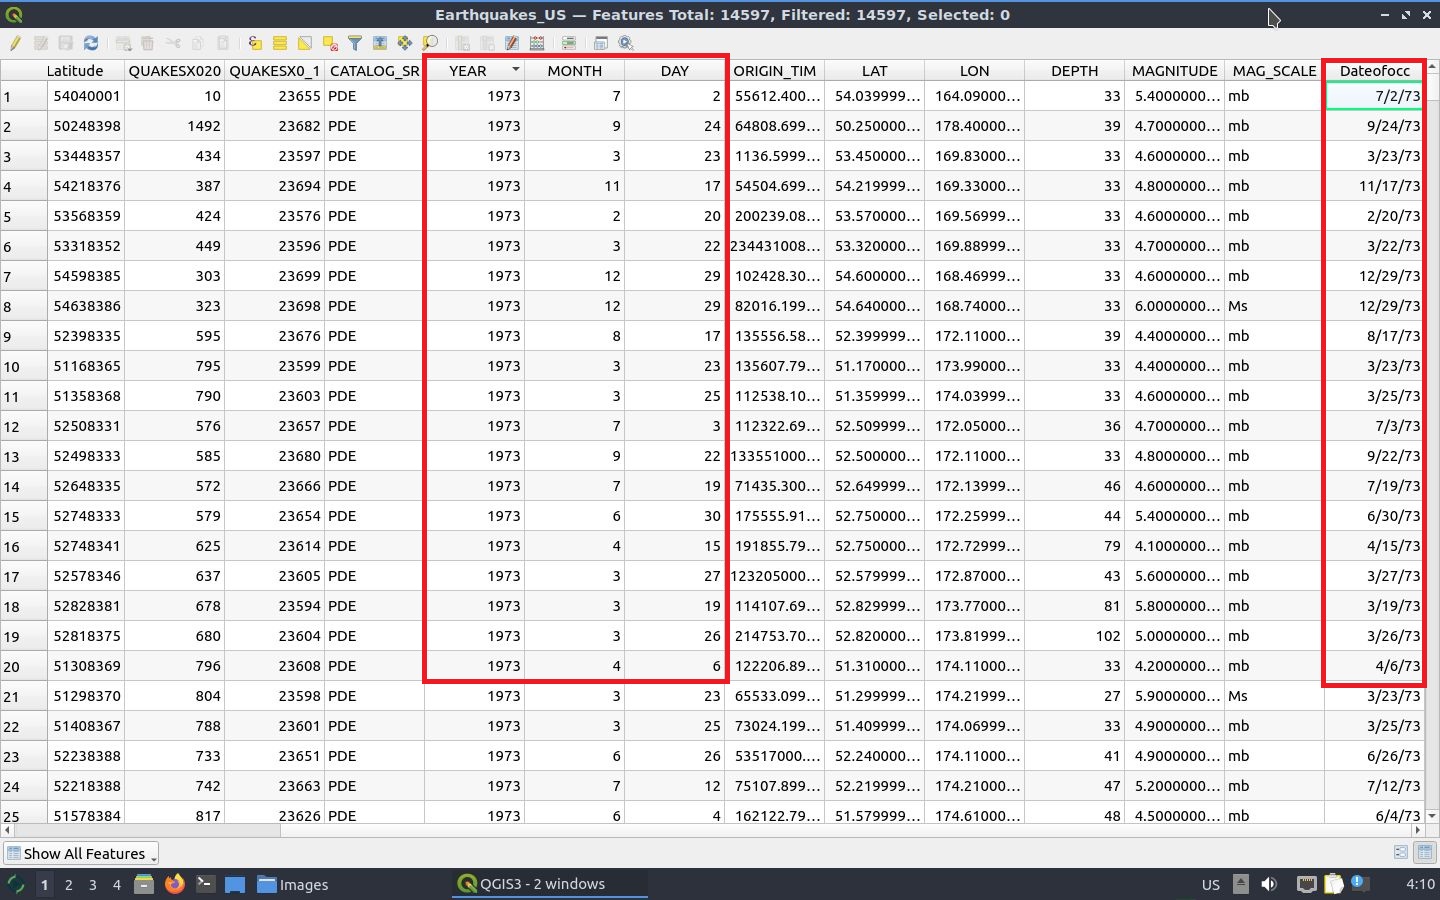
| + | * You should End up with an Attribute Table that looks like this. |
||
| − | * |
||
| + | [[File:Attribute File.jpg]] |
||
| + | * For the purpose of this exercise you can change the symbology to anything you would like as long as you can see a difference in the magnitudes of the earthquakes. |
||
| + | |||
| − | ===Importing a Single Dataset to Time Manager=== |
||
| + | |||
| + | ===Activating Temporal Controller=== |
||
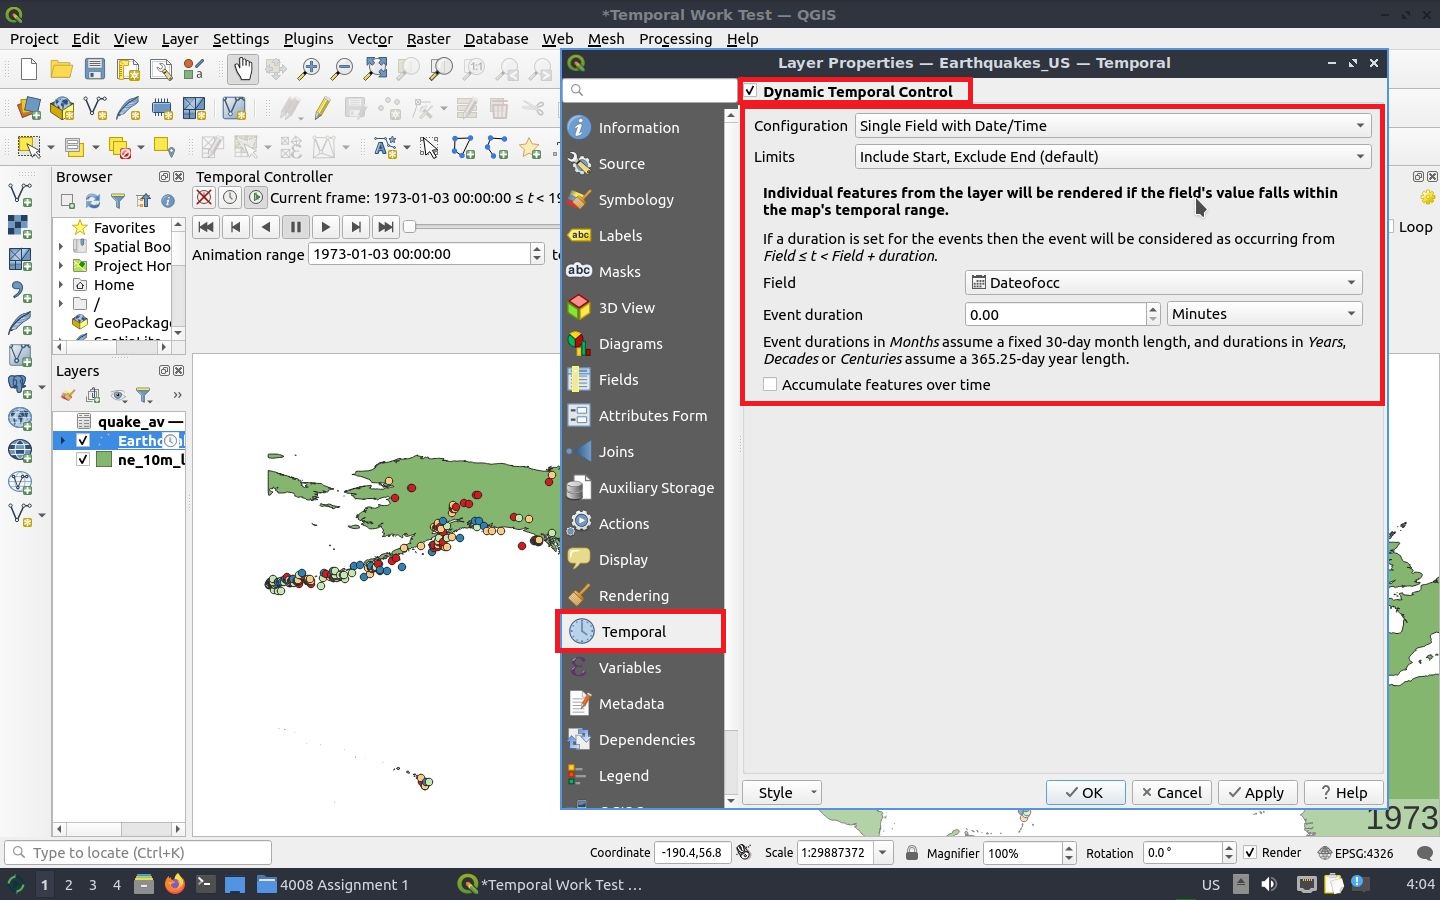
* Follow the following steps look at the image for reference |
* Follow the following steps look at the image for reference |
||
| + | * 1: Enter the Earthquake Layer Properties |
||
| − | * 1: Press Plugin and ensure that visibility is enabled for the Time Manager plugin |
||
| − | * 2: |
+ | * 2: Proceed to the Temporal tab on the left had side |
| − | * 3: |
+ | * 3: Check the box beside the Dynamic Temporal Control |
| + | [[File:Temporal Properties.jpg]] |
||
| − | * 4: Make sure the layer is "2020 Emergency Calls Seattle" and the start time is set to "date_datet" and press "Ok" to finish |
||
| + | * 4: For the purpose of this exercise we will be using the Configuration: Single Field with Date/Time. |
||
| − | *[[File:How to get time Manager.png]] |
||
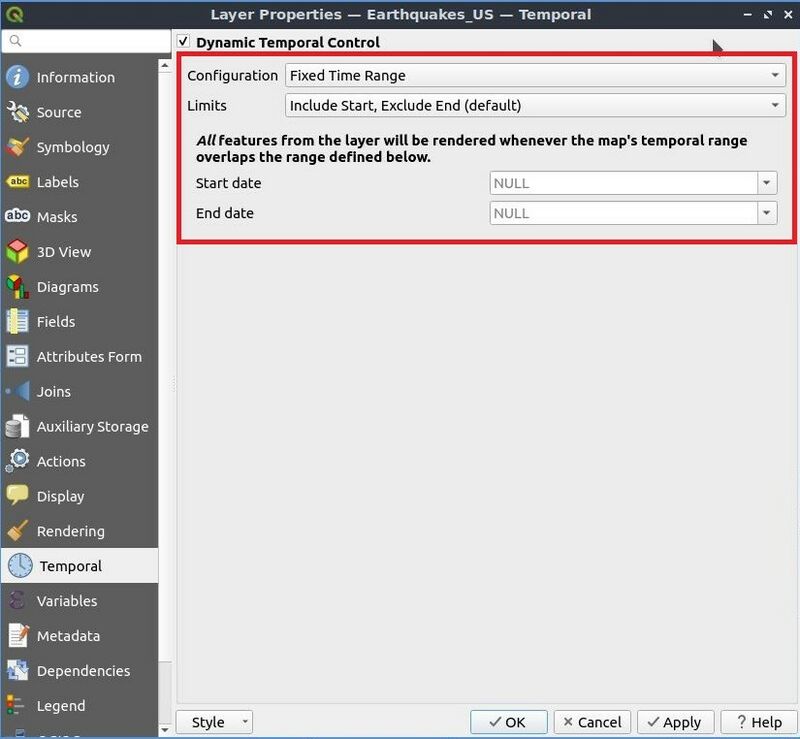
| + | * There are 5 other configuration that can be used seen below : Fixed Time Range, Separate Fields for Start and End Date/Time, Separate Fields for Start and Event Duration, Start and End Date/Time from Expressions, Redraw Layer Only |
||
| − | ::[[File:UX.png|center]] |
||
| + | [[File:TempProp_Fixed.jpeg|800px]] |
||
| + | [[File:TempProp_TwoFields.jpeg|800px]] |
||
| + | [[File:TempProp_TwoFields_for_end.jpeg|800px]] |
||
| + | [[File:TempProp_Expression.jpeg|800px]] |
||
| + | [[File:TempProp_Redraw.jpeg|800px]] |
||
| + | |||
| + | * 5: Make sure your Limit is set to the default Include Start, Exclude End |
||
| + | * 6: Set the Field to the proper Dateofocc attribute field |
||
| + | * 7: Leave the Event duration at 0 (This can be used if you are looking at similar events with longer or more varied durations) |
||
| + | * 8: Leave the Accumulate Features over Time box empty for this exercise (If you are looking to visualize and accumulation of events then check this box) |
||
| + | * 9: Finally press Apply and close the Properties tab. There should now be a clock symbol beside the earthquake layer in the Layers manager tab on the left |
||
| + | |||
| + | |||
| + | |||
| + | ==Using the Temporal Controller to Animate Time Series== |
||
| + | * In the second menu bar at the top of the screen there should be a Clock image, Press on that image and the Temporal Controller tool will appear |
||
| + | [[File:Temporal Controller.jpeg]] |
||
| + | * For this exercise set the Animation Range from "1973-01-03 00:00:00" to "1998-12-31 23:59:59" (There is a Set to full range button beside if you need the entire date range) |
||
| + | * Set the Step to 1 year (You have the option of setting the step from milliseconds to centuries or timestamps if you have them, as well as the option to loop the animation) |
||
| + | * Then simply press the play button to run the animation |
||
| − | ::[[File:TM3.png|center]] |
||
| + | ==Exporting Images and Creating GIF== |
||
| − | ==Visualizing the Distribution of the Type of Emergency== |
||
| + | * In the Temporal Controller tab there is a save icon, press this to open the Export Map Animation |
||
| − | * Right click on seattle.shp, click "properties" from the drop down menu. |
||
| + | * Enter an appropriate title and select a folder location of your choosing |
||
| − | * Browse to the "Style" tab. |
||
| + | * Set the proper extent that you want to use. For this exercise choose and extent that shows the whole world to showcase every Earthquake point |
||
| − | * Change symbology from "Single Symbol" to "Categorized" |
||
| + | * Do not change any Temporal Settings, they carry over from what you currently have |
||
| − | * Choose "Type" as the column. |
||
| + | * Press the Save button at the bottom to export the images for each Step |
||
| − | * Pick a gradient color ramp. |
||
| + | [[File:Temporal_Export.jpeg]] |
||
| − | * Click on the "Classify" button. |
||
| + | * To create a GIF you can use a GIF creating program or you can go to this website [https://ezgif.com/maker] and upload all the images that you have exported |
||
| + | [[File:GIF_editor.jpeg]] |
||
| + | * You can adjust the setting of the GIF however you want, for this exercise you can just use the default values |
||
| + | [[File:GIF_settings.jpeg]] |
||
| + | * Simply press the Make a GIF! button and it will automatically download your GIF on your computer |
||
| + | [[File:GIF_Earthquakes.gif]] |
||
==Conclusion== |
==Conclusion== |
||
| − | At this point in time, you have learned to |
+ | At this point in time, you have learned to: |
* Visualize data with Time Manager |
* Visualize data with Time Manager |
||
* Animate/Simulate with Time Manager |
* Animate/Simulate with Time Manager |
||
| Line 63: | Line 90: | ||
==References== |
==References== |
||
| + | [https://www.qgistutorials.com/downloads/ne_10m_land.zip] |
||
[https://freegistutorial.com/download-u-s-earthquake-point-shapefiles/#google_vignette] |
[https://freegistutorial.com/download-u-s-earthquake-point-shapefiles/#google_vignette] |
||
[https://www.qgistutorials.com/en/docs/3/animating_time_series.html] |
[https://www.qgistutorials.com/en/docs/3/animating_time_series.html] |
||
| + | [https://ezgif.com/maker] |
||
Latest revision as of 18:37, 29 September 2023
Contents
Introduction
This is a short tutorial on how to operate the Temporal Controller tool in QGIS for the sake of visualizing multi-temporal data. You will learn how to use the Temporal Controller by going through this tutorial on using the tool through a short exercise. In this exercise you will be visualizing the magnitude of Earthquakes in and around the USA to show each year from 1973 to 1998. You will learn of the different types of selections that you can make with the Temporal Controller and how to adjust your time series animation. At the end you will be able to export your time series images and can create a GIF animation for your presentation.
Introduction to Temporal Controller
Temporal Controller is a built in plugin of QGIS that allows for surfing through temporal geospatial data. It allows for temporal visualization of layers in QGIS. The Temporal Controller was incorporated into QGIS from version 3.14 onward. If you have an older version of QGIS refer to Visualizing Multi-Temporal Data with Time Manager for it's plugin tutorial.
Requirements
Windows/Macintosh/Linux Compatible
Getting the data
Getting Earthquake and Landmass data
- Press this link [1] to download a zip containing continental landmass shapefile and [2] that will bring you to a website with the USA Earthquake data.
- Once downloaded and save and un-zip the files in an appropriate location on your computer
Temporal Controller
Data Maintenance
- Once you have imported the two shapefiles into your QGIS project you need to make sure that your shapefile has the proper reference Field within it's attribute table.
- You need a "Date" type field with whatever time unit you are going to be using. For this tutorial you must create a new field called "Dateofocc" and use the "to_date" expression to fill in the Field
- You should End up with an Attribute Table that looks like this.
- For the purpose of this exercise you can change the symbology to anything you would like as long as you can see a difference in the magnitudes of the earthquakes.
Activating Temporal Controller
- Follow the following steps look at the image for reference
- 1: Enter the Earthquake Layer Properties
- 2: Proceed to the Temporal tab on the left had side
- 3: Check the box beside the Dynamic Temporal Control
- 4: For the purpose of this exercise we will be using the Configuration: Single Field with Date/Time.
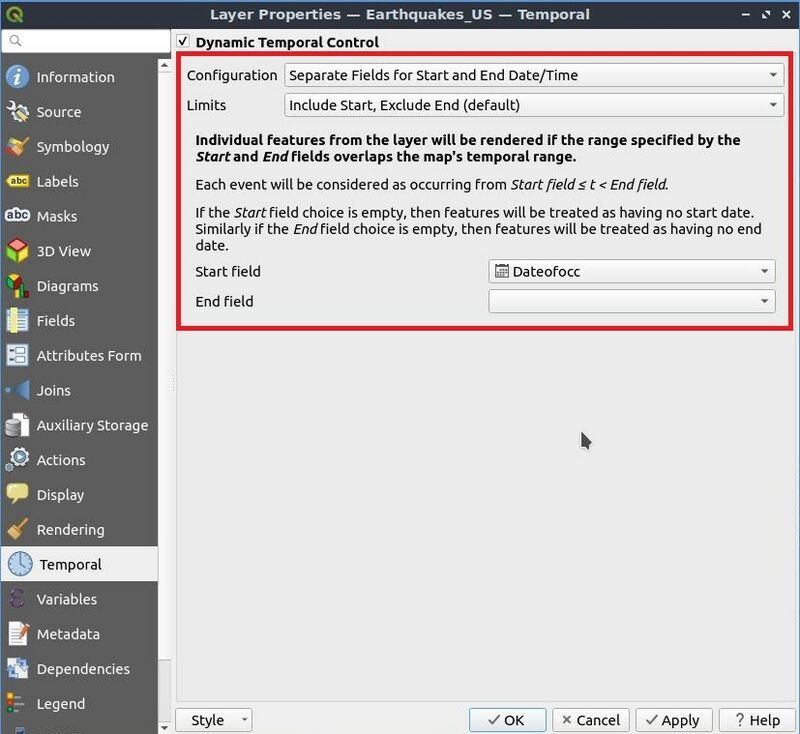
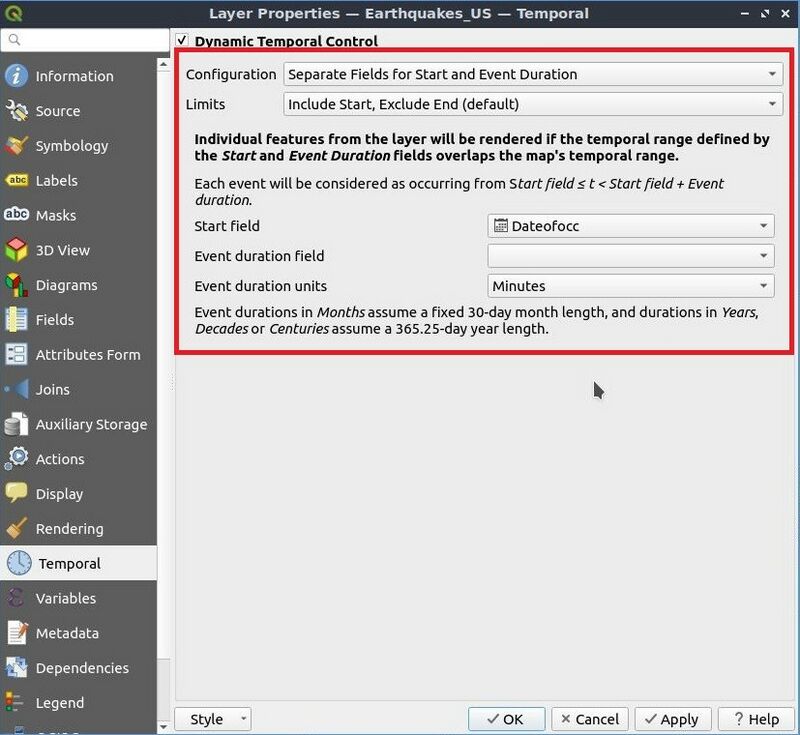
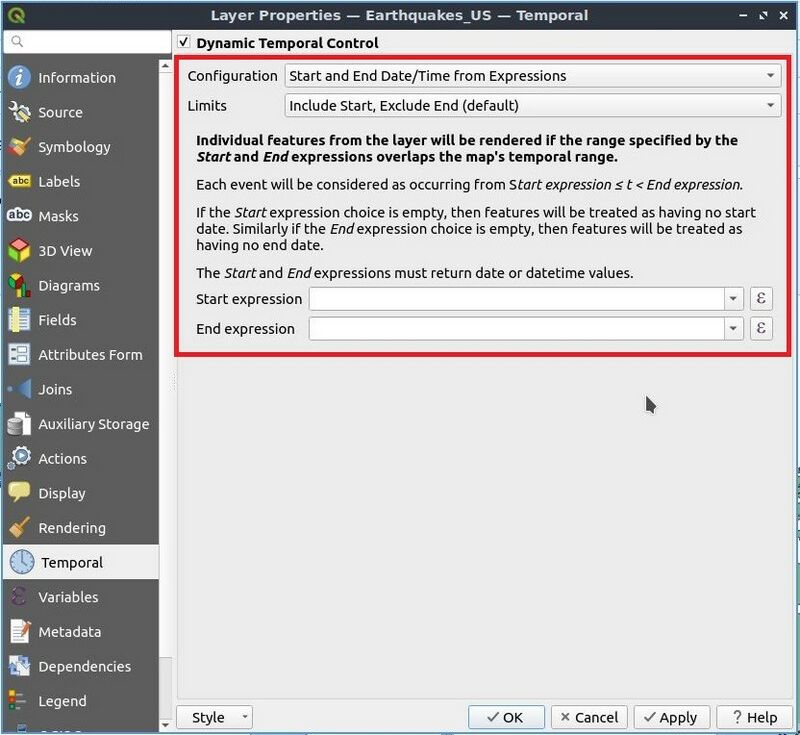
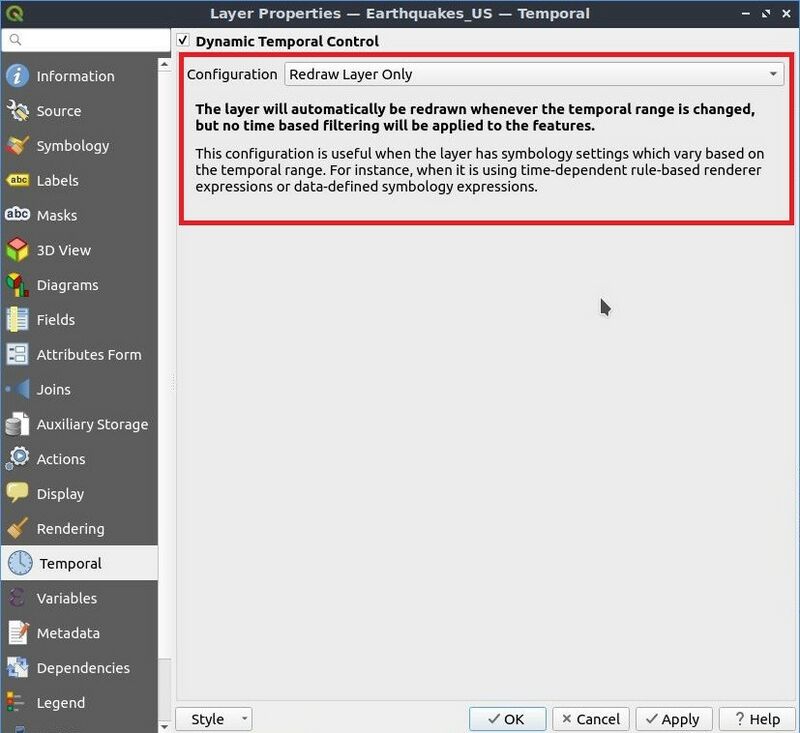
- There are 5 other configuration that can be used seen below : Fixed Time Range, Separate Fields for Start and End Date/Time, Separate Fields for Start and Event Duration, Start and End Date/Time from Expressions, Redraw Layer Only
- 5: Make sure your Limit is set to the default Include Start, Exclude End
- 6: Set the Field to the proper Dateofocc attribute field
- 7: Leave the Event duration at 0 (This can be used if you are looking at similar events with longer or more varied durations)
- 8: Leave the Accumulate Features over Time box empty for this exercise (If you are looking to visualize and accumulation of events then check this box)
- 9: Finally press Apply and close the Properties tab. There should now be a clock symbol beside the earthquake layer in the Layers manager tab on the left
Using the Temporal Controller to Animate Time Series
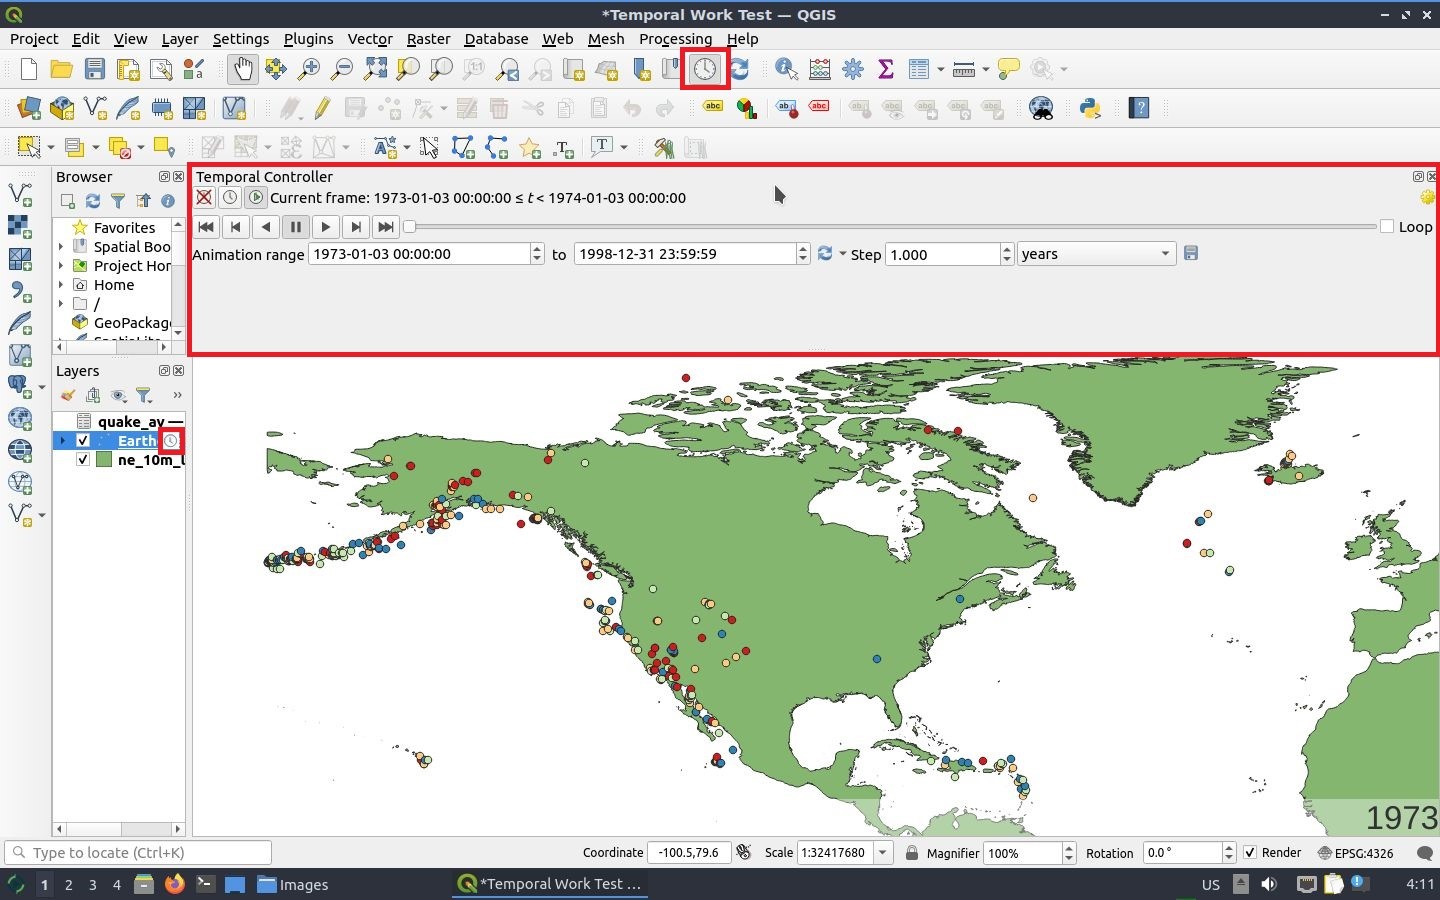
- In the second menu bar at the top of the screen there should be a Clock image, Press on that image and the Temporal Controller tool will appear
- For this exercise set the Animation Range from "1973-01-03 00:00:00" to "1998-12-31 23:59:59" (There is a Set to full range button beside if you need the entire date range)
- Set the Step to 1 year (You have the option of setting the step from milliseconds to centuries or timestamps if you have them, as well as the option to loop the animation)
- Then simply press the play button to run the animation
Exporting Images and Creating GIF
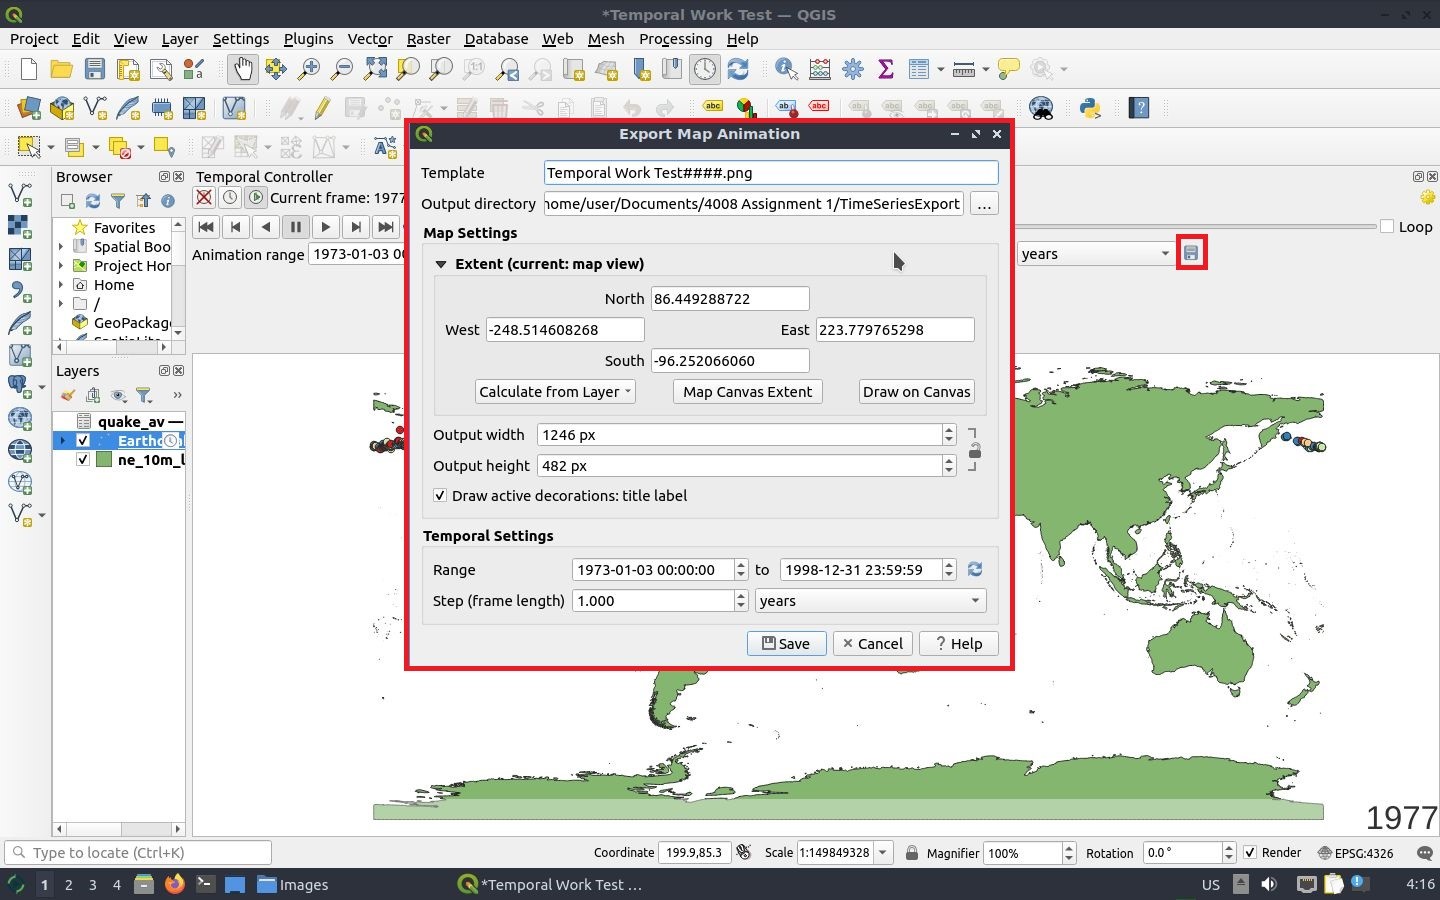
- In the Temporal Controller tab there is a save icon, press this to open the Export Map Animation
- Enter an appropriate title and select a folder location of your choosing
- Set the proper extent that you want to use. For this exercise choose and extent that shows the whole world to showcase every Earthquake point
- Do not change any Temporal Settings, they carry over from what you currently have
- Press the Save button at the bottom to export the images for each Step
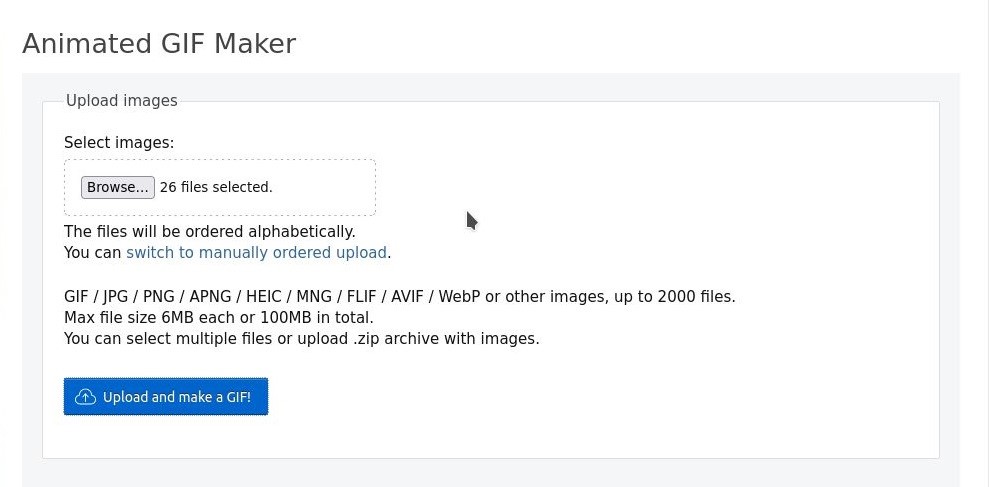
- To create a GIF you can use a GIF creating program or you can go to this website [3] and upload all the images that you have exported
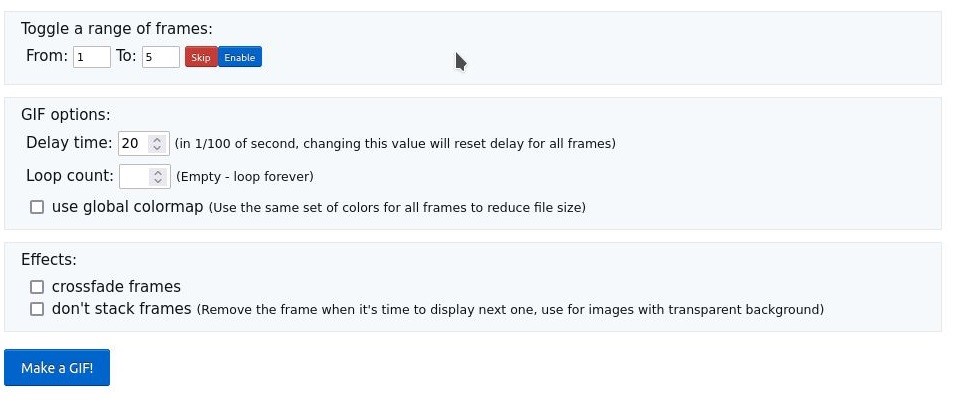
- You can adjust the setting of the GIF however you want, for this exercise you can just use the default values
- Simply press the Make a GIF! button and it will automatically download your GIF on your computer
Conclusion
At this point in time, you have learned to:
- Visualize data with Time Manager
- Animate/Simulate with Time Manager
- Export Images from the Animation
- Create GIF's from the exported images
Feel free to share your results in this wiki and/or make this tutorial more effective.
