Difference between revisions of "Hierarchical Cluster Analysis using QGIS and R"
Cnidarian17 (talk | contribs) |
Cnidarian17 (talk | contribs) |
||
| Line 72: | Line 72: | ||
[[File:ADDCSV.PNG]] |
[[File:ADDCSV.PNG]] |
||
| + | |||
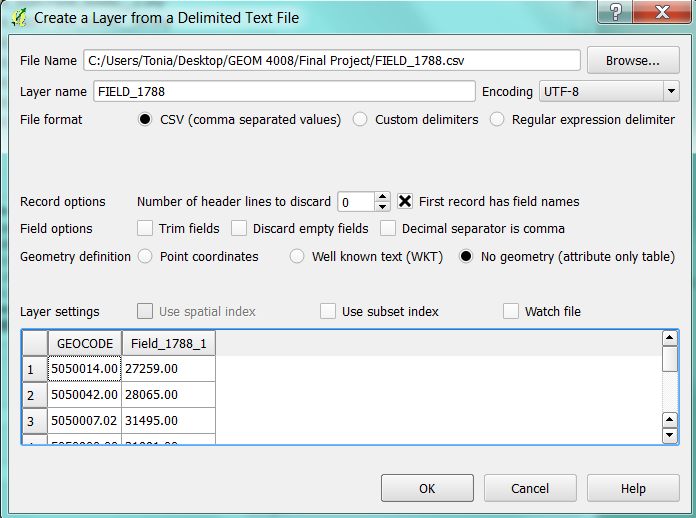
| + | The Create a layer from a delimited text file window will open. In the new window select the '''Field_1788 csv''' file. All other selections should look like the following. Once complete, select '''OK'''. |
||
| + | |||
| + | [[File:TXTDLMT.png]] |
||
Revision as of 22:04, 20 December 2014
Purpose
The purpose of this tutorial is to familiarize users with open source software, that will teach them how to manipulate, process, and map using freely accessible data. This tutorial will teach users skills such as:
- adding shp and csv data
- preforming complex attribute queries
- creating new layers from selected features
- Splitting vector layers
- Creating joins
- Adjusting layer visual features
- Creating raster heatmaps
- Generating a distance matrix
- Conducting a hierarchical cluster analysis
Installation
Quantum GIS (QGIS)
QGIS is a free and open source GIS software that is available for download from the QGIS website and compatible with all systems. It is a member of the GNU project and provides access to spatial data processing, manipulation, and visualization. Its interface is similar to ArcMap, but has fewer tools. Similar to R, users are able to create new tools for QGIS by programing python scripts that must be approved by the QGIS team. Once approved the scripts become downloadable plugins for the program.
Download and Install QGIS
- Click on the following link to download the QGIS software [1]
- The version used in this tutorial was version 2.6.1
- Click on the download option and select the option that is appropriate to your operating system.
- The program should begin to download, once it is finished downloading, run the program and follow the prompts.
The R Project
R is a freeware package used for statistical computation and graphic generation within a coding language environment (Torfs & Brauer, 2014). It was an original member of the GNU project, as it provides free software for all operating systems available for download from the r-project website. R is often used both in educational and professional contexts (). What makes this system invaluable is its flexibility, in that there are often many ways to preform simple tasks and its capabilities are constantly growing as users code new functions in downloadable packages that can be added to the main system.
Download and Install R
- Click on the following link to download R [2]
- Choose the appropriate system to download the program
- Once downloaded run the file and follow the prompts
Required Data
Shapefile Data
The data is freely available and downloadable by accessing the following websites. Once on the website selecting the appropriate files for download, save them to the computer in an appropriate file and unzip them. The following is the list of data required to compete this tutorial.
- City of Ottawa street tree inventory shapefile (Tree_Inventory_Apr 2013 shp) [3]
This layer contains point data as a shapefile of all City of Ottawa City-owned trees, which includes street trees and some park trees. It is a tree inventory database that was developed by City of Ottawa forestry staff in the field using GPS software. The data was published by the City on April 22, but the dates when it was collected are unknown. It contains data such as locational information for trees, their species type and treatment regimen.
- City of Ottawa Ward boundaries 2010 shapefile(wards-2010-2 shp) [4]
This is a shapefile of polygon data for the City of Ottawa’s 23 wards, that was published by the city.
- Canadian Census Tract boundaries 2006 [5]
The census tract boundary is one of the smallest, and most static political boundaries. This file contains polygon census tract boundaries for major metropolitan areas in Ontario.
csv data
- Canadian Census 2006 Income and Earnings – this file is available from Carleton University or by downloading it from this page File:FIELD 1788.pptx
This file contains the data from field 1788 of the Income and Earnings portion of the 2006 Canadian Census for all Ottawa census tracts. Field 1788 is the median family income after taxes.
Adding files to QGIS
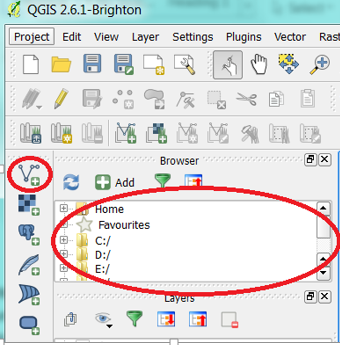
Loading shapefiles To load the shapefiles into QGIS either find the files in the Browser and double click the file(s) or use the Add vector layer tool located on the sidebar of the program window.
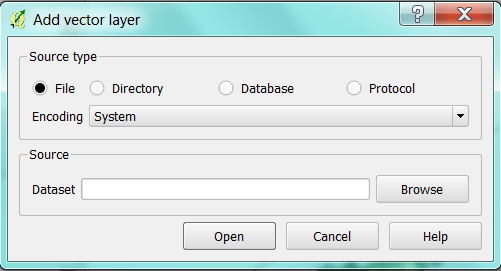
If you are using the Add vector layer tool (![]() ), select the tool, use the Browse button in the source section to locate the files and then select Open. Repeat this step to load each shapefile.
), select the tool, use the Browse button in the source section to locate the files and then select Open. Repeat this step to load each shapefile.
Note: All of the files are from the City of Ottawa and as such they all are projected in MTM zone 9 NAD83, as their projections are all the same and recognized by QGIS there is no need to set or change their projection.
Loading the csv data
Once the census data file is downloaded from this webpage, open it and copy all the contents of the table. Open the program excel or another spreadsheet program, paste the data into the spreadsheet using match destination formatting and then save the file as a csv. Open the program Notepad, type "String","Integer" and save the file as a csvt using the exact same name as the csv file. This is an important step because it prevents QGIS from discarding the zeros that follow the decimal place in the census tract geocodes when it is uploaded.
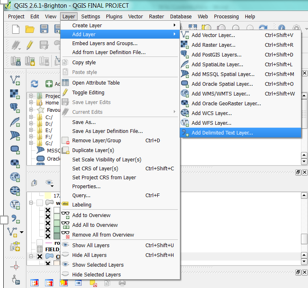
To load the table into QGIS in the main menu select Layer, then select Add Layer from the drop down menu and then select Add Delimited Text Layer.
The Create a layer from a delimited text file window will open. In the new window select the Field_1788 csv file. All other selections should look like the following. Once complete, select OK.


