Difference between revisions of "Thematic Mapping using GrassGIS"
| Line 12: | Line 12: | ||
== Introduction == |
== Introduction == |
||
The purpose of this tutorial is to show how to represent and visually understand spatial vector data using thematic mapping. This tutorial addresses a problem that many individuals have when looking for new housing. The issue is of finding the most appropriate area to live in based on a multitude of factors. This tutorial focuses on Carleton University students in particular and the confusion or misinformation in choosing an appropriate place to live in Ottawa off campus. This issue is addressed through the use of thematic mapping and criteria outlined by the |
The purpose of this tutorial is to show how to represent and visually understand spatial vector data using thematic mapping. This tutorial addresses a problem that many individuals have when looking for new housing. The issue is of finding the most appropriate area to live in based on a multitude of factors. This tutorial focuses on Carleton University students in particular and the confusion or misinformation in choosing an appropriate place to live in Ottawa off campus. This issue is addressed through the use of thematic mapping and criteria outlined by the [http://housing.carleton.ca/off-campus/advice-and-cautions/ Carleton University Off-Campus Housing Office]. For the sake of time there are only three main factors looked at when looking for where to live, they are: Rent price, Crime/safety, and Proximity to the university. |
||
This tutorial will show how to add and manipulate relevant spatial data in order to make thematic maps representing the criteria students are looking for. The tutorial can act as a precursor to a tool that can be implemented by Carleton University to develop a thematic map that students without the GIS knowledge to use. There is a lot of potential for this to be used for more than just students as well since it helps people find places to look for housing based on ideal criteria. |
This tutorial will show how to add and manipulate relevant spatial data in order to make thematic maps representing the criteria students are looking for. The tutorial can act as a precursor to a tool that can be implemented by Carleton University to develop a thematic map that students without the GIS knowledge to use. There is a lot of potential for this to be used for more than just students as well since it helps people find places to look for housing based on ideal criteria. |
||
| Line 21: | Line 21: | ||
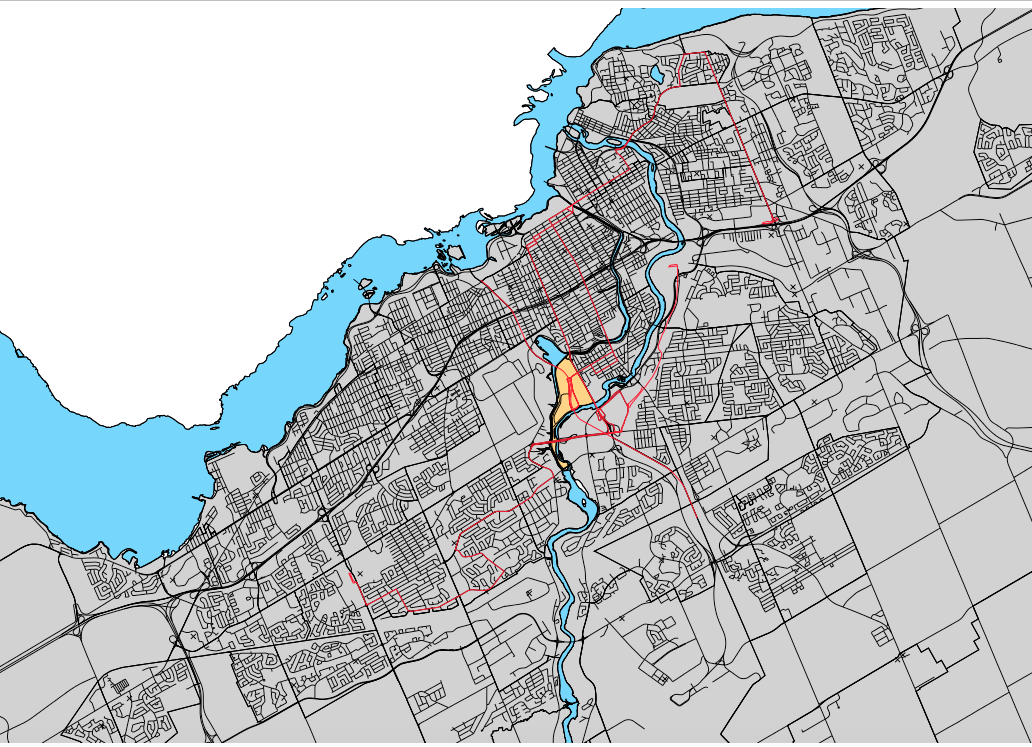
Figure 1: The study area of the tutorial central to Carleton University. |
Figure 1: The study area of the tutorial central to Carleton University. |
||
== Software == |
== Software == |
||
Revision as of 22:34, 17 December 2015
Purpose
The purpose of this tutorial will be to use multiple tools in Grass GIS that will manipulate vector data. The example to be used in the tutorial will be the analysis of Ottawa City neighbourhoods to determine where would be the most appropriate place to live as a student attending Carleton University. This tutorial will use the following tools:
Extract- selection by attributes, Patch- patch vector layers together, Select- selection by location,
Overlay- clip tool, and Buffer- generate buffer
There will also be some coding using the command console for tools that are not included in the WxGUI.
This is a basic introduction to thematic mapping using the Grass GIS software vector analysis capabilities.
Introduction
The purpose of this tutorial is to show how to represent and visually understand spatial vector data using thematic mapping. This tutorial addresses a problem that many individuals have when looking for new housing. The issue is of finding the most appropriate area to live in based on a multitude of factors. This tutorial focuses on Carleton University students in particular and the confusion or misinformation in choosing an appropriate place to live in Ottawa off campus. This issue is addressed through the use of thematic mapping and criteria outlined by the Carleton University Off-Campus Housing Office. For the sake of time there are only three main factors looked at when looking for where to live, they are: Rent price, Crime/safety, and Proximity to the university.
This tutorial will show how to add and manipulate relevant spatial data in order to make thematic maps representing the criteria students are looking for. The tutorial can act as a precursor to a tool that can be implemented by Carleton University to develop a thematic map that students without the GIS knowledge to use. There is a lot of potential for this to be used for more than just students as well since it helps people find places to look for housing based on ideal criteria.
The data used for this tutorial are available on the Carleton University library website as well as through the City of Ottawa, Ottawa Neighbourhood Study, OCTranso, and Ottawa Police websites.
Figure 1: The study area of the tutorial central to Carleton University.
Software
Grass GIS
Data
Data Identification
The data to be used in the tutorial was determined through the identification of criteria and research into the availability of the data required. Carleton University library had all of the data compiled from their original sources. The data available is relatively recent in terms of the last studies conducted (Census) and explains the criteria we are looking for. The data sets included are as follows:
1. Ottawa Thematic Data
2. Ottawa Police Crime Statistics
3. OC Trasnpo 2014 Route Data
4. Ottawa Neighbourhood Study (Both shape files and statistical data)
