Difference between revisions of "Enhanced Wetness Modelling in SAGA GIS"
Malek Singer (talk | contribs) |
Malek Singer (talk | contribs) |
||
| Line 18: | Line 18: | ||
*For accessing folders and data files refer to '''Data Source | File System (left of the screen)'''. The imported data will appear under '''Manager'''; once the data layer is double clicked, it will appear in the right part of the screen as a '''Map''' layer. |
*For accessing folders and data files refer to '''Data Source | File System (left of the screen)'''. The imported data will appear under '''Manager'''; once the data layer is double clicked, it will appear in the right part of the screen as a '''Map''' layer. |
||
| ⚫ | |||
*Under '''Properties''', information about the layer can be viewed, as well as settings, symbology, attributes, and history of processing. |
*Under '''Properties''', information about the layer can be viewed, as well as settings, symbology, attributes, and history of processing. |
||
*The bottom part of the screen has '''Messages''' which will show in the General tab every single command ran in SAGA with the time of execution and if the method succeeded or not. |
*The bottom part of the screen has '''Messages''' which will show in the General tab every single command ran in SAGA with the time of execution and if the method succeeded or not. |
||
| Line 37: | Line 34: | ||
=Setting Environment= |
=Setting Environment= |
||
==Data Import== |
==Data Import== |
||
| ⚫ | |||
==Saving Data== |
==Saving Data== |
||
==Data Referencing== |
==Data Referencing== |
||
Revision as of 16:53, 19 December 2015
Contents
Purpose
The purpose of this tutorial is not only to present an efficient workflow for modelling wetness, but also to explain the different options offered for module inputs throughout the way, as well as why the chosen ones were favoured. The SAGA documentations show that different options are available, yet only includes a reference to a paper that tells where the method was derived from with minimal description. This tutorial will explain how the used methods work and what differentiates them from others. Other methods that were options but not used will be briefly explained as well.
Preamble
This is a workflow that offers an enhanced method for modelling wetness of a terrain. A terrain’s wetness index is a secondary terrain attribute derived from a digital elevation model through different transformations to the raster grid. The method presented in this tutorial is rather more detailed and precise then others because the two defining parameters involved in calculating a wetness index (up slope area and slope) are calculated in particular ways that do not use the assigned defaults or the one step algorithms.
Attention: this workflow has been generated using SAGA GIS 2.2.2 thus all the headings and toolset names are specific to this version. Slight differences in module names are introduced between this version and the one before. SAGA offers Module Library Documentations for the last 5 version. Note that some instructions that yield the same result might have different names/options in different versions (e.g. Catchment Area tool in 2.2.2 was called Flow Accumulation in 2.1.2). Another helpful resource would be the SAGA Forum where a lot of resources and exchanges between GIS users are available.
SAGA GIS was used because of its high efficiency in processing spatial data, and its many offered options for dealing with environmental modelling. SAGA GIS is also a Free Open Source Software (FOSS) which means its source code can be manipulated to suit the user’s needs. In this tutorial no custom code or automation was used, but would be considered for a bigger workflow to increase productivity. To download SAGA GIS: http://sourceforge.net/projects/saga-gis/files/
Introduction to the SAGA Environment
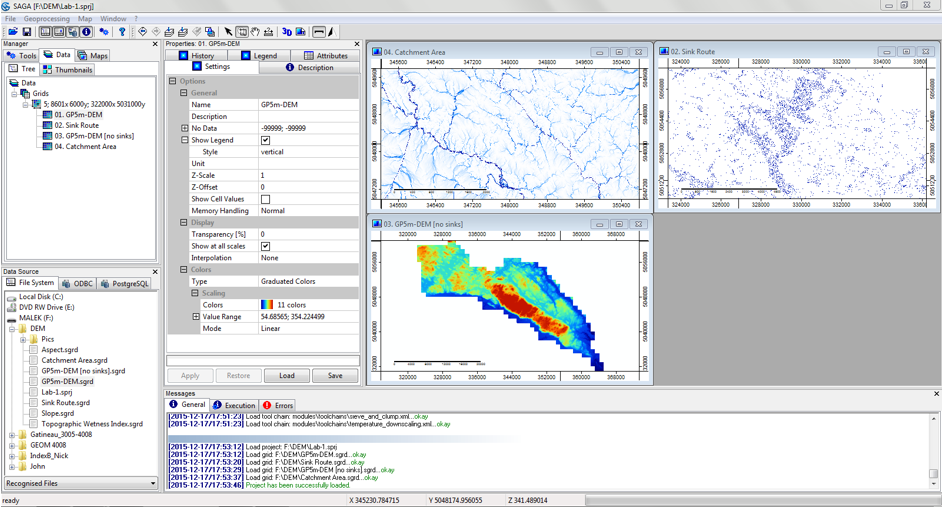
Throughout your work in SAGA GIS, the tools used, progress, errors, and results can be tracked in different ways. The figure below shows what the SAGA GIS workspace looks like. The main control sections are the Manager, Data Source, Properties, and Messages.
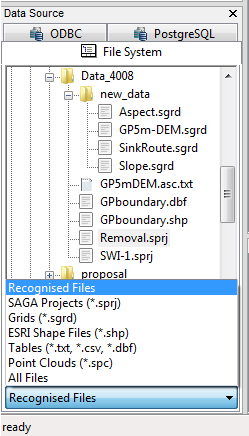
- For accessing folders and data files refer to Data Source | File System (left of the screen). The imported data will appear under Manager; once the data layer is double clicked, it will appear in the right part of the screen as a Map layer.
- Under Properties, information about the layer can be viewed, as well as settings, symbology, attributes, and history of processing.
- The bottom part of the screen has Messages which will show in the General tab every single command ran in SAGA with the time of execution and if the method succeeded or not.
- The Execution tab shows the inputs assigned to the module.
- If any errors arise during running, they appear under the Errors tab.
- To track the used tools as well, SAGA keeps a record of the last used tools in order under Geoprocessing.
Data & Study Site
This exercise is done using data from Gatineau Park, Quebec (Canada). The used data:
- Digital Elevation Model (DEM): LiDAR-derived, 5 meter resolution
- Gatineau Park boundary: polygon layer
The data used is acquired from a non-public source, however, any DEM can be used to execute the same workflow demonstrated by this tutorial.

