Difference between revisions of "Georeferencing Raster Imagery in SAGA GIS"
| Line 47: | Line 47: | ||
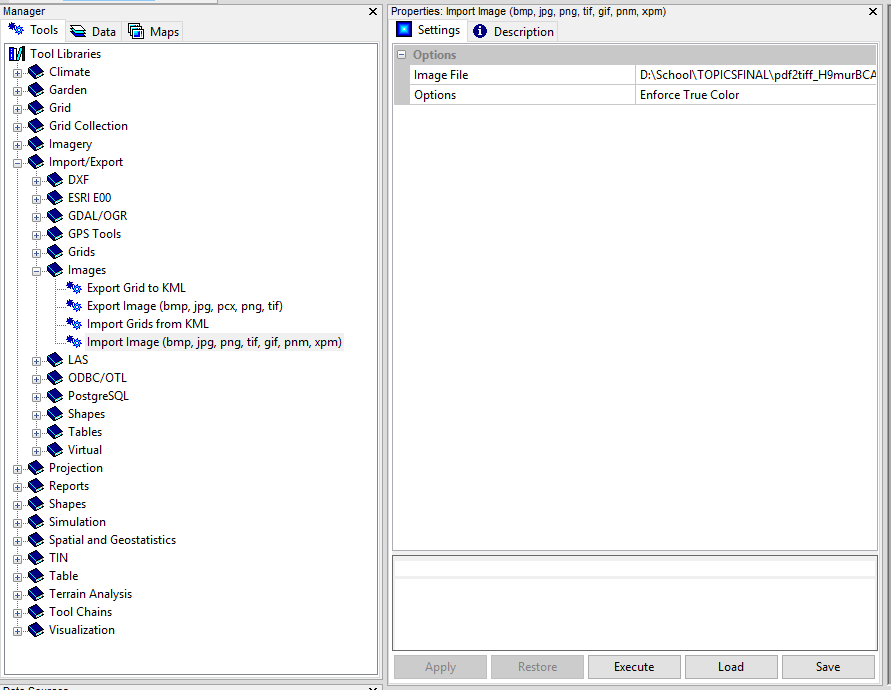
# In the '''Image File''' field, select the historical map you downloaded earlier |
# In the '''Image File''' field, select the historical map you downloaded earlier |
||
# In the '''Options''' field. select '''Enforce True Colour''' |
# In the '''Options''' field. select '''Enforce True Colour''' |
||
| + | # Double click your imported file in the '''Data''' Tab in order to view the file. |
||
| ⚫ | |||
| + | In order to georeference an image, we use '''Ground Control Points''' (GCPs). these are points that establish a relationship between the pixel coordinate system of the raster to a coordinate system of the earth. GCPs are typically placed at sharp features such as intersections or easily visible landmarks, but for this map, we will use sections of the map graticule with known coordinates. |
||
| ⚫ | |||
| + | |||
| + | # To start creating the GCPs, we will run the '''Create Reference Points''' module. in the '''Tools''' tab, select '''Projection -> Georeferencing -> Create Reference Points [Interactive]''''. |
||
| + | #Click the '''Okay''' button in the pop-up menu. this module creates a shapefile with two attribute fields, used to store the latitude and longitude of a point. |
||
| + | # Zoom to an area of the imported file with known coordinates, such as the intersection of two known graticules (See figure 7). |
||
| + | ##[[File:Graticules.PNG|frame|center|Figure 7: Initial GCP Location]] |
||
| + | # Select the Action button (See figure 8), and click the location of your first GCP. in the pop-up window, enter the x and y (on earth) coordinates of that point. |
||
| + | ##[[File:Action_button.PNG|frame|center|Figure 8: Action Button]] |
||
| + | # Repeat this process at least four more times, each with a different point. Once you have completed this, end the module by selecting '''Geoprocessing -> Create Reference Points [Interactive]''' in the menu bar at the top of the screen (See figure 9). |
||
| + | ##[[File:Endmodule.PNG.PNG|frame|center|Figure 9: Ending a Module]] |
||
| + | |||
| + | We must now add projection information to the image. According to our map, the projection used is '''NAD 1927 UTM'''. |
||
| + | |||
| + | #Open the '''Set Coordinate Reference System''' module. in the '''Tools''' tab, select '''Projection -> Proj.4 -> Set Coordinate Reference System'''. Select the '''User Defined''' field and |
||
===Rectification=== |
===Rectification=== |
||
Revision as of 05:46, 20 December 2017
Contents
Introduction
Georeferencing
Raster data such as aerial photographs, toposheets, and print maps normally do not contain any spatial reference information. Other times, the image does not properly align with other data, and requires transformation in order to be used in conjunction with existing data. Georeferencing rasters is a means of accomplishing both courses of action, and is a common and important task in the field of geospatial analysis (especially when working with historical imagery or maps). ESRI defines Georeferencing as:
Aligning geographic data to a known coordinate system so it can be viewed, queried, and analyzed with other geographic data. Georeferencing may involve shifting, rotating, scaling, skewing, and in some cases warping, rubber sheeting, or orthorectifying the data. citation
This tutorial contains an introduction to the process of georeferencing imagery in the SAGA GIS software, as well as information on the fundamentals of the georeferencing process.
SAGA GIS
For the following tutorial, System for Automated Geoscientific Analyses, or SAGA GIS software will be used. SAGA GIS is a free, open-source geographic information system program, originally developed by a team from the Department of Physical Geography in the University of Gottingen, Germany. It is available for Windows, Linux, and FreeBSD operating systems. When the SAGA GIS team began development in 2001, the purpose of the software was aligned with the needs of the development team, such as the analysis of raster imagery, with a focus on digital elevation models (DEM). Over the years, however, the software has broadened in scope, as it has seen many feature contributions from it's world-wide user community (http://saga-gis.sourceforge.net/en/).
Documentation for the SAGA GIS tool library can be found in the SAGA-GIS Tool Library Documentation
Installation Instructions
The latest version of SAGA GIS can be downloaded on the SAGA GIS Sourceforge page. At the time of writing, the latest version of SAGA GIS is 6.1.0.
Data Acquisition
For the following tutorials, you will need to acquire imagery from two sources: Satelite imagery from Google Earth, and a PDF toposheet or scanned print map.
Google Earth
For this tutorial, we will be using imagery from google earth. to obtain this imagery, perform the following steps.
- ensure that you have downloaded and installed Google Earth on your computer
- Open Google Earth, and zoom to the area of interest of your choice. for this tutorial, we used the area around the Smithsonian Museum of Natural History in Washington, DC, USA, but any location will suffice.
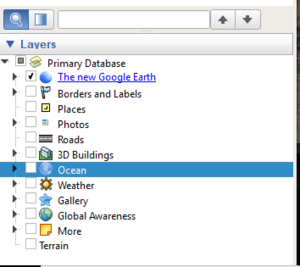
- In the Layers menu in the bottom left corner of your screen, uncheck all layers. Google earth renders terrain in 3d, and the perspective this creates can distort your exported imagery (See Figure 2).
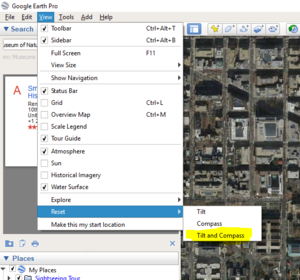
- Ensure that your imagery is north-facing and vertically-angled by selecting View -> Reset -> Tilt and Compass in the menu bar at the top of the screen (See Figure 3)
- Under Tools -> Options, ensure that under Show Lat/Long, Universal Transverse Mercator is selected.
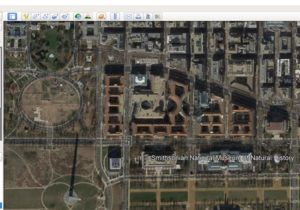
- Using the Add Placemark tool (See Figure 4), add four or more placemarks to your screen. make note of their coordinates and label them numerically. change their icon to one that is more precise, location-wise.
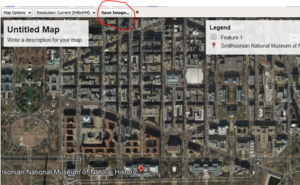
- Save your image by selecting File -> Save -> Save Image in the menu bar at the top of the screen. then, press the Save Image Button (See Figure 5).
Print Map
For this tutorial, we will be using a scan of a historical watershed boundary map of Alberta, made available through the Open Government License. the following pre-tutorial steps must be performed:
- Download the file from the following link. you can use any other PDF or raster map as long as it contains some sort of absolute location information.
- If necessary, convert the pdf to a raster TIF file. many free websites exist to perform this conversion, such as PDFaid.com. Ensure that the conversion is performed at a high enough DPI that all text is legible. for this tutorial, we chose 150 DPI.
- Save the converted file in a working directory of your choice.
Tutorial
Georeferencing a Historical Map
In the following tutorial, the process of georeferencing a historical map in SAGA GIS will be explained. To begin, we will import the image into SAGA GIS.
- In the Tools tab, select Import/Export -> Images -> Import Image
- In the Image File field, select the historical map you downloaded earlier
- In the Options field. select Enforce True Colour
- Double click your imported file in the Data Tab in order to view the file.
In order to georeference an image, we use Ground Control Points (GCPs). these are points that establish a relationship between the pixel coordinate system of the raster to a coordinate system of the earth. GCPs are typically placed at sharp features such as intersections or easily visible landmarks, but for this map, we will use sections of the map graticule with known coordinates.
- To start creating the GCPs, we will run the Create Reference Points module. in the Tools tab, select Projection -> Georeferencing -> Create Reference Points [Interactive]'.
- Click the Okay button in the pop-up menu. this module creates a shapefile with two attribute fields, used to store the latitude and longitude of a point.
- Zoom to an area of the imported file with known coordinates, such as the intersection of two known graticules (See figure 7).
- Select the Action button (See figure 8), and click the location of your first GCP. in the pop-up window, enter the x and y (on earth) coordinates of that point.
- Repeat this process at least four more times, each with a different point. Once you have completed this, end the module by selecting Geoprocessing -> Create Reference Points [Interactive] in the menu bar at the top of the screen (See figure 9).
- File:Endmodule.PNG.PNGFigure 9: Ending a Module
We must now add projection information to the image. According to our map, the projection used is NAD 1927 UTM.
- Open the Set Coordinate Reference System module. in the Tools tab, select Projection -> Proj.4 -> Set Coordinate Reference System. Select the User Defined field and
