Difference between revisions of "Conducting a Viewshed Analysis in QGIS"
(Created page with "This page is under construction...") |
|||
| (50 intermediate revisions by 2 users not shown) | |||
| Line 1: | Line 1: | ||
| + | == '''Introduction''' == |
||
| − | This page is under construction... |
||
| + | |||
| + | ===Viewshed Tool=== |
||
| + | The viewshed analysis is a powerful process which allows users to "know how visible objects might be—for example, from which locations on the landscape will the water towers be visible if they are placed in a particular location," (ArcGis 2020). For this particular tutorial, the Viewshed analysis will be conducted using Quantum GIS (QGIS). QGIS is a powerful open source software that is available to all users. There is no built-in viewshed analysis tool for QGIS, so the user is required to install an open source plugin through the plugin function. |
||
| + | |||
| + | [[File:QgislogoMattNick.png|caption|border|200px]] |
||
| + | |||
| + | ===Installation of the Visibility Analysis Plugin in QGIS=== |
||
| + | '''Process''' |
||
| + | |||
| + | Before conducting the Viewshed analysis in QGIS the user will need to install the "Visibility Analysis" plugin by: |
||
| + | |||
| + | 1) Opening QGIS Desktop. |
||
| + | |||
| + | 2) Select the "Plugins" menu in the toolbar at the top of the screen. |
||
| + | |||
| + | 3) Select "manage/install plugins", this will bring the user to a window where the user can search the "Visibility Analysis" tool. |
||
| + | |||
| + | 4) Once the tool has been selected, the user will proceed to install the plugin. |
||
| + | |||
| + | 5) From here the user will now have access to the plugin through the Processing Toolbox. |
||
| + | |||
| + | == '''Objective''' == |
||
| + | The objective of this tutorial is to help the user understand the function that spatial resolution has on a raster data set. Spatial resolution refers to the number of pixels that are used when constructing a digital image, such as a digital elevation model (DEM). Images that have a higher resolution have a greater number of pixels in the image than images with a lower resolution. The spatial resolution that one should use for geo-spatial analysis depends on the level of detail required to complete a project. |
||
| + | |||
| + | In the [[Conducting_a_Viewshed_Analysis_in_QGIS#Process|Process]] section of this tutorial, the user will install the "Visibility Analysis" plugin in QGIS and then proceed to create three viewsheds over three DEMs of differing resoltuion available in the [[Conducting_a_Viewshed_Analysis_in_QGIS#Data|Data ]] section. The analysis will be facilitated by a realistic [[Conducting_a_Viewshed_Analysis_in_QGIS#Mock_Scenario|mock scenario]] to get users to compare the results of the viewshed between the different resolution DEMs. |
||
| + | |||
| + | == '''Mock Scenario''' == |
||
| + | You are a contractor Geomatic Analyst recently approached by Travel Nunavut (TN), a not-for-profit tourism agency with the intention of attracting tourists to historic and areas on Baffin Island. TN has proposed to you that they would like to erect a 5m tall viewing platform on top of Thor Peak (coordinates: 66.53337036222605, -65.31670300114362, or: 66°32'00.1"N 65°19'00.1"W) in the Akshayuk Pass, a hiking trail in Auyuittuq National Park. TN has contacted you because they would like you to create a model to show them what the visitors would be able to see from that spot and height. You have managed to find a public online source offering DEMs of the area differing resolutions and now need to determine which is the best to use to conduct a viewshed analysis and present TN with the data. |
||
| + | |||
| + | |||
| + | [[File:AkshayukPassMapGoodMattNick.jpg|caption|border|1000px]] |
||
| + | |||
| + | '''Figure 1.''' The locations of Akshayuk Pass and Thor Peak in Auyuittuq National Park, Nunavut, Canada. |
||
| + | |||
| + | == '''Data''' == |
||
| + | Digital elevation models (DEMs) will be downloaded and used to conduct a viewshed analysis and are a form of raster data (comprised of a grid of pixels). The DEMs will be in a Tagged File Format that has the file extension “.tif”. |
||
| + | |||
| + | The data can be downloaded from the University of Minnesota’s ArcticDEM datasets from the following link: |
||
| + | |||
| + | https://www.pgc.umn.edu/data/arcticdem/ |
||
| + | |||
| + | Click on the “Browse server” button and then click on the “mosaic” folder, then the “v3.0/” folder, and finally download the 100 metre, 500 metre, and 1-kilometre resolution DEMs. Depending on internet speed, the downloads might take considerable time to download. Once downloaded, extract the zipped files into a drive of your choice. |
||
| + | |||
| + | == '''Process'''== |
||
| + | |||
| + | '''NOTE:''' This process was conducted using the most recent version of QGIS at the time of writing this tutorial: QGIS Desktop 3.16. |
||
| + | |||
| + | Ensure that QGIS is downloaded and functions properly on your computer. [https://qgis.org/en/site/forusers/download.html Click here] to download the latest version of QGIS. |
||
| + | |||
| + | Download the data from the previous section before starting the tutorial. |
||
| + | |||
| + | Open QGIS Desktop and start an empty new project. |
||
| + | |||
| + | |||
| + | [[File:Figure1MattNick.jpg|caption|border|1000px]] |
||
| + | |||
| + | '''Figure 2.''' Open an empty new project and give it a name. |
||
| + | |||
| + | |||
| + | Navigate to the “Plugins” menu on the top toolbar in QGIS. Click “Manage and Install Plugins…” and after QGIS fetches the repositories, click on the search bar and type in “Visibility Analysis”. Once the plugin shows, click on Install in the bottom right corner of the window. |
||
| + | |||
| + | |||
| + | [[File:Figure2MattNick.jpg|caption|border|1000px]] |
||
| + | |||
| + | '''Figure 3.''' Installing the Visibility Analysis Plugin. |
||
| + | |||
| + | |||
| + | Next, navigate to “Layer” on the Menu Toolbar, and then click on “Add Layer”, then “add a raster layer”. Click on the “…” browse button and locate the folder where you stored the unzipped 100m DEM. Click on Add to import a single DEM at a time. Repeat these steps to add the 500m and 1km DEMs. |
||
| + | |||
| + | |||
| + | [[File:Figure3MattNick.jpg|caption|border|1000px]] |
||
| + | |||
| + | '''Figure 4.''' Adding the DEMs into the empty project. |
||
| + | |||
| + | |||
| + | Once the DEMs have been imported into QGIS, it is time to create a new shapefile (.shp) for the viewpoints. Viewpoints will be used in by the Visibility Analysis to create a viewshed. Start by clicking on Layer > Create Layer > New shapefile Layer… and then title the shapefile “Viewpoints” and select a location to save the file using the “…” browse button. Change the geometry type to be Point and leave the rest of the settings as is. Then, click OK to create the new shapefile. |
||
| + | |||
| + | |||
| + | [[File:Figure4MattNick.jpg|caption|border|1000px]] |
||
| + | |||
| + | '''Figure 5.''' Creating a new “Viewpoints” shapefile. |
||
| + | |||
| + | |||
| + | Start by creating a viewshed on the 1km DEM. In the Layers Panel on the left side of QGIS, only have the 1km DEM selected “on”, which will appear as having a checkmark by the layer’s name. Then, start an editing session by clicking on the pencil-looking icon on the Selection Toolbar. Use the wheel of your mouse to pan into Auyuittuq National Park. For reference, view the map provided in the [[Conducting_a_Viewshed_Analysis_in_QGIS#Mock_Scenario|Mock Scenario]] section. Then, click the “Add Point Feature” and place a point at the relative location of Thor Peak. A “Viewpoints-Feature Attributes” window will pop up, click OK. Finally, click on the “Save Layer Edits” button in the Selection Toolbar. This will stop the editing session for the Viewpoints shapefile layer. |
||
| + | |||
| + | |||
| + | [[File:Figure5.1MattNick.jpg|caption|border|1000px]] |
||
| + | |||
| + | '''Figure 6.''' The location of the Toggle Editing, Add Point Feature, and Save Layer Edits on the Selection Toolbar. |
||
| + | |||
| + | |||
| + | [[File:Figure6MattNick.jpg|caption|border|1000px]] |
||
| + | |||
| + | '''Figure 7.''' The point of the Viewpoints shapefile representing the relative location of Thor Peak in Auyuittuq National Park on Baffin Island. |
||
| + | |||
| + | |||
| + | Now open the Processing Toolbox. The icon is a small gear on the Attribute Toolbar. |
||
| + | |||
| + | |||
| + | [[File:Figure7.1MattNick.jpg|caption|border|1000px]] |
||
| + | |||
| + | '''Figure 8.''' The location of the Processing Toolbox on the Attributes Toolbar. |
||
| + | |||
| + | |||
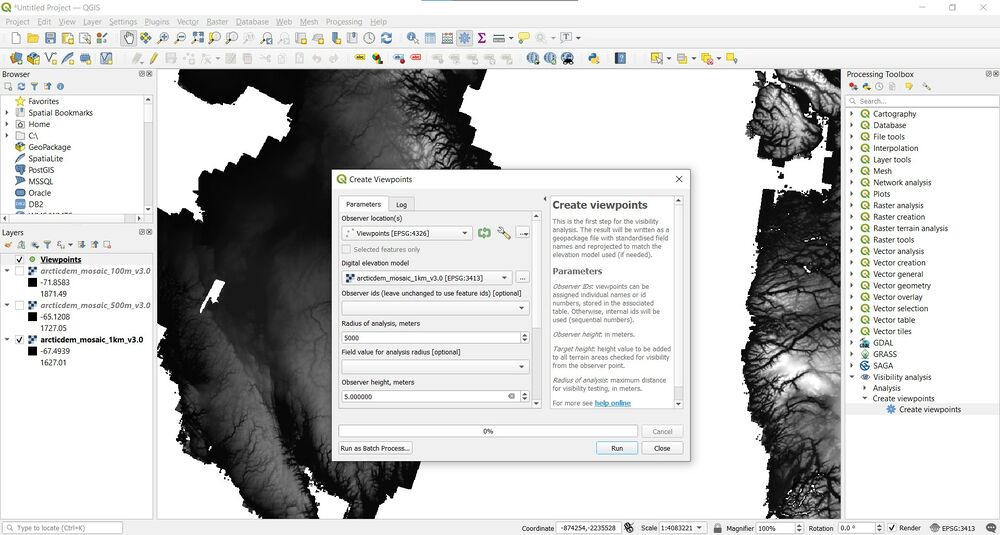
| + | In the Processing Toolbox, click on the arrow next to the Visibility Analysis tool to expand the menu options. Then, click on the arrow next to “Create viewpoints” and select the Create viewpoints tool. A window will pop up. For Observer locations use the Viewpoints layer you created earlier, for the Digital elevation model select the 1km DEM, for Radius of analysis enter 5000m, and for the Observer height enter 5m to emulate the viewing platform that TN wants to build at the top of Thor Peak. Click OK and it will create an Output layer. |
||
| + | |||
| + | |||
| + | [[File:Figure8MattNick.jpg|caption|border|1000px]] |
||
| + | |||
| + | '''Figure 9.''' Using the Create viewpoints tool. |
||
| + | |||
| + | |||
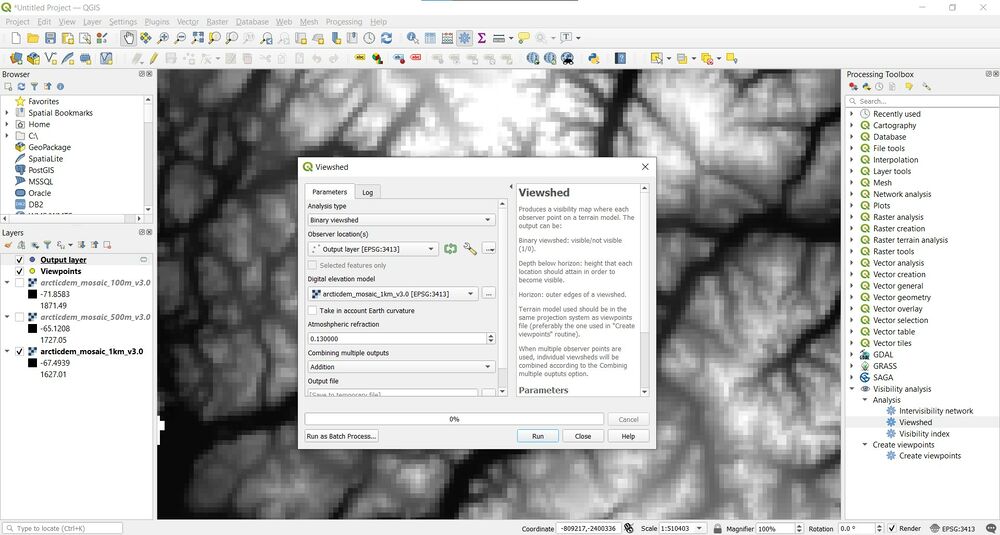
| + | Now, click on the down arrow next to “Analysis” and select the Viewshed tool. Another window will pop up. For Analysis type keep as binary viewshed, for Observer location use the Output file you just created, for Digital elevation model use the 1km DEM and then keep the rest of the options as is. Click OK to run the viewshed analysis. |
||
| + | |||
| + | |||
| + | [[File:Figure9MattNick.jpg|caption|border|1000px]] |
||
| + | |||
| + | '''Figure 10.''' Using the Viewshed tool. |
||
| + | |||
| + | |||
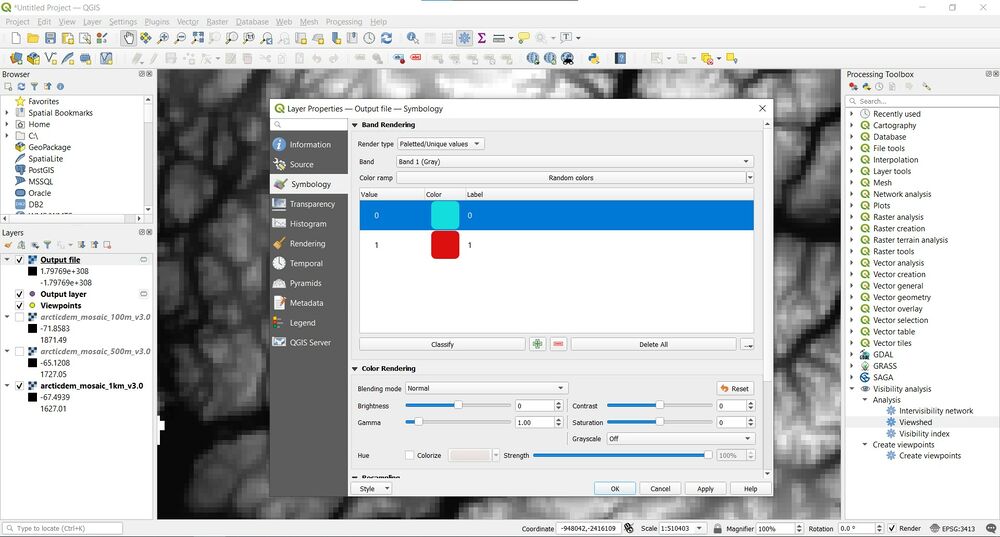
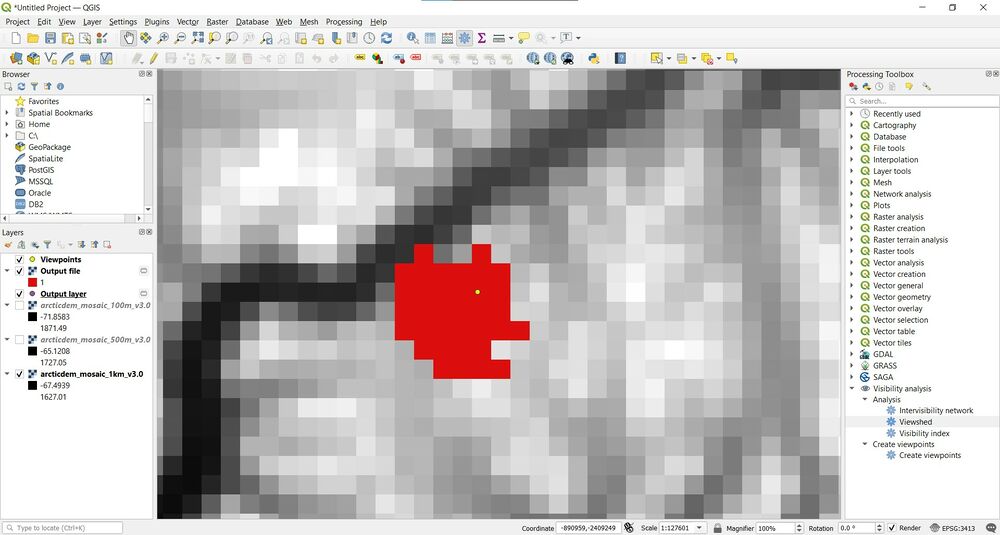
| + | The viewshed will first appear as a black circle. To fix this, right click on the Output file and click “Properties”. Change the render type to Palleted/unique values and then click the “Classify” button underneath the Band Rendering table. Select the 0 value in the table and then click the “—” button. Click OK. The visible part of the 1km DEM viewshed should now be visible. Repeat this process for the 500m and 100m DEMs and compare the results. |
||
| + | |||
| + | |||
| + | [[File:Figure10MattNick.jpg|caption|border|1000px]] |
||
| + | |||
| + | '''Figure 11.''' Inside the layer properties for the viewshed output file. Click the “—” button to delete the 0 value. |
||
| + | |||
| + | |||
| + | [[File:Figure11MattNick.jpg|caption|border|1000px]] |
||
| + | |||
| + | '''Figure 12.''' The 1km resolution DEM viewshed result. Keep in mind that each square pixel is 1km in length and width. |
||
| + | |||
| + | After completing the viewshed analysis, please consider the following questions as a reflective exercise: |
||
| + | |||
| + | After comparing all 3 DEM results to each other, consider the proposed platform placement. Would it be better idea to propose a different platform location to TN where hikers could see more based on your results? Also, which DEM served to provide the best/worst viewshed results? Which DEM would you prefer to use if you had to conduct another viewshed analysis elsewhere? |
||
| + | |||
| + | =='''Conclusion'''== |
||
| + | |||
| + | In summary, the viewshed analysis tool offered in the Visibility Analysis plugin for QGIS Desktop is a powerful and user friendly tool for users of all skill levels. By completing this tutorial, the user should now have a concrete understanding of the function and capabilities that the visibility analysis tool offers, and how it enables them to create a viewshed. By providing the user with a mock scenario it allows them to see how the tool can be used in a real world setting, thus reinforcing the knowledge obtained. |
||
Latest revision as of 17:49, 22 December 2020
Contents
Introduction
Viewshed Tool
The viewshed analysis is a powerful process which allows users to "know how visible objects might be—for example, from which locations on the landscape will the water towers be visible if they are placed in a particular location," (ArcGis 2020). For this particular tutorial, the Viewshed analysis will be conducted using Quantum GIS (QGIS). QGIS is a powerful open source software that is available to all users. There is no built-in viewshed analysis tool for QGIS, so the user is required to install an open source plugin through the plugin function.
Installation of the Visibility Analysis Plugin in QGIS
Process
Before conducting the Viewshed analysis in QGIS the user will need to install the "Visibility Analysis" plugin by:
1) Opening QGIS Desktop.
2) Select the "Plugins" menu in the toolbar at the top of the screen.
3) Select "manage/install plugins", this will bring the user to a window where the user can search the "Visibility Analysis" tool.
4) Once the tool has been selected, the user will proceed to install the plugin.
5) From here the user will now have access to the plugin through the Processing Toolbox.
Objective
The objective of this tutorial is to help the user understand the function that spatial resolution has on a raster data set. Spatial resolution refers to the number of pixels that are used when constructing a digital image, such as a digital elevation model (DEM). Images that have a higher resolution have a greater number of pixels in the image than images with a lower resolution. The spatial resolution that one should use for geo-spatial analysis depends on the level of detail required to complete a project.
In the Process section of this tutorial, the user will install the "Visibility Analysis" plugin in QGIS and then proceed to create three viewsheds over three DEMs of differing resoltuion available in the Data section. The analysis will be facilitated by a realistic mock scenario to get users to compare the results of the viewshed between the different resolution DEMs.
Mock Scenario
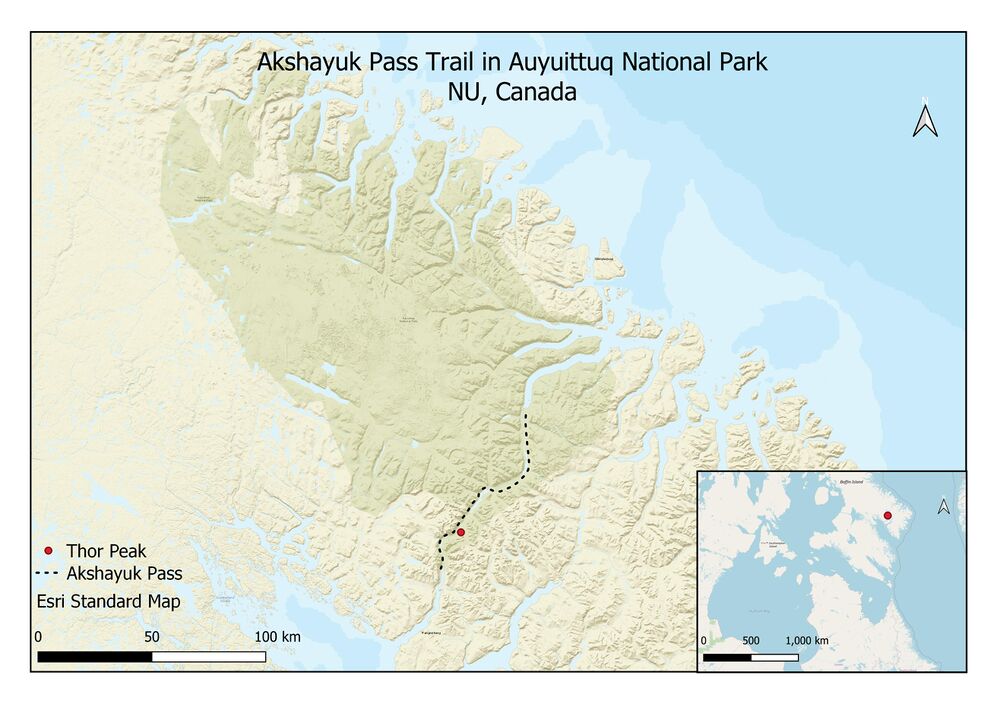
You are a contractor Geomatic Analyst recently approached by Travel Nunavut (TN), a not-for-profit tourism agency with the intention of attracting tourists to historic and areas on Baffin Island. TN has proposed to you that they would like to erect a 5m tall viewing platform on top of Thor Peak (coordinates: 66.53337036222605, -65.31670300114362, or: 66°32'00.1"N 65°19'00.1"W) in the Akshayuk Pass, a hiking trail in Auyuittuq National Park. TN has contacted you because they would like you to create a model to show them what the visitors would be able to see from that spot and height. You have managed to find a public online source offering DEMs of the area differing resolutions and now need to determine which is the best to use to conduct a viewshed analysis and present TN with the data.
Figure 1. The locations of Akshayuk Pass and Thor Peak in Auyuittuq National Park, Nunavut, Canada.
Data
Digital elevation models (DEMs) will be downloaded and used to conduct a viewshed analysis and are a form of raster data (comprised of a grid of pixels). The DEMs will be in a Tagged File Format that has the file extension “.tif”.
The data can be downloaded from the University of Minnesota’s ArcticDEM datasets from the following link:
https://www.pgc.umn.edu/data/arcticdem/
Click on the “Browse server” button and then click on the “mosaic” folder, then the “v3.0/” folder, and finally download the 100 metre, 500 metre, and 1-kilometre resolution DEMs. Depending on internet speed, the downloads might take considerable time to download. Once downloaded, extract the zipped files into a drive of your choice.
Process
NOTE: This process was conducted using the most recent version of QGIS at the time of writing this tutorial: QGIS Desktop 3.16.
Ensure that QGIS is downloaded and functions properly on your computer. Click here to download the latest version of QGIS.
Download the data from the previous section before starting the tutorial.
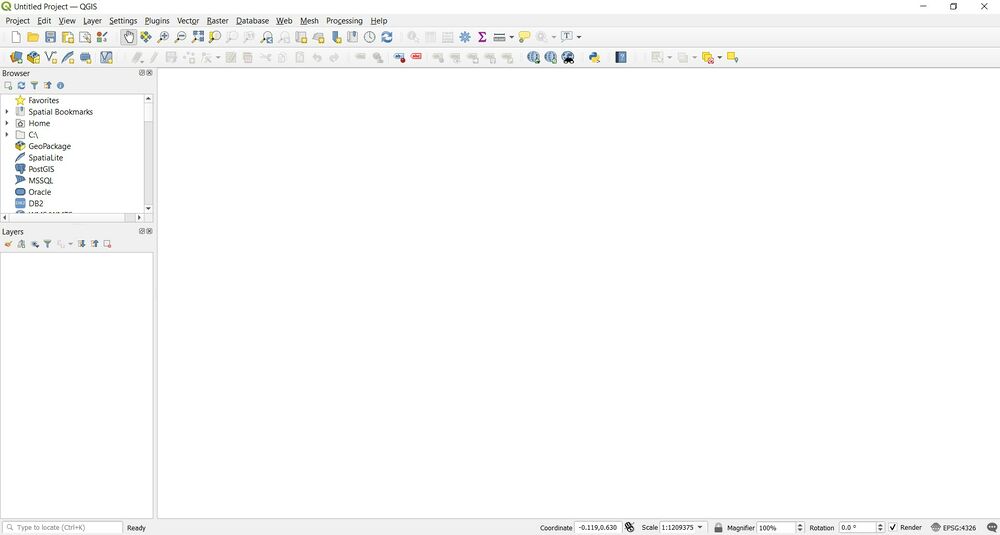
Open QGIS Desktop and start an empty new project.
Figure 2. Open an empty new project and give it a name.
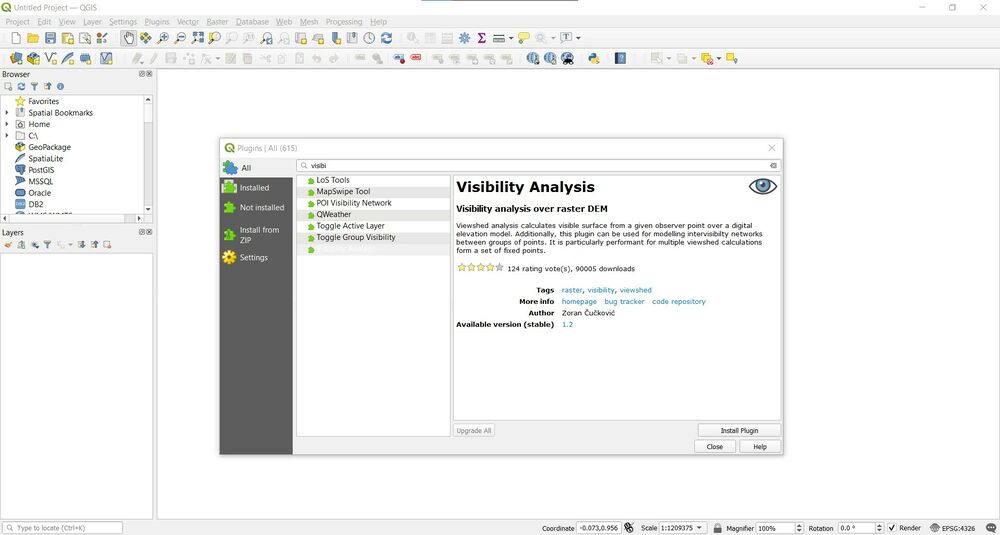
Navigate to the “Plugins” menu on the top toolbar in QGIS. Click “Manage and Install Plugins…” and after QGIS fetches the repositories, click on the search bar and type in “Visibility Analysis”. Once the plugin shows, click on Install in the bottom right corner of the window.
Figure 3. Installing the Visibility Analysis Plugin.
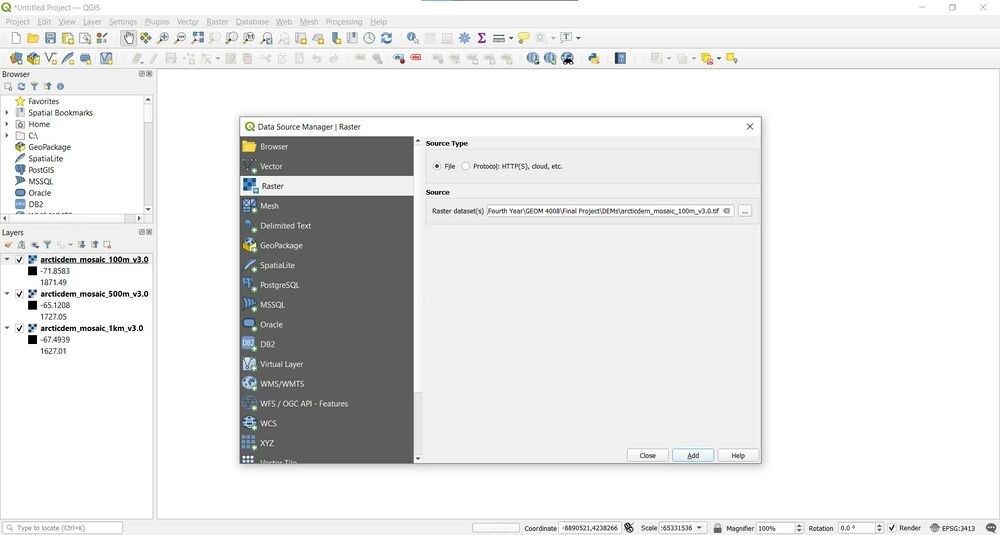
Next, navigate to “Layer” on the Menu Toolbar, and then click on “Add Layer”, then “add a raster layer”. Click on the “…” browse button and locate the folder where you stored the unzipped 100m DEM. Click on Add to import a single DEM at a time. Repeat these steps to add the 500m and 1km DEMs.
Figure 4. Adding the DEMs into the empty project.
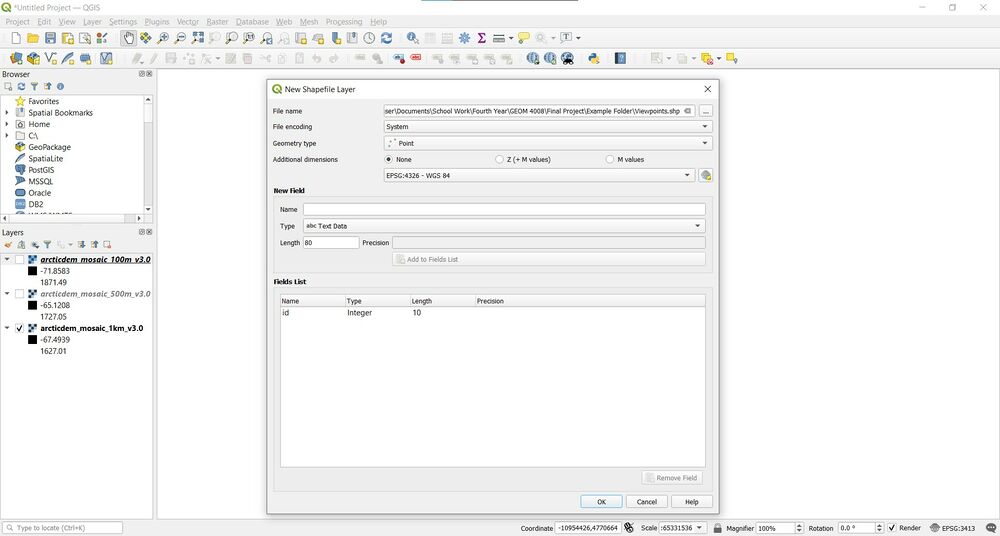
Once the DEMs have been imported into QGIS, it is time to create a new shapefile (.shp) for the viewpoints. Viewpoints will be used in by the Visibility Analysis to create a viewshed. Start by clicking on Layer > Create Layer > New shapefile Layer… and then title the shapefile “Viewpoints” and select a location to save the file using the “…” browse button. Change the geometry type to be Point and leave the rest of the settings as is. Then, click OK to create the new shapefile.
Figure 5. Creating a new “Viewpoints” shapefile.
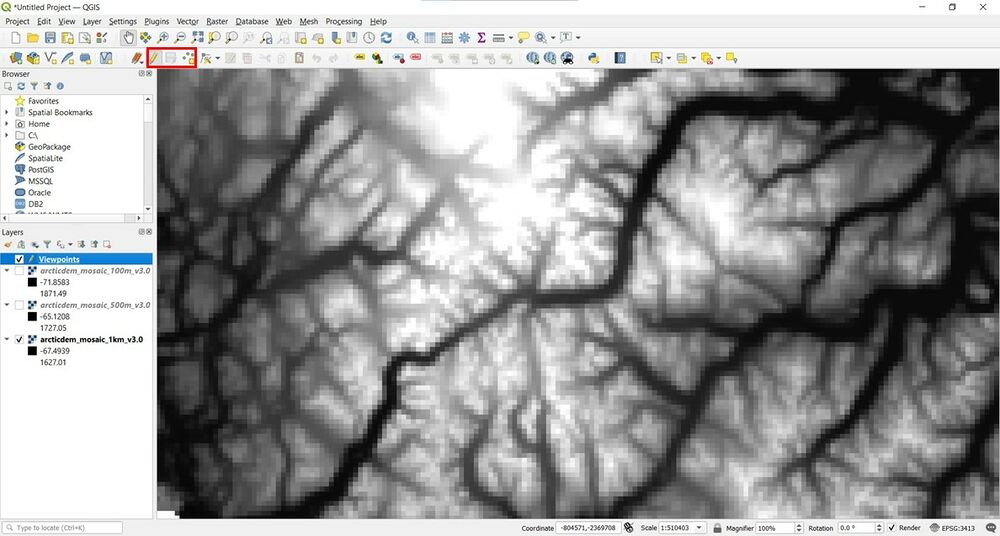
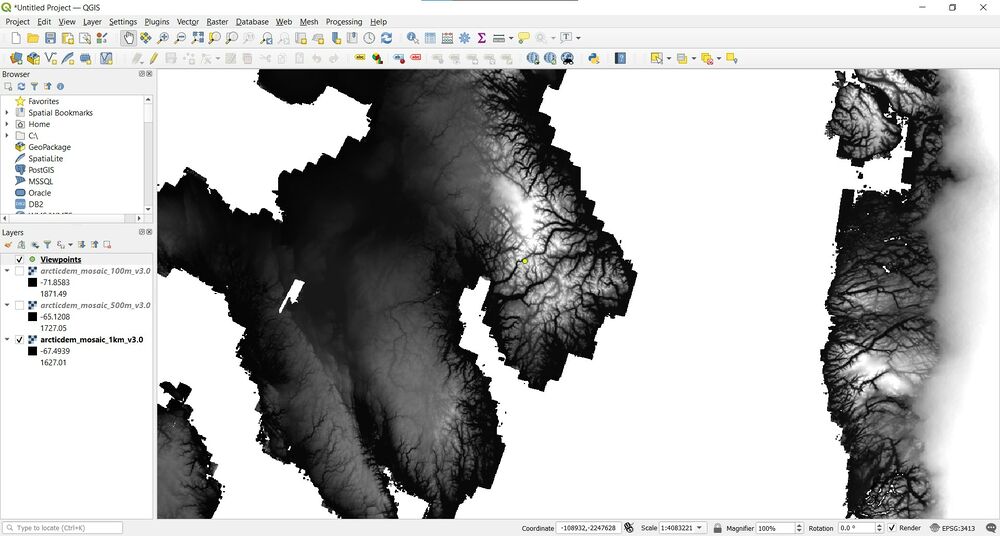
Start by creating a viewshed on the 1km DEM. In the Layers Panel on the left side of QGIS, only have the 1km DEM selected “on”, which will appear as having a checkmark by the layer’s name. Then, start an editing session by clicking on the pencil-looking icon on the Selection Toolbar. Use the wheel of your mouse to pan into Auyuittuq National Park. For reference, view the map provided in the Mock Scenario section. Then, click the “Add Point Feature” and place a point at the relative location of Thor Peak. A “Viewpoints-Feature Attributes” window will pop up, click OK. Finally, click on the “Save Layer Edits” button in the Selection Toolbar. This will stop the editing session for the Viewpoints shapefile layer.
Figure 6. The location of the Toggle Editing, Add Point Feature, and Save Layer Edits on the Selection Toolbar.
Figure 7. The point of the Viewpoints shapefile representing the relative location of Thor Peak in Auyuittuq National Park on Baffin Island.
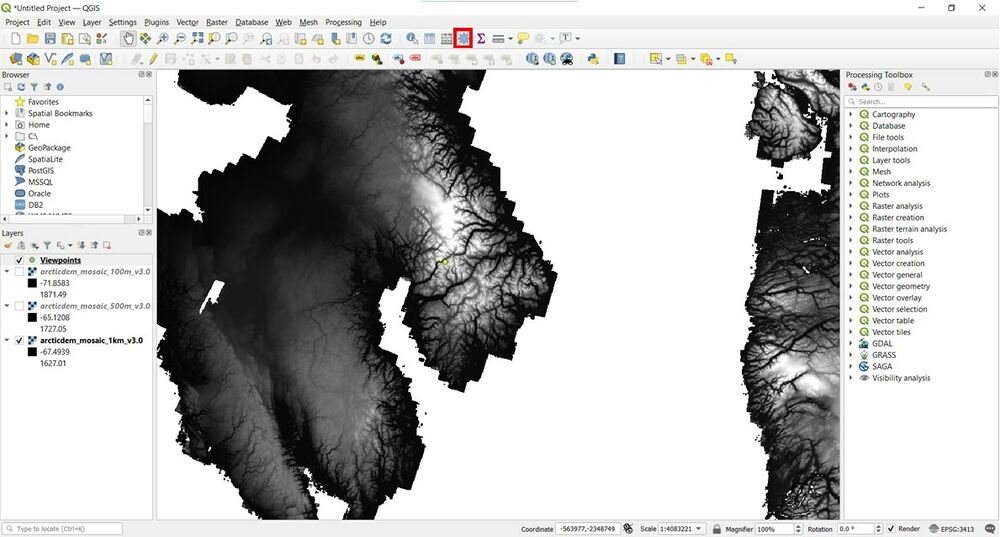
Now open the Processing Toolbox. The icon is a small gear on the Attribute Toolbar.
Figure 8. The location of the Processing Toolbox on the Attributes Toolbar.
In the Processing Toolbox, click on the arrow next to the Visibility Analysis tool to expand the menu options. Then, click on the arrow next to “Create viewpoints” and select the Create viewpoints tool. A window will pop up. For Observer locations use the Viewpoints layer you created earlier, for the Digital elevation model select the 1km DEM, for Radius of analysis enter 5000m, and for the Observer height enter 5m to emulate the viewing platform that TN wants to build at the top of Thor Peak. Click OK and it will create an Output layer.
Figure 9. Using the Create viewpoints tool.
Now, click on the down arrow next to “Analysis” and select the Viewshed tool. Another window will pop up. For Analysis type keep as binary viewshed, for Observer location use the Output file you just created, for Digital elevation model use the 1km DEM and then keep the rest of the options as is. Click OK to run the viewshed analysis.
Figure 10. Using the Viewshed tool.
The viewshed will first appear as a black circle. To fix this, right click on the Output file and click “Properties”. Change the render type to Palleted/unique values and then click the “Classify” button underneath the Band Rendering table. Select the 0 value in the table and then click the “—” button. Click OK. The visible part of the 1km DEM viewshed should now be visible. Repeat this process for the 500m and 100m DEMs and compare the results.
Figure 11. Inside the layer properties for the viewshed output file. Click the “—” button to delete the 0 value.
Figure 12. The 1km resolution DEM viewshed result. Keep in mind that each square pixel is 1km in length and width.
After completing the viewshed analysis, please consider the following questions as a reflective exercise:
After comparing all 3 DEM results to each other, consider the proposed platform placement. Would it be better idea to propose a different platform location to TN where hikers could see more based on your results? Also, which DEM served to provide the best/worst viewshed results? Which DEM would you prefer to use if you had to conduct another viewshed analysis elsewhere?
Conclusion
In summary, the viewshed analysis tool offered in the Visibility Analysis plugin for QGIS Desktop is a powerful and user friendly tool for users of all skill levels. By completing this tutorial, the user should now have a concrete understanding of the function and capabilities that the visibility analysis tool offers, and how it enables them to create a viewshed. By providing the user with a mock scenario it allows them to see how the tool can be used in a real world setting, thus reinforcing the knowledge obtained.

