Difference between revisions of "Noise Modelling using OpeNoise in QGIS"
m |
|||
| (102 intermediate revisions by 3 users not shown) | |||
| Line 3: | Line 3: | ||
===Purpose=== |
===Purpose=== |
||
| − | The objective of this tutorial is to help the user visualize the impact of sound and how it propagates from a location. The user will do this using the |
+ | The objective of this tutorial is to help the user visualize the impact of sound and how it propagates from a location. The user will do this using the “OpeNoise Map” version 2.2 Plugin in QGIS and create a noise map assessing the exposure to noise in a given area, due to the existence of different sources of noise. For this tutorial, the noise to be modelled is the impact of Formula 1 race cars at Baku City Circuit, Azerbaijan. It will then go to show the different variations and higher level details the the tool can use. |
| − | ===Accessing |
+ | ===Accessing OpeNoise Map Plugin in QGIS=== |
| − | To complete this tutorial the user will need to install QGIS and the |
+ | To complete this tutorial the user will need to install QGIS and the OpeNoise Map plugin: |
| − | 1) Install |
+ | 1) Install [https://qgis.org/en/site/forusers/download.html QGIS] 3.34 and open QGIS Desktop |
| + | 2) When you open QGiS you are greeted by Recent QGIS news and Project templates. To begin select "New Empty Project" |
||
| − | 2) Click "Plugins" on the ribbon at the top of the screen, then click "Manage/install plugins" |
||
| + | |||
| + | [[File:Qgishome.png|left|thumb]] |
||
| + | |||
| + | |||
| + | |||
| + | |||
| + | |||
| + | |||
| + | |||
| + | |||
| + | |||
| + | |||
| + | |||
| + | |||
| + | |||
| + | |||
| + | |||
| + | |||
| + | |||
| + | |||
| + | |||
| + | |||
| + | |||
| + | |||
| + | |||
| + | |||
| + | |||
| + | |||
| + | |||
| + | |||
| + | |||
| + | |||
| + | 2) select "Plugins" on the ribbon at the top of the screen, then select "Manage/install plugins" |
||
[[File:Qgisribbon.png|frame|left|200px]] |
[[File:Qgisribbon.png|frame|left|200px]] |
||
| Line 23: | Line 56: | ||
| − | 3) Search for |
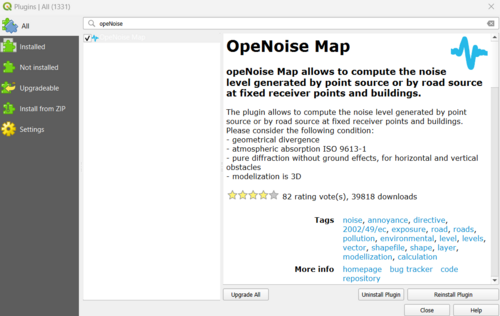
+ | 3) Search for "OpeNoise" Map and select "Install Plugin". The user can then access OpeNoise Map by slecting on the "Plugins" option on the ribbon. |
| + | |||
| + | [[File:opeNoise_plug.png|border|500px]] |
||
| + | |||
| + | =='''Setting Coordinate Reference System(CRS)'''== |
||
| + | |||
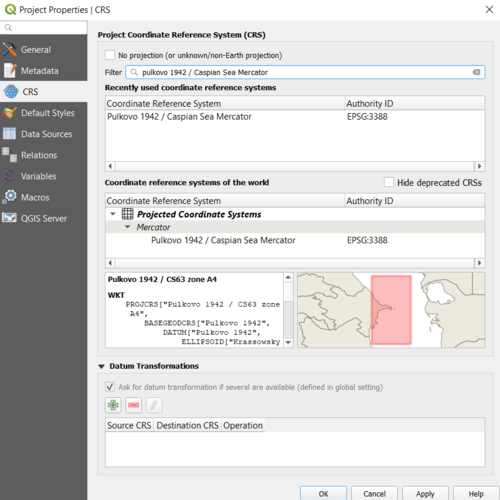
| + | Before importing the required shapefile into QGIS, you must set a project coordinate system for your project file. Due to the study area being near the Caspian Sea we can use the "Pulkovo 1942/ Caspian Sea Mercator" projection to ensure accuracy in our analysis. |
||
| + | |||
| + | To change the projection in QGIS: press ctrl+ shift + p and select CRS. In the search bar type "Pulkovo 1942/ Caspian Sea Mercator" and select apply at the bottom of the screen. |
||
| + | |||
| + | [[File:Projectionmenu.png|border|500px|left]] |
||
| + | |||
| + | |||
| + | |||
| + | |||
| + | |||
| + | |||
| + | |||
| + | |||
| + | |||
| + | |||
| + | |||
| + | |||
| + | |||
| + | |||
| + | |||
| + | |||
| + | |||
| + | |||
| + | |||
| + | |||
| + | |||
| + | |||
| + | |||
| + | |||
| + | |||
| + | |||
| + | |||
| + | |||
| + | |||
| + | |||
| + | |||
| + | |||
| + | |||
| + | |||
| + | |||
| + | |||
| + | |||
| + | |||
| + | |||
| + | |||
| + | |||
| + | |||
| + | =='''Data'''== |
||
| + | |||
| + | All data used for this tutorial is open source and shapefiles can be acquired at: |
||
| + | |||
| + | [https://drive.google.com/file/d/18GSOqRNrb7bSErTRVUOCzwFw-7hJ0E1q/view Baku City Street Circut] and [https://mapcruzin.com/free-azerbaijan-country-city-place-gis-shapefiles.htm Baku Downtown Buildings] |
||
| + | |||
| + | Download and Extract the contents of both flies |
||
| + | |||
| + | ===Adding Layers in QGIS=== |
||
| + | |||
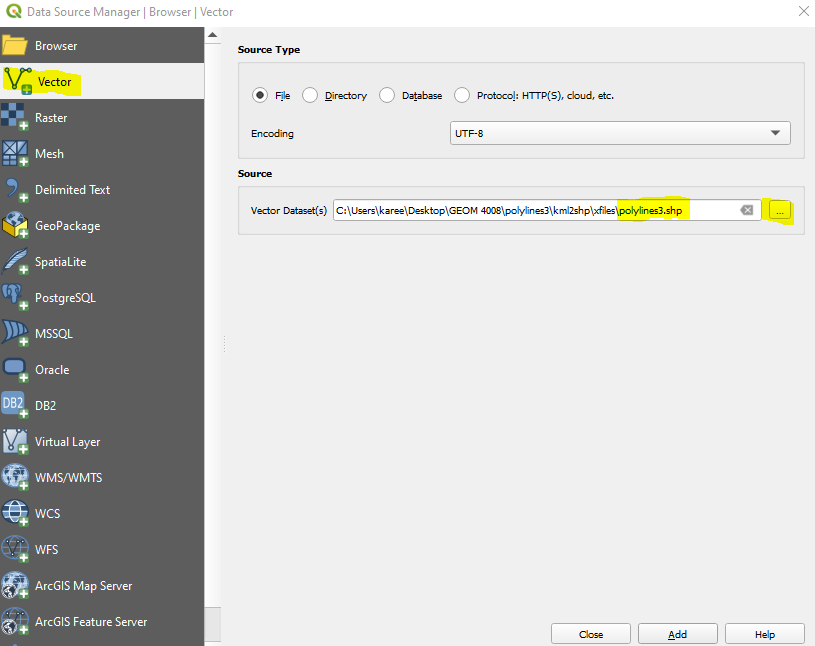
| + | 1) Press Ctrl + L to open the Data Source Manager in QGIS |
||
| + | |||
| + | 2) Press on "Vector" in the list of options on the left side, under "source" like the three dots and add the files you downloads that end with .shp - then select "Add" |
||
| + | |||
| + | [[File:DSM.png|500px|frame|left]] |
||
| + | |||
| + | |||
| + | |||
| + | |||
| + | |||
| + | |||
| + | |||
| + | |||
| + | |||
| + | |||
| + | |||
| + | |||
| + | |||
| + | |||
| + | |||
| + | |||
| + | |||
| + | |||
| + | |||
| + | |||
| + | |||
| + | |||
| + | |||
| + | |||
| + | |||
| + | |||
| + | |||
| + | |||
| + | |||
| + | |||
| + | |||
| + | |||
| + | |||
| + | |||
| + | |||
| + | |||
| + | |||
| + | |||
| + | |||
| + | |||
| + | |||
| + | |||
| + | |||
| + | |||
| + | |||
| + | |||
| + | |||
| + | |||
| + | |||
| + | |||
| + | |||
| + | |||
| + | |||
| + | |||
| + | |||
| + | |||
| + | |||
| + | |||
| + | Once you have added both files we need to extract the Baku Circut from the "polylines3" layer |
||
| + | |||
| + | 1) Right Click on the layer and select the attribute table |
||
| + | |||
| + | 2) Under the column "NAME" find "nal Circuit", left click the number in the farthest left column so the row is highlighted blue |
||
| + | [[File:Attributetbl.png|300px|frame|left]] |
||
| + | |||
| + | |||
| + | |||
| + | |||
| + | |||
| + | |||
| + | |||
| + | |||
| + | |||
| + | |||
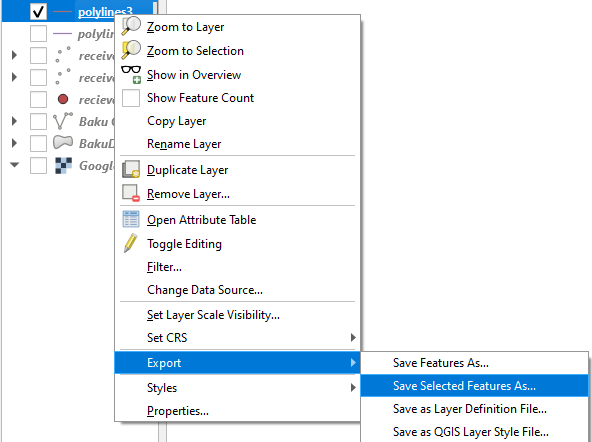
| + | 3) Close the attribute table and return to the project page, right click on polyines3 > hover over "Export" > then select "Save Selected Feature as" |
||
| + | |||
| + | |||
| + | [[File:export.png|200px|frame|left]] |
||
| + | |||
| + | |||
| + | |||
| + | |||
| + | |||
| + | |||
| + | |||
| + | |||
| + | |||
| + | |||
| + | |||
| + | |||
| + | |||
| + | |||
| + | |||
| + | |||
| + | |||
| + | |||
| + | |||
| + | |||
| + | |||
| + | |||
| + | |||
| + | |||
| + | |||
| + | |||
| + | |||
| + | |||
| + | |||
| + | |||
| + | |||
| + | |||
| + | |||
| + | |||
| + | |||
| + | |||
| + | |||
| + | |||
| + | |||
| + | |||
| + | |||
| + | 4) In the popup box save set the file name as "Baku Street Circut", change the CRS to the Pulkovo 1942/ Caspian Sea Mercator from previous and select OK |
||
| + | |||
| + | [[File:Newlayer.png|200px|frame|left]] |
||
| + | |||
| + | |||
| + | |||
| + | |||
| + | |||
| + | |||
| + | |||
| + | |||
| + | |||
| + | |||
| + | |||
| + | |||
| + | |||
| + | |||
| + | |||
| + | |||
| + | |||
| + | |||
| + | |||
| + | |||
| + | |||
| + | |||
| + | |||
| + | |||
| + | |||
| + | |||
| + | |||
| + | |||
| + | |||
| + | |||
| + | |||
| + | |||
| + | |||
| + | |||
| + | |||
| + | |||
| + | |||
| + | |||
| + | |||
| + | |||
| + | |||
| + | |||
| + | |||
| + | |||
| + | |||
| + | |||
| + | |||
| + | |||
| + | |||
| + | |||
| + | |||
| + | |||
| + | |||
| + | |||
| + | |||
| + | |||
| + | |||
| + | ===Editing Attribute Tables=== |
||
| + | |||
| + | The user needs to add a decibel level to the Baku circuit layer for analysis |
||
| + | |||
| + | 1) Open the attribute table again, in the ribbon at the top select the "Toggle Editing Mode" to enable editing (First button from the left) |
||
| + | |||
| + | 2) Then, in the ribbon at the top select "Add new field" (Sixth button from the right) |
||
| + | |||
| + | 3) Name the new field "Db", make the Type and Integer and in the "Length" section enter the value "3" and select OK |
||
| + | |||
| + | |||
| + | [[File:Newfield.png|200px|frame|left]] |
||
| + | |||
| + | |||
| + | |||
| + | |||
| + | |||
| + | |||
| + | |||
| + | |||
| + | |||
| + | |||
| + | |||
| + | |||
| + | |||
| + | |||
| + | |||
| + | |||
| + | |||
| + | |||
| + | |||
| + | |||
| + | |||
| + | |||
| + | |||
| + | |||
| + | |||
| + | |||
| + | |||
| + | 4) Under the newly created "Db" column enter the value "134" - this is the value for the decibel level of this track |
||
| + | |||
| + | 5) Save your changes by pressing the "Save Edits" in the top ribbon (Third button from the left) |
||
| + | |||
| + | 6) Press the "Toggle Editing Mode" again to disable editing mode |
||
| + | |||
| + | |||
| + | |||
| + | |||
| + | =='''Using OpeNoise Map with Roads'''== |
||
| + | |||
| + | ===Create Receiver Points=== |
||
| + | |||
| + | 1) To begin left click on the plugins from the ribbon and hover over OpeNoise Map. When the menu appears select on "Create Receiver or Grid Points" and select the "Receiver Points" tab. In the box that appears make sure that the "Building layer(input polygon layer)" dropdown box has the "BakuDowntownBuildings" shapefile as selected. In the "receiver layer" select browse and name the new shapefile "receiverpoints". |
||
| + | [[File:selecting_receiver.png|300px|frame|left]] |
||
| + | [[File:receiver_points_page.png|500px|frame|left]] |
||
| + | |||
| + | |||
| + | |||
| + | |||
| + | |||
| + | |||
| + | |||
| + | |||
| + | |||
| + | |||
| + | |||
| + | |||
| + | |||
| + | |||
| + | |||
| + | |||
| + | |||
| + | |||
| + | |||
| + | |||
| + | |||
| + | |||
| + | |||
| + | |||
| + | |||
| + | |||
| + | |||
| + | |||
| + | |||
| + | |||
| + | |||
| + | |||
| + | |||
| + | |||
| + | |||
| + | |||
| + | |||
| + | |||
| + | |||
| + | |||
| + | |||
| + | |||
| + | |||
| + | |||
| + | |||
| + | |||
| + | |||
| + | |||
| + | |||
| + | |||
| + | |||
| + | |||
| + | |||
| + | |||
| + | |||
| + | |||
| + | |||
| + | |||
| + | |||
| + | |||
| + | |||
| + | |||
| + | |||
| + | |||
| + | |||
| + | |||
| + | |||
| + | |||
| + | |||
| + | |||
| + | |||
| + | |||
| + | |||
| + | |||
| + | |||
| + | |||
| + | |||
| + | |||
| + | |||
| + | *Select "Ok"- the program will run and new points will populate facades of all the building shapefiles. |
||
| + | |||
| + | [[File:Newpoints.png|frame|left]] |
||
| + | |||
| + | |||
| + | |||
| + | |||
| + | |||
| + | |||
| + | |||
| + | |||
| + | |||
| + | |||
| + | |||
| + | |||
| + | |||
| + | |||
| + | |||
| + | |||
| + | |||
| + | |||
| + | |||
| + | |||
| + | |||
| + | |||
| + | |||
| + | |||
| + | |||
| + | |||
| + | |||
| + | |||
| + | |||
| + | |||
| + | |||
| + | |||
| + | |||
| + | |||
| + | |||
| + | |||
| + | |||
| + | ===Create Grid Points=== |
||
| + | |||
| + | 1) Open the plugging options again and select "Create Receiver or Grid Points", then select the Grid Points tab |
||
| + | |||
| + | 2) Set the "Receiver Points Spacing [m]" to 1 |
||
| + | |||
| + | 3) Set the "Extension Layer" to the buildings layer |
||
| + | |||
| + | 4) Name the file "Baku Grid Points", then select OK |
||
| + | [[File:Gridpoints.png|500px|frame|left]] |
||
| + | [[File:Gridpointsmap.png|500px|frame|left]] |
||
| + | |||
| + | |||
| + | |||
| + | |||
| + | |||
| + | |||
| + | |||
| + | |||
| + | |||
| + | |||
| + | |||
| + | |||
| + | |||
| + | |||
| + | |||
| + | |||
| + | |||
| + | |||
| + | |||
| + | |||
| + | |||
| + | |||
| + | |||
| + | |||
| + | |||
| + | |||
| + | |||
| + | |||
| + | |||
| + | |||
| + | |||
| + | |||
| + | |||
| + | |||
| + | |||
| + | |||
| + | |||
| + | |||
| + | |||
| + | |||
| + | |||
| + | |||
| + | |||
| + | |||
| + | |||
| + | |||
| + | |||
| + | |||
| + | |||
| + | |||
| + | |||
| + | |||
| + | |||
| + | |||
| + | |||
| + | |||
| + | |||
| + | |||
| + | |||
| + | |||
| + | |||
| + | ===Calculate Noise Levels=== |
||
| + | |||
| + | *For this Tutorial, a decibel level of 134 was chosen in accordance with the available [https://www.miamidade.gov/auditor/library/formula-1-race-hosting-report.pdf literature] on noise pollution of Formula 1 racecars. This value is given to the whole track and does not account for slow areas(corners) of the track where the decibel level would be decreased due to braking. |
||
| + | |||
| + | 1) Return to the OpeNoise Map dropdown window and select " Calculate Noise Levels" |
||
| + | |||
| + | 2) Select the input tab- under "RECEIVERS" the point layer we created early should be selected. |
||
| + | |||
| + | 3) Check the "BUILDINGS" box and select "BakuDownTownBuildings" |
||
| + | |||
| + | 4) Under "Sources" select the roads check box and choose "Baku City Circut" |
||
| + | [[File:Inputs2.png|500px|left]] |
||
| + | |||
| + | |||
| + | |||
| + | |||
| + | |||
| + | |||
| + | |||
| + | |||
| + | |||
| + | |||
| + | |||
| + | |||
| + | |||
| + | |||
| + | |||
| + | |||
| + | |||
| + | |||
| + | |||
| + | |||
| + | |||
| + | |||
| + | |||
| + | |||
| + | |||
| + | |||
| + | |||
| + | |||
| + | |||
| + | |||
| + | |||
| + | |||
| + | |||
| + | 4) Select the "Details" button next to the Baku City Circut layer, in the top left select "NMPB(emission)", for data type check the "Generic" box |
||
| + | [[File:Power.png|500px|frame|left]] |
||
| + | |||
| + | |||
| + | |||
| + | |||
| + | |||
| + | |||
| + | |||
| + | |||
| + | |||
| + | |||
| + | |||
| + | |||
| + | |||
| + | |||
| + | |||
| + | |||
| + | |||
| + | |||
| + | |||
| + | |||
| + | |||
| + | 5) In the first dropdown window below generic select the Sound Emission level - dB(A)- as the "Db" field layer and select OK |
||
| + | |||
| + | 6) In the Parameters tab, under research ray(m) choose 1000 |
||
| + | |||
| + | According to [https://www.timeanddate.com/weather/azerbaijan/baku/historic?month=4&year=2019 weather] on race day for "atmospheric Absorption" change temperature(C) to 20 and Relative Humdity(RH%) to 70 |
||
| + | |||
| + | The Lden definition does not need to be set as the plugin automatically calculates the value based on the regulations of each Country |
||
| + | |||
| + | [[File:Parameters.png|500px|frame|left]] |
||
| + | |||
| + | |||
| + | |||
| + | |||
| + | |||
| + | |||
| + | |||
| + | |||
| + | |||
| + | |||
| + | |||
| + | |||
| + | |||
| + | |||
| + | |||
| + | |||
| + | |||
| + | |||
| + | |||
| + | |||
| + | |||
| + | |||
| + | |||
| + | |||
| + | |||
| + | 7) Go to the Calculate tab and select the calculate button this process may take between 1 and 2 hours depending on the users computing power |
||
| + | |||
| + | *Result of Calculate Noise Levels assigns decibel values up to 1000 m from the sound source. Points beyond 1000m are gray and assigned "no level" |
||
| + | [[File:Noiselevel-assigned.png|300px|frame|left]] |
||
| + | |||
| + | |||
| + | |||
| + | |||
| + | |||
| + | |||
| + | |||
| + | |||
| + | |||
| + | |||
| + | |||
| + | |||
| + | |||
| + | |||
| + | |||
| + | |||
| + | |||
| + | |||
| + | |||
| + | |||
| + | |||
| + | |||
| + | |||
| + | |||
| + | |||
| + | |||
| + | |||
| + | |||
| + | |||
| + | |||
| + | |||
| + | |||
| + | |||
| + | |||
| + | |||
| + | |||
| + | |||
| + | |||
| + | |||
| + | |||
| + | |||
| + | |||
| + | |||
| + | |||
| + | |||
| + | |||
| + | |||
| + | |||
| + | |||
| + | |||
| + | |||
| + | |||
| + | |||
| + | |||
| + | |||
| + | |||
| + | |||
| + | |||
| + | |||
| + | |||
| + | |||
| + | |||
| + | |||
| + | |||
| + | |||
| + | |||
| + | |||
| + | |||
| + | ===Create Sound Level Contours=== |
||
| + | |||
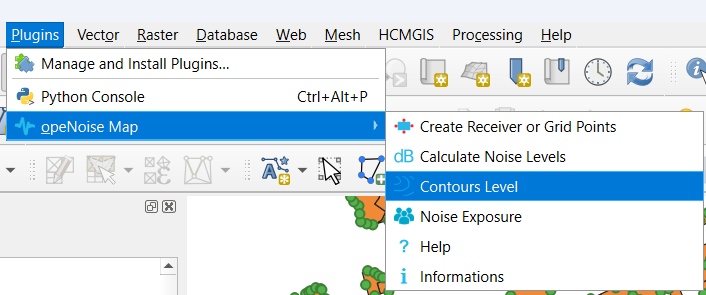
| + | 1) Return to the OpeNoise Map Plugin and select "Contours Level" |
||
| + | |||
| + | [[File:SelectingContours.png|300px|frame|left]] |
||
| + | |||
| + | |||
| + | |||
| + | |||
| + | |||
| + | |||
| + | |||
| + | |||
| + | |||
| + | |||
| + | |||
| + | |||
| + | |||
| + | |||
| + | |||
| + | |||
| + | |||
| + | |||
| + | |||
| + | |||
| + | |||
| + | |||
| + | |||
| + | |||
| + | |||
| + | |||
| + | |||
| + | |||
| + | |||
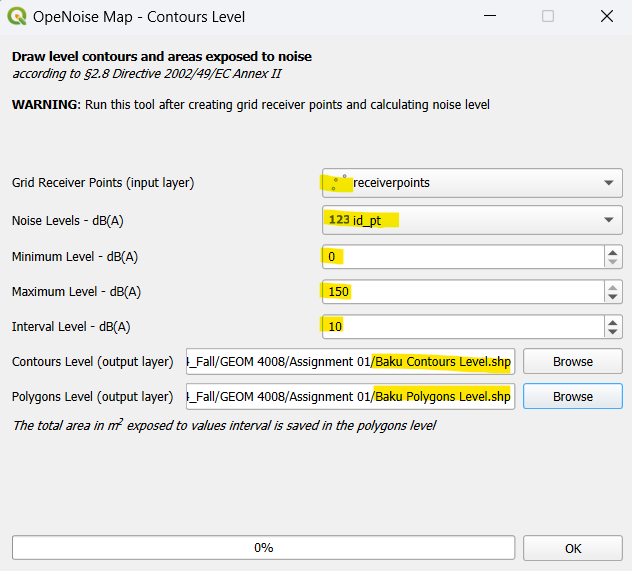
| + | 2) Make sure that the grid points is selected for the grid point layer |
||
| + | |||
| + | 3) Select the gird points field layer that contains the noise levels in dB |
||
| + | |||
| + | 4) Enter the minimum noise level value as 0 and the maximum as 150 and the interval as 10 |
||
| + | |||
| + | 5) Name the output layers as " Baku Contours Level" and "Baku Polygons Level", then select OK |
||
| + | |||
| + | [[File:ContourLevels.png|500px|frame|left]] |
||
| + | |||
| + | |||
| + | |||
| + | |||
| + | |||
| + | |||
| + | |||
| + | |||
| + | |||
| + | |||
| + | |||
| + | |||
| + | |||
| + | |||
| + | |||
| + | |||
| + | |||
| + | |||
| + | |||
| + | |||
| + | |||
| + | |||
| + | |||
| + | |||
| + | |||
| + | |||
| + | |||
| + | |||
| + | |||
| + | |||
| + | |||
| + | |||
| + | |||
| + | |||
| + | |||
| + | |||
| + | |||
| + | |||
| + | |||
| + | |||
| + | |||
| + | |||
| + | |||
| + | |||
| + | |||
| + | |||
| + | |||
| + | |||
| + | |||
| + | |||
| + | |||
| + | * The contour layers based on decibel values has now been created, you can change the symbology colors as you choose |
||
| + | [[File:ContourMap.png|500px|frame|left]] |
||
| + | |||
| + | |||
| + | |||
| + | |||
| + | |||
| + | |||
| + | |||
| + | |||
| + | |||
| + | ===Create Noise Exposure=== |
||
| + | This feature will assign dwellings and people living in them to receiver points. Then based on calculations will evaluate the harmful effect of the noise. |
||
| + | |||
| + | *Before you can use this tool you need to make sure you have certain information in your Buildings layer |
||
| + | |||
| + | 1) Right Click on the building layer, and open the Attribute table, then enter the editing mode as before and creating new fields |
||
| + | |||
| + | 2) The first field will be named "People" and will be an integer field, you will populate it with the estimated number of people living in each building |
||
| + | |||
| + | 3) The second field will be named "Dwellings" and will be and integer field, you will it with the estimated number of dwellings for each building |
||
| + | |||
| + | 4) The third field will be named "Facade type Exposition" or just "Type" and this will be a string field, you will populate this field with either 1-single dwelling, 2-appartment building or 3-appartment building multi facade. |
||
| + | *You can find more info on those facade types in the info page for the plugin |
||
| + | |||
| + | *Now you can start using the Noise Exposure tool |
||
| + | |||
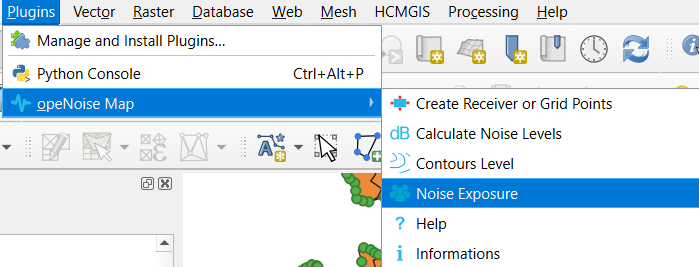
| + | 1) Return to the OpeNoise Map Plugin and select "Noise Exposure", you can ignore the warning message |
||
| + | |||
| + | [[File:SelectingExposure.png|300px|frame|left]] |
||
| + | |||
| + | |||
| + | |||
| + | |||
| + | |||
| + | |||
| + | |||
| + | |||
| + | |||
| + | |||
| + | |||
| + | |||
| + | |||
| + | |||
| + | |||
| + | |||
| + | |||
| + | |||
| + | |||
| + | |||
| + | |||
| + | |||
| + | |||
| + | |||
| + | |||
| + | |||
| + | |||
| + | |||
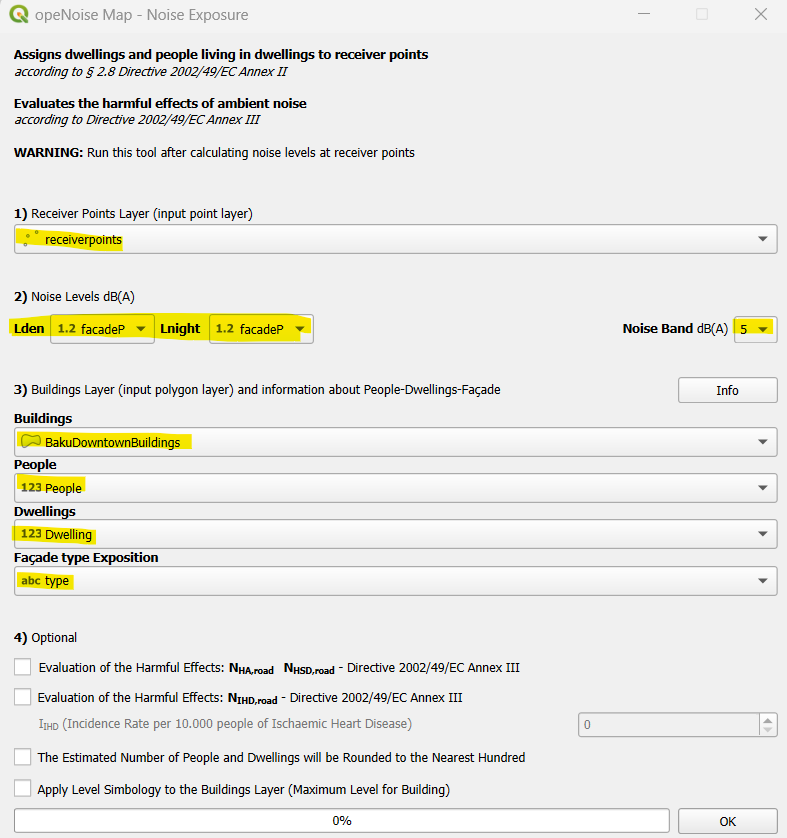
| + | 2) Make sure that the "Receiver Points Layer" is the receiver points that you created |
||
| + | |||
| + | 3) Set the "Lden" and "Lnight" to the receiver field layer with the noise level and set "Noise Band" to 5 |
||
| + | |||
| + | 4) Make sure that the "Buildings" is set to your BakuDownTownBuildings, the "People" to the field you created do the same for "Dwellings" and "Facade type Exposition", then select OK |
||
| + | |||
| + | [[File:NoiseExposure.png|400px|frame|left]] |
||
| + | |||
| + | |||
| + | |||
| + | |||
| + | |||
| + | |||
| + | |||
| + | |||
| + | |||
| + | |||
| + | |||
| + | |||
| + | |||
| + | |||
| + | |||
| + | |||
| + | |||
| + | |||
| + | |||
| + | |||
| + | |||
| + | |||
| + | |||
| + | |||
| + | |||
| + | |||
| + | |||
| + | |||
| + | |||
| + | |||
| + | |||
| + | |||
| + | |||
| + | |||
| + | |||
| + | |||
| + | |||
| + | |||
| + | |||
| + | |||
| + | |||
| + | |||
| + | |||
| + | |||
| + | |||
| + | |||
| + | |||
| + | |||
| + | |||
| + | |||
| + | |||
| + | |||
| + | |||
| + | |||
| + | |||
| + | |||
| + | |||
| + | |||
| + | |||
| + | |||
| + | |||
| + | |||
| + | |||
| + | |||
| + | |||
| + | |||
| + | |||
| + | |||
| + | |||
| + | |||
| + | |||
| + | * You will now have 4 temporary layers in your map view; |
||
| + | |||
| + | - People Exposure - Lden |
||
| + | - People Exposure - Lnight |
||
| + | - Dwellings Exposure - Lden |
||
| + | - Dwellings Exposure - Lnight |
||
| + | |||
| + | |||
| + | [[File:NoiseExposureMap.png|500px|frame|left]] |
||
| + | |||
| + | |||
| + | |||
| + | |||
| + | |||
| + | |||
| + | |||
| + | =='''Variations'''== |
||
| + | |||
| + | There are many different variations and levels of detail that you can use with the opeNoise Map plugin tool. The above tutorial focused on the most basic options for noise coming from a road segment. I will now go through some of the other options. |
||
| + | |||
| + | ===Day/Night=== |
||
| + | In both the Points and Roads details you have four different options that you decide whether or not to use one, two, three or all four of those. You have the Generic option for one value depicting any time. Then you have Day, Evening and Night which represents those time periods. |
||
| + | |||
| + | ===Point or Points=== |
||
| + | You can use the same workflow as above the only difference would be when you are using "Calculate Noise Levels" instead of choosing roads you choose points. |
||
| + | You must have at least two fields in your points layer one for an id and the other for the decibel level. For an example the id could be the number of the race car and the decibel would the how loud the crash was. |
||
| + | |||
| + | The points details have two options to use, Overall dB and Octave Bands dB. The overall dB only asks you to provide one decibel value. The Octave Bands ask you to provide decibel values for each octave bands at certain hertz (Hz) values. |
||
| + | You are able to use both Points and Roads at the same time in your calculations if that is needed. |
||
| + | [[File:points_input.png|400px|frame|left]] |
||
| + | [[File:points_overall.png|400px|frame|left]] |
||
| + | [[File:points_octave.png|400px|frame|left]] |
||
| + | |||
| + | |||
| + | |||
| + | |||
| + | |||
| + | |||
| + | |||
| + | |||
| + | |||
| + | |||
| + | |||
| + | |||
| + | |||
| + | |||
| + | |||
| + | |||
| + | |||
| + | |||
| + | |||
| + | |||
| + | |||
| + | |||
| + | |||
| + | |||
| + | |||
| + | |||
| + | |||
| + | |||
| + | |||
| + | |||
| + | |||
| + | |||
| + | |||
| + | |||
| + | |||
| + | |||
| + | |||
| + | |||
| + | |||
| + | |||
| + | |||
| + | |||
| + | |||
| + | |||
| + | |||
| + | |||
| + | |||
| + | |||
| + | |||
| + | |||
| + | |||
| + | |||
| + | |||
| + | |||
| + | |||
| + | |||
| + | |||
| + | |||
| + | |||
| + | |||
| + | |||
| + | |||
| + | |||
| + | |||
| + | |||
| + | |||
| + | |||
| + | |||
| + | |||
| + | |||
| + | |||
| + | |||
| + | |||
| + | |||
| + | |||
| + | |||
| + | |||
| + | |||
| + | |||
| + | |||
| + | |||
| + | |||
| + | |||
| + | |||
| + | |||
| + | |||
| + | |||
| + | |||
| + | |||
| + | |||
| + | |||
| + | |||
| + | |||
| + | |||
| + | |||
| + | |||
| + | |||
| + | |||
| + | |||
| + | |||
| + | |||
| + | |||
| + | |||
| + | |||
| + | |||
| + | |||
| + | |||
| + | |||
| + | |||
| + | |||
| + | |||
| + | |||
| + | |||
| + | |||
| + | |||
| + | |||
| + | |||
| + | |||
| + | |||
| + | |||
| + | |||
| + | |||
| + | |||
| + | |||
| + | |||
| + | |||
| + | |||
| + | |||
| + | |||
| + | |||
| + | |||
| + | |||
| + | |||
| + | |||
| + | |||
| + | |||
| + | |||
| + | |||
| + | |||
| + | |||
| + | |||
| + | |||
| + | |||
| + | |||
| + | |||
| + | |||
| + | |||
| + | |||
| + | |||
| + | |||
| + | |||
| + | |||
| + | |||
| + | |||
| + | |||
| + | |||
| + | |||
| + | |||
| + | |||
| + | |||
| + | |||
| + | |||
| + | |||
| + | |||
| + | |||
| + | |||
| + | |||
| + | |||
| + | |||
| + | |||
| + | |||
| + | |||
| + | |||
| + | |||
| + | |||
| + | |||
| + | |||
| + | |||
| + | |||
| + | |||
| + | |||
| + | |||
| + | |||
| + | |||
| + | |||
| + | |||
| + | |||
| + | |||
| + | |||
| + | |||
| + | |||
| + | |||
| + | |||
| + | |||
| + | |||
| + | |||
| + | |||
| + | |||
| + | |||
| + | |||
| + | |||
| + | |||
| + | ===Traffic Flow=== |
||
| + | When using the Road option in the "Calculate Noise Levels" you have three different levels of detail that you can use. |
||
| + | |||
| + | 1)NMPB(Emission) - This only asks you for one decibel field for your layer that you are using. |
||
| + | |||
| + | 2)NMPB(Traffic Flow) - This asks you for information regarding the amount of weight and speeds of the light and heavy vehicles per hour passing by that segment of the road. It also incorporates the type of traffic it is, as well as road slope and surface. You can find more detailed explanation and references by pressing the info button on that page. |
||
| + | |||
| + | [[File:Traffic_1.png|400px|frame|left]] |
||
| + | |||
| + | |||
| + | |||
| + | |||
| + | |||
| + | |||
| + | |||
| + | |||
| + | |||
| + | |||
| + | |||
| + | |||
| + | |||
| + | |||
| + | |||
| + | |||
| + | |||
| + | |||
| + | |||
| + | |||
| + | |||
| + | |||
| + | |||
| + | |||
| + | |||
| + | |||
| + | |||
| + | |||
| + | |||
| + | |||
| + | |||
| + | |||
| + | |||
| + | |||
| + | |||
| + | |||
| + | |||
| + | |||
| + | |||
| + | |||
| + | |||
| + | |||
| + | |||
| + | |||
| + | |||
| + | |||
| + | |||
| + | |||
| + | |||
| + | |||
| + | |||
| + | |||
| + | |||
| + | |||
| + | |||
| + | |||
| + | |||
| + | |||
| + | |||
| + | |||
| + | |||
| + | |||
| + | |||
| + | |||
| + | |||
| + | |||
| + | |||
| + | |||
| + | |||
| + | |||
| + | |||
| + | |||
| + | |||
| + | |||
| + | |||
| + | |||
| + | 3)CNOSSOS(Traffic Flow) - This asks you for information regarding the amount of weight and speeds of the light, heavy, medium heavy vehicles per hour passing by that segment of the road. It also includes 2-Wheel vehicles above and below 50cc's. It also incorporates the type of traffic it is, as well as road slope and surface. You can find more detailed explanation and references by pressing the info button on that page |
||
| + | [[File:Traffic_2.png|400px|frame|left]] |
||
| + | |||
| + | |||
| + | |||
| + | |||
| + | |||
| + | |||
| + | |||
| + | |||
| + | |||
| + | |||
| + | |||
| + | |||
| + | |||
| + | |||
| + | |||
| + | |||
| + | |||
| + | |||
| + | |||
| + | |||
| + | |||
| + | |||
| + | |||
| + | |||
| + | |||
| + | |||
| + | |||
| + | |||
| + | |||
| + | |||
| + | |||
| + | |||
| + | |||
| + | |||
| + | |||
| + | |||
| + | |||
| + | |||
| + | |||
| + | |||
| + | |||
| + | |||
| + | |||
| + | |||
| + | |||
| + | |||
| + | |||
| + | |||
| + | |||
| + | |||
| + | |||
| + | |||
| + | |||
| + | |||
| + | |||
| + | |||
| + | |||
| + | |||
| + | |||
| + | |||
| + | |||
| + | |||
| + | |||
| + | |||
| + | |||
| + | |||
| + | |||
| + | |||
| + | |||
| + | |||
| + | |||
| + | |||
| + | |||
| + | |||
| + | |||
| + | ===Sound Ray Layers=== |
||
| + | When using the "Calculate Noise Levels" there is a tab called "Options". In this tab you can choose to create different sound ray layers for each receiver points. You can create "Direct Sound Rays, Diffracted Sounds Rays - Vertical Obstacles and Diffracted Sounds Rays - Horizontal Obstacles. Note that these operations can take a long time to process as this will include many more calculations for each receiver point. You should only use these options for small area. |
||
| + | [[File:sound_ray.png|400px|frame|left]] |
||
| + | |||
| + | |||
| + | |||
| + | |||
| + | |||
| + | |||
| + | |||
| + | |||
| + | |||
| + | |||
| + | |||
| + | |||
| + | |||
| + | |||
| + | |||
| + | |||
| + | |||
| + | |||
| + | |||
| + | |||
| + | |||
| + | |||
| + | |||
| + | |||
| + | |||
| + | |||
| + | |||
| + | |||
| + | |||
| + | |||
| + | |||
| + | |||
| + | |||
| + | |||
| + | |||
| + | |||
| + | |||
| + | |||
| + | |||
| + | |||
| + | |||
| + | |||
| + | |||
| + | |||
| + | |||
| + | |||
| + | |||
| + | |||
| + | |||
| + | |||
| + | |||
| + | |||
| + | |||
| + | |||
| + | |||
| + | |||
| + | |||
| + | |||
| + | |||
| + | |||
| + | |||
| + | |||
| + | |||
| + | |||
| + | |||
| + | |||
| + | |||
| + | |||
| + | |||
| + | |||
| + | |||
| + | |||
| + | ===Harmful Effects=== |
||
| + | When using the "Noise Exposure" tool, there are extra options at the bottom to determine harmful effects to the population living in the dwellings. These are all calculated based on health statistics that are built into OpeNoise Map. When you select the two options it will give you three new layers you just need to find the information for the incidence rate per 10,000 people of Ischaemic Heart Disease for the area. |
||
| + | - High Annoyance - Lden |
||
| + | - High Sleep Disturbance - Lnight |
||
| + | - Ischaemic Heart Diseas - Lden |
||
| + | [[File:harmful_effects.png|400px|frame|left]] |
||
| + | |||
| + | |||
| + | |||
| + | |||
| + | |||
| + | |||
| + | |||
| + | |||
| + | |||
| + | |||
| + | |||
| + | |||
| + | |||
| + | |||
| + | |||
| + | |||
| + | |||
| + | |||
| + | |||
| + | |||
| + | |||
| + | |||
| + | |||
| + | |||
| + | |||
| + | |||
| + | |||
| + | |||
| + | |||
| + | |||
| + | |||
| + | |||
| + | |||
| + | |||
| + | |||
| + | |||
| + | |||
| + | |||
| + | |||
| + | |||
| + | |||
| + | |||
| + | |||
| + | |||
| + | |||
| + | |||
| + | |||
| + | |||
| + | |||
| + | |||
| + | |||
| + | |||
| + | |||
| + | |||
| + | |||
| + | |||
| + | |||
| + | |||
| + | |||
| + | |||
| + | |||
| + | |||
| + | |||
| + | |||
| + | |||
| + | |||
| + | |||
| + | |||
| + | |||
| + | |||
| + | |||
| + | |||
| + | =='''Limitations '''== |
||
| + | |||
| + | The plugin is limited to showing propagation of noise up to 5000m from the given source of sound. This restricts the usage and accuracy of the plugin when dealing with high decibel levels. |
||
| + | The plugin does not do well with larger area and will often crash when there is too much data to process. A potential solution to this is to segment the work into smaller areas. When running the "Create Receiver Points" there may be and undesignated error that occurs at times. I believe this is due to version errors between the plugin and QGIS, that can be fixed by reinstalling the plugin or using a more stable version of QGIS. |
||
| + | This tool does not take into account the direction, angle or elevation of the sound when running it's calculations. There are other sound mapping tools that can handle all these aspects in their calculations. The Noise Modelling has those capabilities in this link [https://noisemodelling.readthedocs.io/en/latest/Noise_Map_From_Point_Source.html Noise Modelling]. |
||
| + | |||
| + | =='''Conclusion'''== |
||
| + | The OpeNoise Map plugin allows the user to create and visualize noise maps by modeling sound propagation of decibel levels as well as calculating potentially harmful effects. I hope that with this tutorial you will be able to use the OpeNoise Map plugin tool to its fullest capabilities. |
||
| + | Feel free to make and edits and improvements on this page as we are constantly trying to improve these tutorials. |
||
| − | [[File:OpeNoisemain.png|frame|left|200px]] |
||
Latest revision as of 16:54, 2 October 2024
Contents
Introduction
Purpose
The objective of this tutorial is to help the user visualize the impact of sound and how it propagates from a location. The user will do this using the “OpeNoise Map” version 2.2 Plugin in QGIS and create a noise map assessing the exposure to noise in a given area, due to the existence of different sources of noise. For this tutorial, the noise to be modelled is the impact of Formula 1 race cars at Baku City Circuit, Azerbaijan. It will then go to show the different variations and higher level details the the tool can use.
Accessing OpeNoise Map Plugin in QGIS
To complete this tutorial the user will need to install QGIS and the OpeNoise Map plugin:
1) Install QGIS 3.34 and open QGIS Desktop
2) When you open QGiS you are greeted by Recent QGIS news and Project templates. To begin select "New Empty Project"
2) select "Plugins" on the ribbon at the top of the screen, then select "Manage/install plugins"
3) Search for "OpeNoise" Map and select "Install Plugin". The user can then access OpeNoise Map by slecting on the "Plugins" option on the ribbon.
Setting Coordinate Reference System(CRS)
Before importing the required shapefile into QGIS, you must set a project coordinate system for your project file. Due to the study area being near the Caspian Sea we can use the "Pulkovo 1942/ Caspian Sea Mercator" projection to ensure accuracy in our analysis.
To change the projection in QGIS: press ctrl+ shift + p and select CRS. In the search bar type "Pulkovo 1942/ Caspian Sea Mercator" and select apply at the bottom of the screen.
Data
All data used for this tutorial is open source and shapefiles can be acquired at:
Baku City Street Circut and Baku Downtown Buildings
Download and Extract the contents of both flies
Adding Layers in QGIS
1) Press Ctrl + L to open the Data Source Manager in QGIS
2) Press on "Vector" in the list of options on the left side, under "source" like the three dots and add the files you downloads that end with .shp - then select "Add"
Once you have added both files we need to extract the Baku Circut from the "polylines3" layer
1) Right Click on the layer and select the attribute table
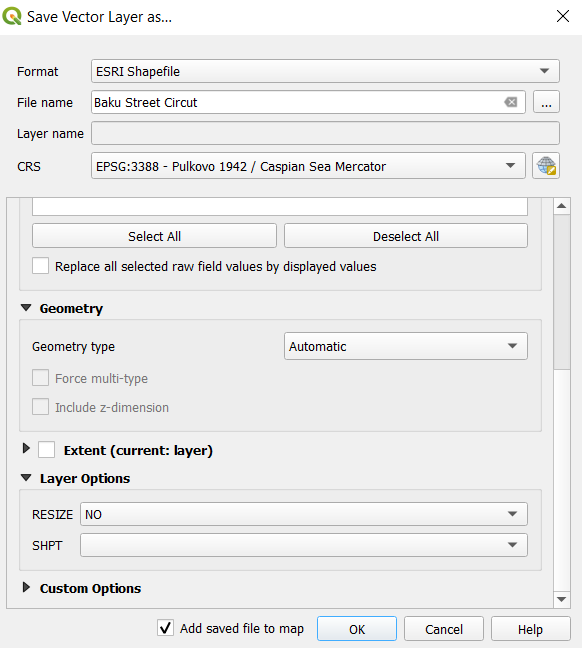
2) Under the column "NAME" find "nal Circuit", left click the number in the farthest left column so the row is highlighted blue
3) Close the attribute table and return to the project page, right click on polyines3 > hover over "Export" > then select "Save Selected Feature as"
4) In the popup box save set the file name as "Baku Street Circut", change the CRS to the Pulkovo 1942/ Caspian Sea Mercator from previous and select OK
Editing Attribute Tables
The user needs to add a decibel level to the Baku circuit layer for analysis
1) Open the attribute table again, in the ribbon at the top select the "Toggle Editing Mode" to enable editing (First button from the left)
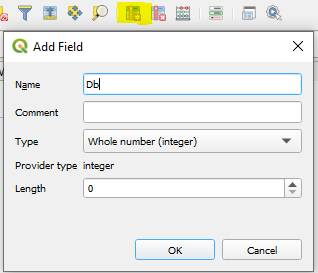
2) Then, in the ribbon at the top select "Add new field" (Sixth button from the right)
3) Name the new field "Db", make the Type and Integer and in the "Length" section enter the value "3" and select OK
4) Under the newly created "Db" column enter the value "134" - this is the value for the decibel level of this track
5) Save your changes by pressing the "Save Edits" in the top ribbon (Third button from the left)
6) Press the "Toggle Editing Mode" again to disable editing mode
Using OpeNoise Map with Roads
Create Receiver Points
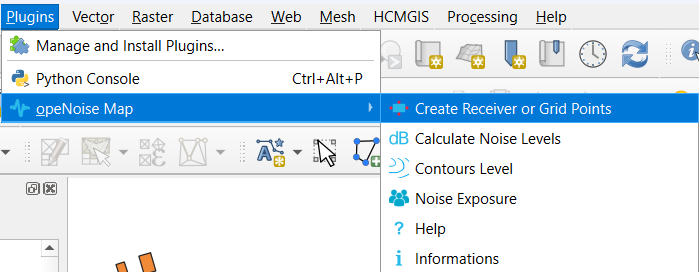
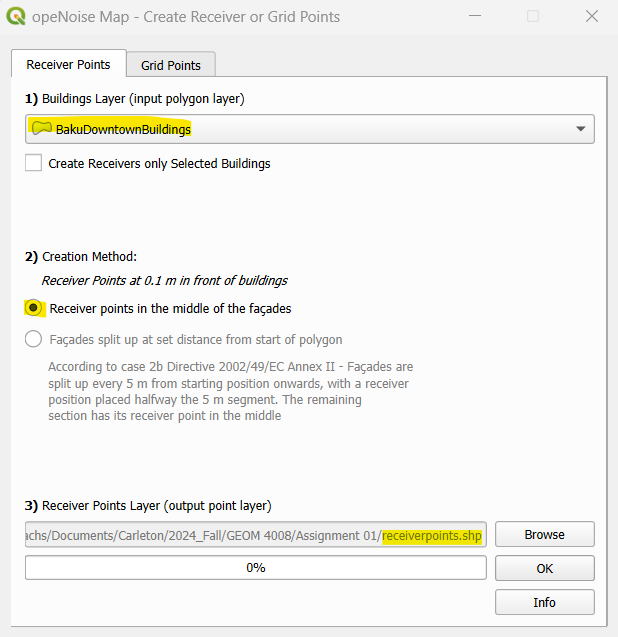
1) To begin left click on the plugins from the ribbon and hover over OpeNoise Map. When the menu appears select on "Create Receiver or Grid Points" and select the "Receiver Points" tab. In the box that appears make sure that the "Building layer(input polygon layer)" dropdown box has the "BakuDowntownBuildings" shapefile as selected. In the "receiver layer" select browse and name the new shapefile "receiverpoints".
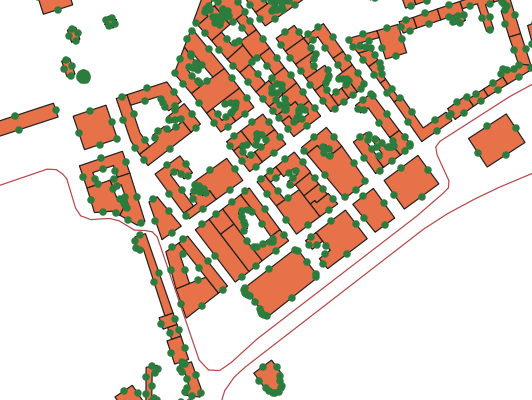
- Select "Ok"- the program will run and new points will populate facades of all the building shapefiles.
Create Grid Points
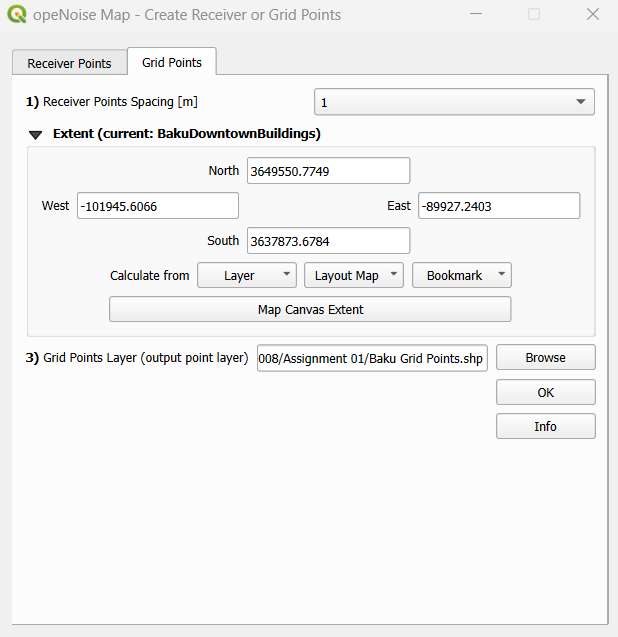
1) Open the plugging options again and select "Create Receiver or Grid Points", then select the Grid Points tab
2) Set the "Receiver Points Spacing [m]" to 1
3) Set the "Extension Layer" to the buildings layer
4) Name the file "Baku Grid Points", then select OK
Calculate Noise Levels
- For this Tutorial, a decibel level of 134 was chosen in accordance with the available literature on noise pollution of Formula 1 racecars. This value is given to the whole track and does not account for slow areas(corners) of the track where the decibel level would be decreased due to braking.
1) Return to the OpeNoise Map dropdown window and select " Calculate Noise Levels"
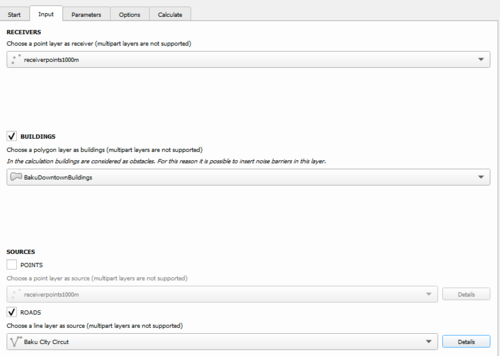
2) Select the input tab- under "RECEIVERS" the point layer we created early should be selected.
3) Check the "BUILDINGS" box and select "BakuDownTownBuildings"
4) Under "Sources" select the roads check box and choose "Baku City Circut"
4) Select the "Details" button next to the Baku City Circut layer, in the top left select "NMPB(emission)", for data type check the "Generic" box
5) In the first dropdown window below generic select the Sound Emission level - dB(A)- as the "Db" field layer and select OK
6) In the Parameters tab, under research ray(m) choose 1000
According to weather on race day for "atmospheric Absorption" change temperature(C) to 20 and Relative Humdity(RH%) to 70
The Lden definition does not need to be set as the plugin automatically calculates the value based on the regulations of each Country
7) Go to the Calculate tab and select the calculate button this process may take between 1 and 2 hours depending on the users computing power
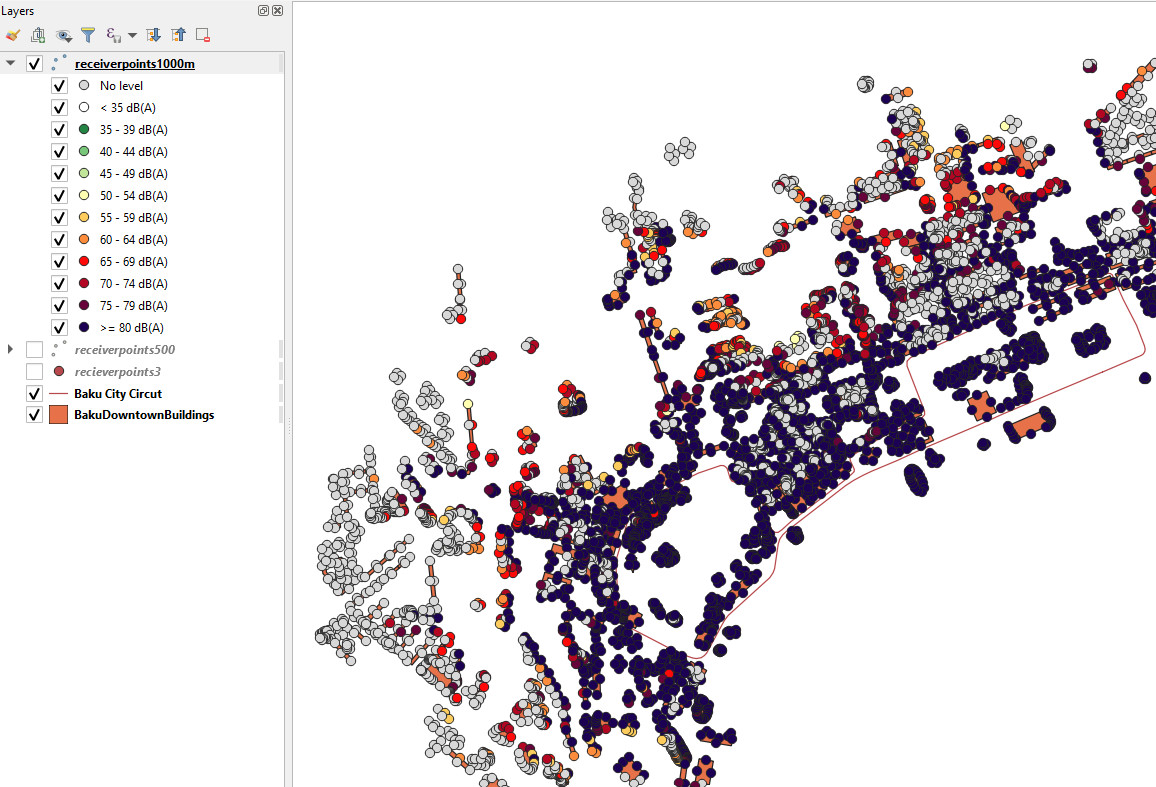
- Result of Calculate Noise Levels assigns decibel values up to 1000 m from the sound source. Points beyond 1000m are gray and assigned "no level"
Create Sound Level Contours
1) Return to the OpeNoise Map Plugin and select "Contours Level"
2) Make sure that the grid points is selected for the grid point layer
3) Select the gird points field layer that contains the noise levels in dB
4) Enter the minimum noise level value as 0 and the maximum as 150 and the interval as 10
5) Name the output layers as " Baku Contours Level" and "Baku Polygons Level", then select OK
- The contour layers based on decibel values has now been created, you can change the symbology colors as you choose
Create Noise Exposure
This feature will assign dwellings and people living in them to receiver points. Then based on calculations will evaluate the harmful effect of the noise.
- Before you can use this tool you need to make sure you have certain information in your Buildings layer
1) Right Click on the building layer, and open the Attribute table, then enter the editing mode as before and creating new fields
2) The first field will be named "People" and will be an integer field, you will populate it with the estimated number of people living in each building
3) The second field will be named "Dwellings" and will be and integer field, you will it with the estimated number of dwellings for each building
4) The third field will be named "Facade type Exposition" or just "Type" and this will be a string field, you will populate this field with either 1-single dwelling, 2-appartment building or 3-appartment building multi facade.
- You can find more info on those facade types in the info page for the plugin
- Now you can start using the Noise Exposure tool
1) Return to the OpeNoise Map Plugin and select "Noise Exposure", you can ignore the warning message
2) Make sure that the "Receiver Points Layer" is the receiver points that you created
3) Set the "Lden" and "Lnight" to the receiver field layer with the noise level and set "Noise Band" to 5
4) Make sure that the "Buildings" is set to your BakuDownTownBuildings, the "People" to the field you created do the same for "Dwellings" and "Facade type Exposition", then select OK
- You will now have 4 temporary layers in your map view;
- People Exposure - Lden - People Exposure - Lnight - Dwellings Exposure - Lden - Dwellings Exposure - Lnight
Variations
There are many different variations and levels of detail that you can use with the opeNoise Map plugin tool. The above tutorial focused on the most basic options for noise coming from a road segment. I will now go through some of the other options.
Day/Night
In both the Points and Roads details you have four different options that you decide whether or not to use one, two, three or all four of those. You have the Generic option for one value depicting any time. Then you have Day, Evening and Night which represents those time periods.
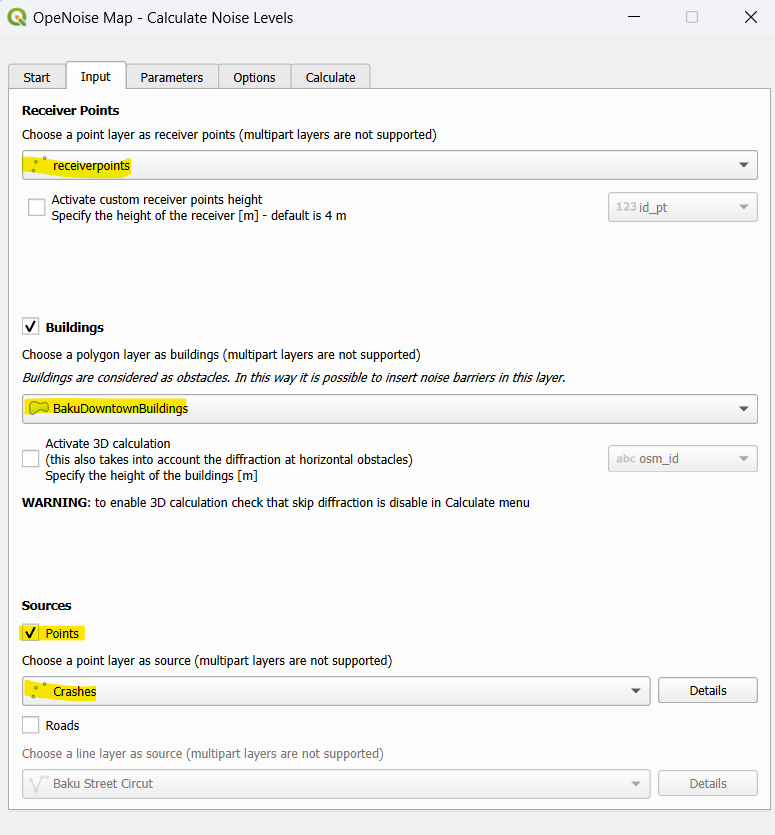
Point or Points
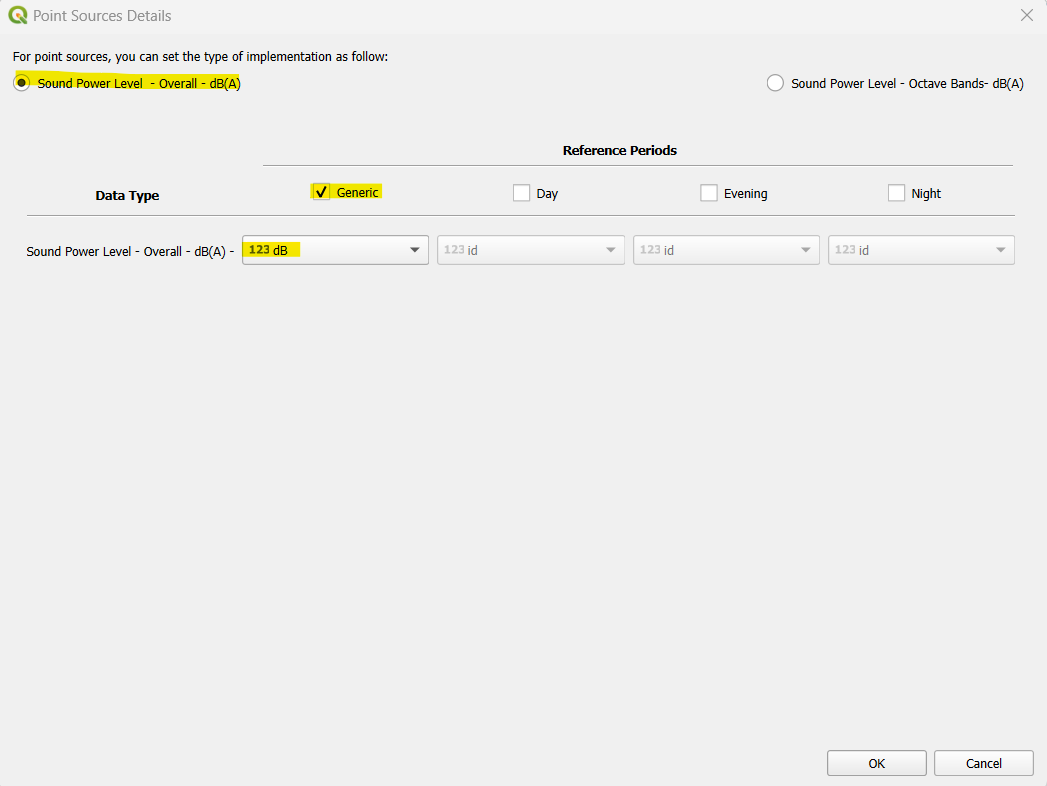
You can use the same workflow as above the only difference would be when you are using "Calculate Noise Levels" instead of choosing roads you choose points. You must have at least two fields in your points layer one for an id and the other for the decibel level. For an example the id could be the number of the race car and the decibel would the how loud the crash was.
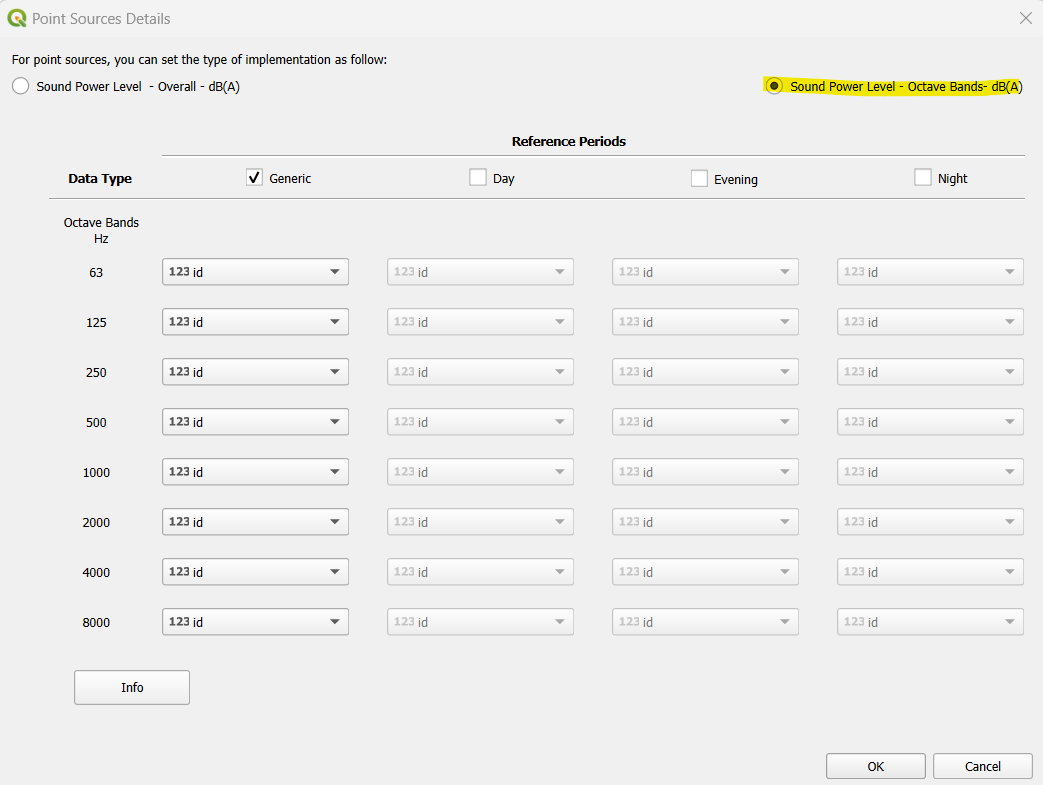
The points details have two options to use, Overall dB and Octave Bands dB. The overall dB only asks you to provide one decibel value. The Octave Bands ask you to provide decibel values for each octave bands at certain hertz (Hz) values. You are able to use both Points and Roads at the same time in your calculations if that is needed.
Traffic Flow
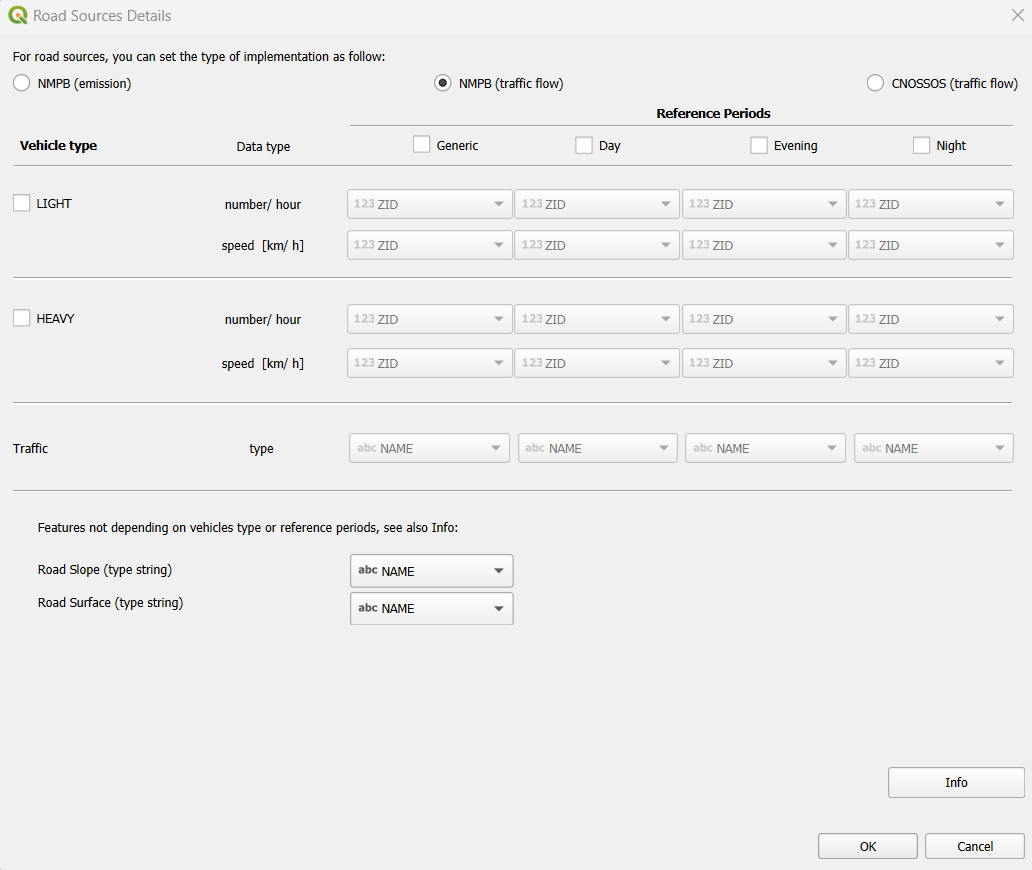
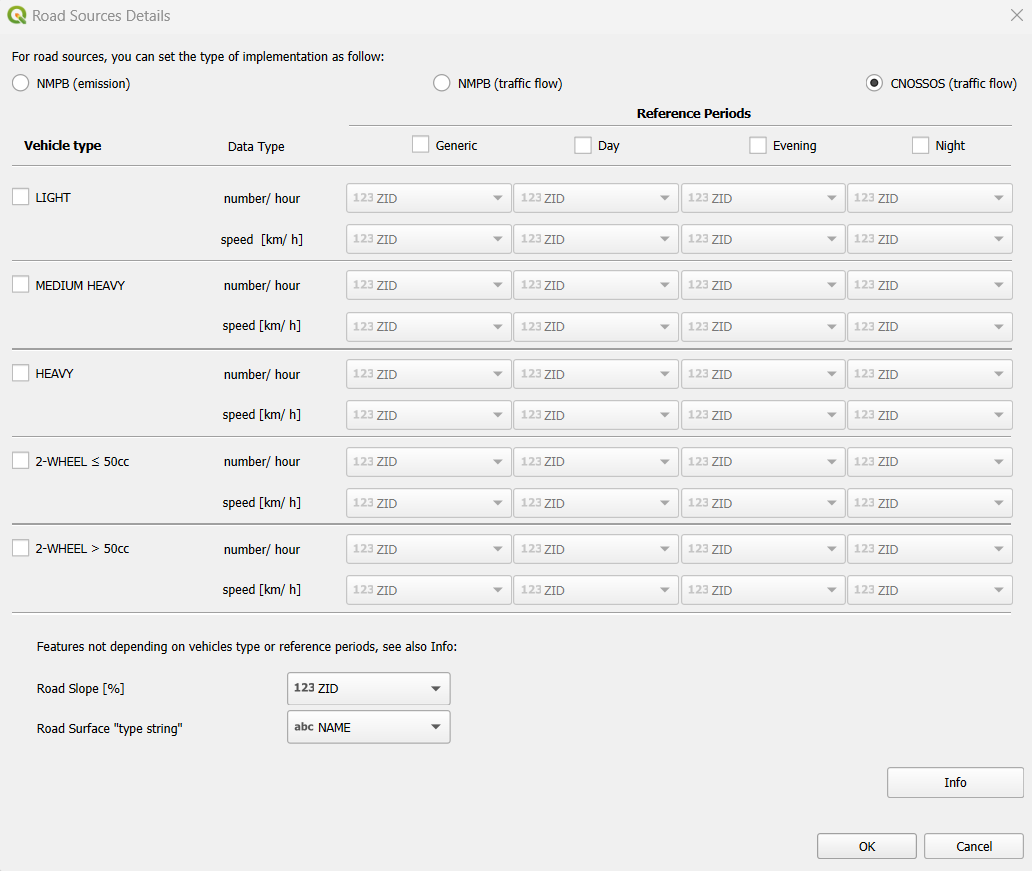
When using the Road option in the "Calculate Noise Levels" you have three different levels of detail that you can use.
1)NMPB(Emission) - This only asks you for one decibel field for your layer that you are using.
2)NMPB(Traffic Flow) - This asks you for information regarding the amount of weight and speeds of the light and heavy vehicles per hour passing by that segment of the road. It also incorporates the type of traffic it is, as well as road slope and surface. You can find more detailed explanation and references by pressing the info button on that page.
3)CNOSSOS(Traffic Flow) - This asks you for information regarding the amount of weight and speeds of the light, heavy, medium heavy vehicles per hour passing by that segment of the road. It also includes 2-Wheel vehicles above and below 50cc's. It also incorporates the type of traffic it is, as well as road slope and surface. You can find more detailed explanation and references by pressing the info button on that page
Sound Ray Layers
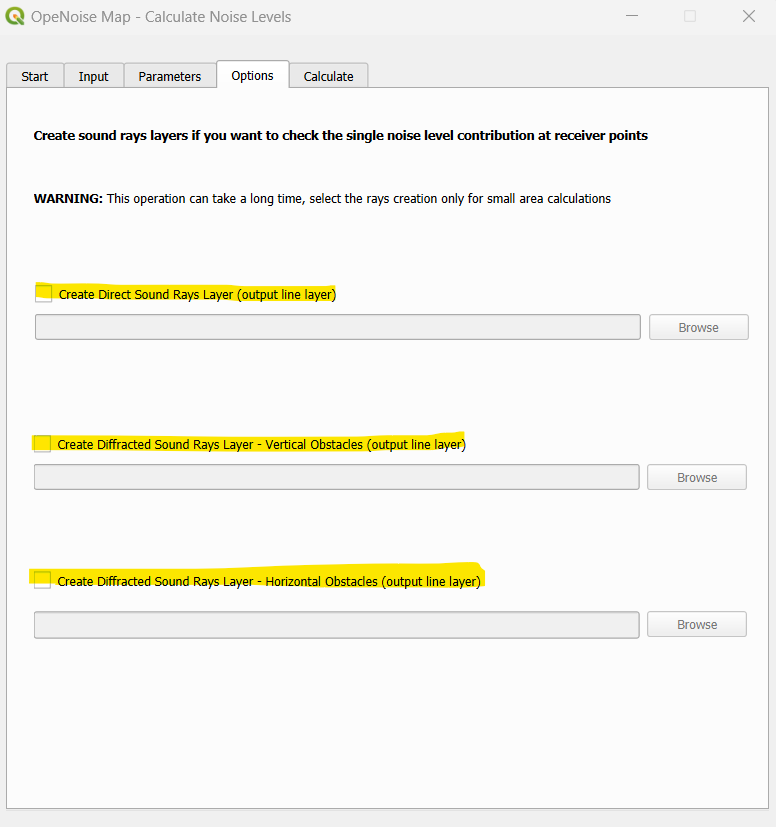
When using the "Calculate Noise Levels" there is a tab called "Options". In this tab you can choose to create different sound ray layers for each receiver points. You can create "Direct Sound Rays, Diffracted Sounds Rays - Vertical Obstacles and Diffracted Sounds Rays - Horizontal Obstacles. Note that these operations can take a long time to process as this will include many more calculations for each receiver point. You should only use these options for small area.
Harmful Effects
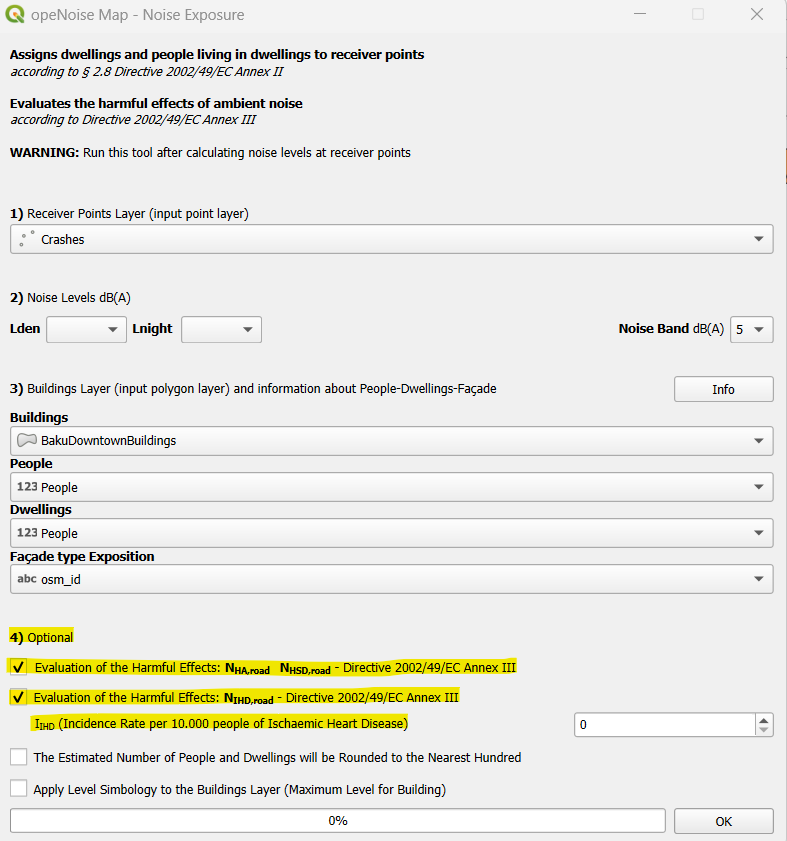
When using the "Noise Exposure" tool, there are extra options at the bottom to determine harmful effects to the population living in the dwellings. These are all calculated based on health statistics that are built into OpeNoise Map. When you select the two options it will give you three new layers you just need to find the information for the incidence rate per 10,000 people of Ischaemic Heart Disease for the area. - High Annoyance - Lden - High Sleep Disturbance - Lnight - Ischaemic Heart Diseas - Lden
Limitations
The plugin is limited to showing propagation of noise up to 5000m from the given source of sound. This restricts the usage and accuracy of the plugin when dealing with high decibel levels. The plugin does not do well with larger area and will often crash when there is too much data to process. A potential solution to this is to segment the work into smaller areas. When running the "Create Receiver Points" there may be and undesignated error that occurs at times. I believe this is due to version errors between the plugin and QGIS, that can be fixed by reinstalling the plugin or using a more stable version of QGIS. This tool does not take into account the direction, angle or elevation of the sound when running it's calculations. There are other sound mapping tools that can handle all these aspects in their calculations. The Noise Modelling has those capabilities in this link Noise Modelling.
Conclusion
The OpeNoise Map plugin allows the user to create and visualize noise maps by modeling sound propagation of decibel levels as well as calculating potentially harmful effects. I hope that with this tutorial you will be able to use the OpeNoise Map plugin tool to its fullest capabilities.
Feel free to make and edits and improvements on this page as we are constantly trying to improve these tutorials.

