Difference between revisions of "Digitizing in QGIS"
| (2 intermediate revisions by the same user not shown) | |||
| Line 286: | Line 286: | ||
[[File:UserManualTable.png|frame|Source: https://docs.qgis.org/3.44/en/docs/user_manual/working_with_vector/editing_geometry_attributes.html#advanced-digitizing|none]] |
[[File:UserManualTable.png|frame|Source: https://docs.qgis.org/3.44/en/docs/user_manual/working_with_vector/editing_geometry_attributes.html#advanced-digitizing|none]] |
||
This tutorial will focus on demonstrating how to use three of these tools: the Move Feature(s) [[File:MoveFeatures.png]] tool and the “Split Features” [[File:SplitFeatures.png]] and “Merge Selected Features” |
This tutorial will focus on demonstrating how to use three of these tools: the Move Feature(s) [[File:MoveFeatures.png]] tool and the “Split Features” [[File:SplitFeatures.png]] and “Merge Selected Features” [[File:MergeFeatures.png]] tools. |
||
===Move Feature(s) tool=== |
===Move Feature(s) tool=== |
||
| Line 292: | Line 292: | ||
This tool allows you to change the location of a digitized feature after it has been created. It can be used for points, polylines, or polygons. It is useful for adjusting the position of a feature that is not quite where you intended to place it, or which you digitized in the wrong location. |
This tool allows you to change the location of a digitized feature after it has been created. It can be used for points, polylines, or polygons. It is useful for adjusting the position of a feature that is not quite where you intended to place it, or which you digitized in the wrong location. |
||
In this example |
In this example you are placing points on the locations of all the red cars in the aerial image and have misplaced a point on a white car. |
||
[[File:PointToMove.png|500px]] |
[[File:PointToMove.png|500px]] |
||
*While in editing mode |
*While in editing mode you will click the ‘Move Feature(s)’ icon [[File:MoveFeatures.png]] |
||
*Then |
*Then you will point the crosshair at the point you want to move and click on it |
||
*A small red circle will appear under the crosshair, and |
*A small red circle will appear under the crosshair, and you will point the red circle at where you want to move the selected point, as shown below |
||
[[File:MovingPoint.png|500px]] |
[[File:MovingPoint.png|500px]] |
||
*Finally, |
*Finally, you will click on the desired location and that will move the point |
||
[[File:MovedPoint.png|500px]] |
[[File:MovedPoint.png|500px]] |
||
*Once |
*Once you are done digitizing with this layer you will click ‘Save Layer Edits’ [[File:SaveLayerEdits.png]] and that will save all the changes made |
||
The same process applies for moving polylines and polygons. |
The same process applies for moving polylines and polygons. |
||
| Line 346: | Line 346: | ||
====Merge Selected Features tool==== |
====Merge Selected Features tool==== |
||
In this example |
In this example you have digitized the major roads present in the aerial image, as shown below, but would like to merge some of the roads that intersect with each other. |
||
[[File:PreMerge.png|500px]] |
[[File:PreMerge.png|500px]] |
||
Latest revision as of 18:37, 6 October 2026
Contents
- 1 Purpose of This Tutorial
- 2 Objective
- 3 Software
- 4 Installing QGIS
- 5 What is Digitizing?
- 6 Why is Digitizing Important and What is its Purpose?
- 7 Data
- 8 Choosing Your Own Aerial Image
- 9 Choosing the Correct Coordinate System For Your Image
- 10 Methods
- 11 Determining Land-Type or Land-use Classes
- 12 Advanced Digitizing
- 13 Final Vector Model
- 14 Querying your data
- 15 Conclusion
Purpose of This Tutorial
The purpose of this tutorial is to demonstrate the process of creating a vector model by digitizing an aerial image within QGIS.
Objective
The objective is to retrieve an aerial image and using QGIS software digitize the different land use cover classes and geographical features within the photo.
Software
The software can be downloaded at [| QGIS].
The software that will be used for this tutorial is the latest long term QGIS 3.44.15 ‘Solothurn’ version on Windows. The long term version offers more stability over using new features such as the recent version QGIS 4.2.3 ‘Belém do Pará’ that was released on 2026-09-25.
QGIS is a user friendly open source geographic information system, it is able to run on Linux, Unix, macOS, Windows, BSD, Android and, IOS. QGIS is able to deploy and support numerous vector, raster and database formats and functionalities.
Installing QGIS
There are several versions of QGIS available for download. For the purposes of this tutorial, we will be using the long-term release version (QGIS 3.44 LTR). Follow this link ([QGIS Download]) to the QGIS site.
Ensure that you’re on the “Download” tab. (Figure 1) There are many versions of the QGIS installer available in this tab for windows installations and other ways to download QGIS. The first is the "Online (OSGeo4W) installer" which, would be the online installer and will not be used for this tutorial, second, there are many versions under "Offline (Standalone) installers" which we are choosing the long-term release (Version 3.44 LTR). We will be using the long-term release because it provides the most stability and is more widely used due to it receiving minor updates less frequently.
Click on the “Long Term Version for Windows (3.44 LTR)” to begin installing the program. (Figure 1)

You will see your download progress in the top right. (Figure 2)

Once the download is complete, simply open the installer. You will then be presented with a setup wizard. (Figure 3) Simply click next and agree to the subsequent Licensing Agreement. Then set your file to whichever destination you wish. If you don’t know where you want your QGIS to go, simply leave the default value in place.

Simply finish the installation and wait 10-15 minutes for the download. Past versions of QGIS installations had you click on which package to download, we can ignore this since it does not show up. However, if it does show up, we would only need the base installation with no packages installed.
What is Digitizing?
Digitizing in the realm of GIS is simply the act of taking a piece of geographic information, such as a map or raster image, and turning it into vector information. This process has existed since the advent of GIS in an analog format. This old manual technique involved a table (digitizing tablet) and a puck, which was a mouse-like device that the operator used to created points, polylines and polygons. This technique was mostly used to import existing physical paper maps and aerial images into a machine readable format. Luckily, we’ve come a long way since the juvenile stages of GIS, and there are now several pieces of software we can use to perform digitizing on digital images and maps; including open source options like QGIS.
Why is Digitizing Important and What is its Purpose?
Digitizing is important because it lets use do inquiries on the geometry of the produced vector data. For example, we can query the area of a polygon or length of a polyline. We can also do statistical operations on these queries, like determining the mean area of all the polygons belonging to one ground type class. It also makes the image more readable by classifying ground features.
Often times aerial images are taken of landscapes however, boundaries between land-use classes are often quite difficult to see without any visual modifications. Not only does digitizing help visualize spatial data, but it also often allows for much more interpretation. Converting aerial image data into vector shape files opens up possibilities for a wide variety of spatial analysis. Thematic maps in GPS programs often use some sort of digitization as the majority of their data is derived from aerial images and that data would not be sufficient for travel within a city (Google Maps, Waze etc.)
Data
The data for this tutorial are extracted from an aerial photo that was retrieved from ([[1]]| https://library.carleton.ca/find/gis/geospatial-data/carleton-campus-aerial-images), We're using the “2017 orthophotos - City of Ottawa (20cm)” theme however any other aerial image dataset will do. For the purpose of familiarity, the image we will be using is a 20cm resolution aerial images of Carleton University from 2017. The steps in this tutorial can be accomplished with any georectified aerial image. Generally, you would like to choose an area that you are relatively familiar with as it could help with your interpretation of the land.

Once you sign and read the agreement on the license under Carleton University, you are brought to the next page where there are 4 different zip files containing images in .tif format of different locations in Ottawa. (Figure 4) Choosing any is fine, but it is best to choose a file from an area you are familiar with or one seems best for you, as the steps done in the tutorial can be applied the same way to each file.

If we download all four images and load them into QGIS, we can see that all 4 files make up an area surrounding the Carleton University campus, including downtown, some farmland, waterbodies, roads etc. (Figure 5) The method used to import these layers into QGIS will be shown in the methods part of this tutorial.

Choosing Your Own Aerial Image
After opening up the four files in QGIS, please consider your area of interest, as this will have huge implications on the success and effectiveness of your digitizing project. Some areas in Ottawa, especially downtown, are quite dense, and thus often require many different classes, which could negatively impact your efforts. However, if you choose an aerial image with little variety in land-use, you might not be able to come up with enough classes. When choosing an aerial image, please think about possible classification schemes and aim for around 5-7 different classes as this will generally look the most pleasing. Please refer to the example below regarding an ideal image for digitizing:

Choosing the Correct Coordinate System For Your Image
After you have imported your aerial image, it is crucial that you check the metadata of the file and ensure that it is being projected in the proper coordinate system. This can be done by right-clicking the file in QGIS and hovering over the 'Layer CRS' button. In our case, we are analyzing an image of Ottawa, and the figure below shows that it is projected using NAD 83 MTM Zone 9, which is an appropriate local projection. If digitizing multiple images, make sure they are all using the same and most appropriate coordinate system.

Methods
This section outlines the steps that will be taken to digitize the chosen image.
Before Beginning
Make sure to have QGIS downloaded and an aerial image saved to a file location where it can be accessed. Generally, you would like to have a folder associated with this project that could be used as your working directory.
Starting a New Project
For this tutorial we will want to create a new project where all of the data will be stored.
- Along the main toolbar in QGIS locate the "Project" tab and click on 'New' to create a new project.
Adding the Aerial Image
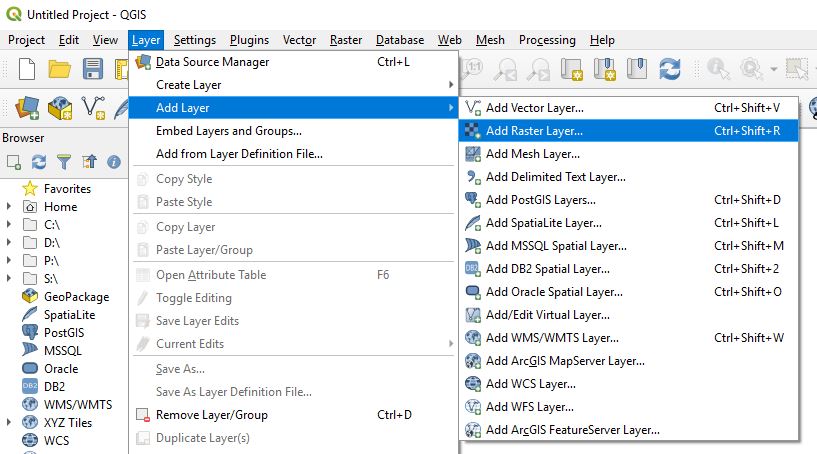
To add the chosen aerial image to the QGIS canvas, use the "Add raster layer" button.
- The "Add raster layer" button is located along the left panel as shown below

- Locate the drive where you saved your aerial image and click "Open"
- Your aerial image should now be open on the QGIS canvas. You can use the "Zoom in" tool
 and the "Zoom out" tool
 to help you identify geographical features or land uses within the aerial image.


Creating Image Pyramids (Optional)
Sometimes when a raster file is too large, you may notice it takes a while for the image to render while zooming and panning around the project. QGIS offers a simple solution to this problem called Image Pyramids, which essentially creates pre-rendered tiles at different resolutions that are presented to you instead of the full raster. This means that the entire raster doesn't have to refresh and reload every time an edit is made, resulting in a quicker, more responsive program.
- To create Pyramids, first right-click on your layer and go down to "Properties".

- In "Properties", find "Pyramids" on the left-hand side. You should open a pop-up similar to this screen:

- Select all resolutions available in the top right corner of the pop-up box. Adjust the settings to those shown in the above figure. Then press "Build Pyramids".
- Once the process finishes, press OK. Your Pyramids should be created.
Snapping Options
When digitizing there should be no gaps between vector layers, so setting up the snapping options will ensure that all lines and polygons are placed tightly together.
- Along the main toolbar locate "Setting" and select "Options"

- The "Options" window will open and you will need to locate the "Digitizing" tab and click it
- Within the "Digitizing" tab you will see subheadings-locate "Snapping"
- Within the "Snapping" subheading, you will set change the settings to the following:
- "Default snapping type" select "Vertex"
- "Default snapping tolerance" set to "10.0 pixels"
- Search radius" to "10.0 pixels"

Setting the Projection
Before beginning to digitize the image, you need to make sure the correct projection is set for the image. Information on the correct projection can usually be found in the file metadata or the site the file was downloaded from. This step is only necessary if the image is not already set to the correct coordinate reference system.
- To set the projection locate your aerial photo on the "Layer Panel"
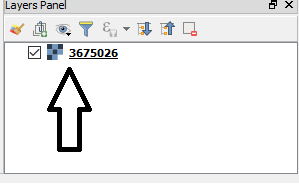

- Right click on the aerial photo and select "Properties"

- Within the "Source" tab in the properties window, locate the "Assigned Coordinate Reference System" subheading and click on the "Coordinate tab"

- A window titled "Coordinate reference system selector" will open and within the filter search bar you can search for the appropriate coordinate system for the image you are using. This aerial image of Ottawa is meant to be projected to the NAD83 MTM Zone 9 coordinate reference system. Once you have selected your coordinate reference system click "Ok" and "Apply".
- Within the "Source" tab in the properties window, locate the "Assigned Coordinate Reference System" subheading and click on the "Coordinate tab"


Determining Land-Type or Land-use Classes
Prior to digitizing your aerial image, you must determine the classes that you will be using for the project. The types of classes often rely on two factors: the quality of the image and the amount of detail you would like to visualize. When determining land-use classes for a large agricultural landscape, you might have different levels of detailed classes that would allow the map reader to easily distinguish between sections throughout the area of interest. A specific range of classes could be very useful for determining different crop types, forest or wetlands. However, when you are digitizing aerial images within a city, you must generalize to a certain extent. This generalization allows for your map to be visually pleasing while encompassing the most important items. Classes become broader such as residential areas, commercial areas, and parks. In our case, we are digitizing an aerial image of a residential area in Ottawa, and, therefore, we will use basic classes.
We will use the following classes in our digitized map as it would make the map aesthetically pleasing and effective:
1) Rails 2) Roads 3) Water 4) Commercial 5) Residential 6) Grass 7) Shopping 8) Parks 9) School
Please refer to the image below if you are having difficulties determining classes for your project:

Digitizing - Polylines
Polylines are used to represent linear objects whose area is not as important as their length. Prominent examples of features that are represented by polylines would be narrow roadways and waterways. In this example we will be digitizing polylines to represent roads within our image.
- Along the main toolbar locate "Layer" select "Create Layer" and select "New Shapefile Layer"

- A new box will open, and you will first have to indicate whether you want to draw a point, line or polygon
- Choose "LineString" as we will draw the roads within the image
- The next step is to set the projection so that the lines are within the same coordinate system as the aerial image
- Click the "coordinate tab" and a new box will open titled "Coordinate Reference System Selector". Within the filter option search for MTM zone 9 and select it and click "Ok"
- Click the "coordinate tab"
- Still within the "New shapefile layer" box, you will need to fill in the fields for the polyline. Under the subheading "New field" fill in the following;
- Name: Roads
- Type: Text (string)
- Length: leave the default value
- click "Add to fields list"

- Save your new shapefile to the location where your project file is saved
- Along the main toolbar locate the "Toggle editing button"
 and activate it
 - Select the "Add feature" button
 , which will activate the drawing tool. Use this feature to draw along a road within the image by clicking on the beginning of the road and all of the following edges until you reach the end of the road. When you are finished drawing the road, right-click on the end of the road and a new box will open titled "Polyline - Feature Attributes"


- Within the roads field, label the road with the appropriate name (i.e. "Bronson")
- To double check to see if the information was correctly entered into the feature attributes box, you can go back to the "Roads" layer within the "Layers Panel", right click it and go to "Open Attribute Table". Within the table there should be the road name that you entered.

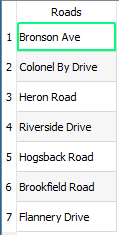

- The roads that you drew should now be present on the aerial image. If you wanted to adjust the appearance of the vector layer (making them wider or a different colour) you can do this by;
- Right clicking the "Roads" tab within the "Layers panel", selecting "Properties" and selecting "Symbology"
Digitizing - Polygons
Polygons are used to represent land coverage areas such as forest, fields and manmade structures. Although polylines can be used for roads, if the area of the road is important like on a major highway, then a polygon can be used to represent it. This can also be done by creating a buffer around the line. Polygons are the only vector type that can be used to determine area.
- Again, go to "Layer" select "Create Layer" and select "New Shapefile Layer"

- In the “New Shapefile Layer” box select “Polygon” under the “Geometry type” header
- Set the projection to match your image
- Click the "coordinate tab"and a new bow will open titled "Coordinate Reference System Selector". Within the filter option search for MTM zone 9 and select it and click "Ok"
- Click the "coordinate tab"
- Under the ‘New Field’ subheading add a text field called “Name” where you will enter the name of the digitized building. Click the ‘Add to Fields List’ button to add it to the layer
- Click “OK”
- Save your new shapefile to the location where your project is saved and give it a suitable name

- In the main toolbar click "Toggle editing button"
- Select the "Add feature" button
 . This works just like the polyline, except the lines form an enclosed polygon
- Select the "Add feature" button


- For this example, we’ll create a polygon that represents St. Patrick’s building on the Carleton University campus
- Simply use the mouse pointer and left mouse button to place points
- QGIS will automatically create a closed polygon with a minimum of three points
- Trace the outline of St. Patrick’s building
- Once finished, simply click the right mouse button and name the polygon. In this case the name will be “St. Patrick’s”

- Click “OK” and the polygon will be created


- To ensure the edits have been made correctly, right click on the “Buildings” layer in the “Layers Panel” and click the “Open Attribute Table” option
- “StPatricks” should appear in the attribute table
Digitizing - Points
Points are good for representing objects whose area is of little concern and all that is required is a point with x, y (and z) coordinates. Unlike polylines and polygons, only one point is used per feature. Examples of objects that are usually represented as points include lamp poles, fire hydrants and bus stops.
- Again, go to "Layer" select "Create Layer" and select "New Shapefile Layer"

- In the “New Shapefile Layer” box select “Point” under the “Geometry type” header
- Set the projection to match your image
- Click the "coordinate tab" and a new box will open titled "Coordinate Reference System Selector". Within the filter option search for MTM zone 9 and select it and click "Ok"
- Click the "coordinate tab"
- Create a field named based on what it represents under the “New field” subheading. In this case, we’re representing Traffic Lights
- Click “OK”
- Save your new shapefile, to the location where your project is saved and give it a suitable name

- In the main toolbar click "Toggle editing button"
- Select the "Add feature" button
 and left click a traffic light
- Select the "Add feature" button


- Only one point can be used to represent each feature, so once you place the point you’ll be prompted to name the feature
- Call it “Traffic Light 1” and hit “OK”

- The new point will now appear on your image
- To ensure the edits have been made correctly right click on the “TrafficLights” layer in the “Layers Panel” and click the “Open Attribute Table” option
- “Traffic Light 1” should appear in the attribute table
Editing Vertices
After you finish creating your new digitized vector layers, you may notice some of your vertices do not line up as you had intended. To fix this, simply begin editing the feature class you are working on by selecting the "Toggle Editing" tool, then the "Vertex Editor" tool.

- As you can see, the top right vertex of this digitization is misaligned.

- Using the Vertex Editor tool, it is easily fixed by clicking and dragging points. Enabling snapping will limit holes/errors in the digitization process.

- Be sure to save edits when finished.
Calculating Area of Vector Layer
If you wanted to calculate the geometric area of the different land use cover classification polygons you have created, this can be done by following these steps:
- Select one of the polygon vector layers and right click on it and select "Open attribute table"

- You will need to "Toggle editing mode" on by, clicking the toggle button

- Now will need to add a new column within the attribute table where you will do the calculations for the geometry of each polygon. You can do so by clicking the "New field" button
 .
. - The "Add field" box will open. Fill in the following;
- Name: "Area"
- Type: "Integer (64 bit)"
- Length: "10"
- Once filled in, click "Ok"
- A new column should now be added in the attribute table titled "Area".
- To calculate the area, you will need to click the "Field calculator" button

- The "Field calculator" box will open and you will need to select the "Update existing field" box and select the "Area" column.
- You now will need to select "Geometry" from "row_number"


- A drop down list will open for geometry and you will need to select "$area" and click "Ok"
- The window will close and within your attribute table you should now have a calculated area for the area column in m2
Advanced Digitizing
Advanced digitizing tools allow you to perform more complex digitizing and editing tasks than the standard QGIS editing toolbar. It can be added to your toolbar banner by clicking on ‘View’, then ‘Toolbars’, and then checking the box next to ‘Advanced Digitizing Toolbar’.

This is what the Advanced Digitizing toolbar looks like when editing a polygon layer:

The following table from the QGIS User Manual describes the capabilities of each of the tools:

This tutorial will focus on demonstrating how to use three of these tools: the Move Feature(s)  tool and the “Split Features”
  and “Merge Selected Features”
  tools.
Move Feature(s) tool
This tool allows you to change the location of a digitized feature after it has been created. It can be used for points, polylines, or polygons. It is useful for adjusting the position of a feature that is not quite where you intended to place it, or which you digitized in the wrong location.
In this example you are placing points on the locations of all the red cars in the aerial image and have misplaced a point on a white car.

- While in editing mode you will click the ‘Move Feature(s)’ icon

- Then you will point the crosshair at the point you want to move and click on it
- A small red circle will appear under the crosshair, and you will point the red circle at where you want to move the selected point, as shown below

- Finally, you will click on the desired location and that will move the point

- Once you are done digitizing with this layer you will click ‘Save Layer Edits’
 and that will save all the changes made

The same process applies for moving polylines and polygons.
Split Features and Merge Selected Features tools
These two tools are essentially each others’ opposites. The Split Features tool is used to split a polygon or polyline feature into two separate features at a specified location. This can be useful for splitting a road at intersections or splitting a building polygon into multiple polygons that represent wings of the building, to provide two possible use cases. When features are split, the resulting features have identical attribute fields.
The Merge Selected Features tool, on the other hand, merges features that have been selected within a layer into a single feature. It can be used on point, polyline, or polygon layers and for features that have common boundaries and those that do not. If the merged features do not have common boundaries, the resulting feature is a multipolygon/multipolyline,/multipoint feature. When features are merged you must decide how the merged feature’s attribute tables are combined.
Split Features tool
In this example a polygon of the Mackenzie Building at Carleton University will be split into seven different polygons representing the four blocks in the building and the three connecting stairwells. The polygon is shown below.

- While in editing mode you will first activate the Split Features tool by clicking on its icon

- The mouse icon will turn into a scope target. To split the polygon you will click on one side of the polygon and then move the mouse to another side of the polygon and click again, which will create a red line, as shown below.

- Then you will right-click which will finalize the split, as shown below

- It is also possible to create more complex split lines by adding more vertexes to the red line before right-clicking. A dramatized example is shown below.

- Once all of the required splitting is done, the Mackenzie Building polygons look like this and each of the polygons can be selected separately:

The same process applies for splitting polylines, except that, by definition, the splitting line only touches the polyline at one point.
Merge Selected Features tool
In this example you have digitized the major roads present in the aerial image, as shown below, but would like to merge some of the roads that intersect with each other.

- While in editing mode you will first select all of the roads that you would like to merge into one feature

- Then you will click the Merge Selected Features button

- This will open the Merge Features dialog box where you will have to decide how the features' attributes will be treated once they are merged.

- The options for how to merge each field depend on the field type, but they each have the option to choose a value from one of the selected features, to manually set the value, to set it to NULL, or to skip the field and not determine a merged value. You are also able to choose the value from the largest/longest feature. The figure below shows the options available for a numerical field.

- For this example, the merged ‘id’ field will be the median of the merged features while the ‘Roads’ field will be a concatenation of all of the merged features.

- Once the merging options are chosen and you press ‘Ok’ the selected polylines will be successfully merged.

- Once you are done merging these features you will click ‘Save Layer Edits’ and that will save all the changes made
The same principles apply for merging point and polygon layers and features do not need to be coincident with each other to be merged.
Final Vector Model
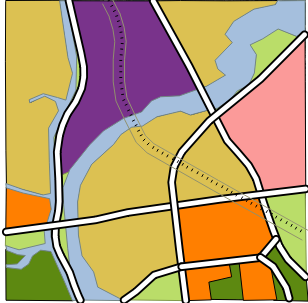
- When you have digitized all the desired geographical features in your image and classified the parcels of land into different land use classifications, your final vector model should be similar to this:

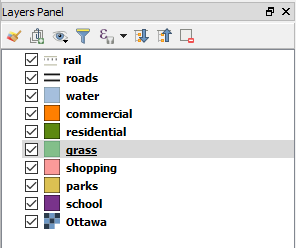
- As well, the "Layers Panel" should include all the different land classifications layers that you added onto the map.

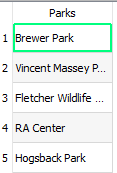
- Within each layer, there should be a corresponding attribute table

Querying your data
After you have finished digitizing the image, spatial analysis can be conducted easily to any of the classes that you have just created. By creating new shape files for each class, you will be easily able to query certain land-cover and analyze them individually. In our case, each road, park, residential neighborhood, and water body will have its own shapefile. Another interesting feature that is available is the ability to categorize classes by their overall area which could be used in determining the dominant land-types over a certain area of interest.
Conclusion
Following this tutorial, you should have a completed vector model that was created by taking an aerial photo and digitizing the geographical features and land use classes and which provides necessary information from that specific region. However, the amount of human error is vital to consider before completing any type of analysis. User error will be present throughout this tutorial as boundaries between layers are not always straight lines. Many different types of error assessment models are available for use to assess your accuracy when creating classes.
This tutorial should also have taught you how to do basic digitizing, including creating points, lines, and polygons, and editing the vertices of digitized features. It should also have taught you some more advanced digitizing techniques, including how to move created features, and merge or split features in a layer. Hopefully this tutorial has inspired you to dig even deeper into digitizing possibilities using QGIS. Information on other available tools can be found in the QGIS User Manual. Happy digitizing!

