Difference between revisions of "Developing a Web Map Server Using GeoServer"
AJ Monfette (talk | contribs) (→Setting Up and Using GeoServer:: Image update) |
|||
| (40 intermediate revisions by 5 users not shown) | |||
| Line 1: | Line 1: | ||
=Introduction:= |
=Introduction:= |
||
| − | This is |
+ | This is simple guide to getting GeoServer running on your computer and displaying data. If you wish for a more detailed and in depth tutorial go to the GeoServer manual [http://docs.geoserver.org/latest/en/user/index.html]. GeoServer is a free, open source web mapping service (WMS) tool for users to upload data and display to other users. The purpose of this tutorial is to show the user how to start, run, upload data, style their map, and serve it to other users. |
| − | =Setting Up and Using |
+ | =Setting Up and Using GeoServer:= |
| + | Before you begin your installation of GeoServer, make sure you have version 17 of JRE/JDK installed locally. [https://adoptium.net/temurin/releases/?version=17] |
||
| − | Installing |
+ | Installing GeoServer: |
| − | * |
+ | * GeoServer can be downloaded from the following link [https://geoserver.org/] |
| + | * Under "Download" select the 2.27.2 "Stable" option. |
||
| − | * Follow along with the instillation wizard, and install geoserver in your chosen directory. |
||
| + | * Once redirected, select "Windows Installer" (for Windows computer) in "Packages". This will automatically start the download. |
||
| ⚫ | |||
| − | * |
+ | * Follow along with the installation wizard, and install GeoServer in your chosen directory. |
| + | ** If issues appear when selecting the Java runtime environment, point the installer to the location where your version 17 JRE/JDK is located |
||
| + | ** For execution type, installing as a service launches and closes GeoServer upon computer startup and shutdown. Whereas, run manual must be launched by the user from the GeoServer file location |
||
| ⚫ | |||
| + | * Once the installation wizard has completed, you can now run GeoServer. |
||
| − | ''Note: It is recommended that you install |
+ | ''Note: It is recommended that you install GeoServer on its own machine or within a virtual machine. This will make sure that nothing conflicts with it, and give the software more space to run.'' |
| − | Starting |
+ | Starting GeoServer: |
| − | To run |
+ | To run GeoServer, navigate to the bin folder in whatever directory you installed the software, and click on the startup icon. This will launch a command prompt showing diagnostic information, now that the command prompt has appeared you can access the server. Open your preferred browser and go to http://localhost:8080/geoserver/web, this will take you to the GeoServer web administration page. There will be a login option at the top right hand side of the page, if you set up a unique username and password during the installation enter it there, if not use the default "admin" as the username and "geoserver" as the password. This will bring you to your homepage, where you have access to all of GeoServer's functions and where all of your data is stored. |
| − | [[File: |
+ | [[File:HomeScreen.png|750px]] |
'' Figure 1: The web administration home page once you have logged into geoserver. '' |
'' Figure 1: The web administration home page once you have logged into geoserver. '' |
||
| − | =Adding Data To |
+ | =Adding Data To GeoServer:= |
| + | For this tutorial, we are using the Canadian federal electoral districts of 2023. These are downloaded from Geo.ca [https://ftp.maps.canada.ca/pub/elections_elections/Electoral-districts_Circonscription-electorale/federal_electoral_districts_boundaries_2023/FED_CA_2023_EN-SHP.zip] |
||
| − | In this case all data was downloaded from Geobase.ca [http://www.geobase.ca/geobase/en/search.do?produit=fed&language=en] |
||
| + | More information about the data can be found here [https://app.geo.ca/en-ca/map-browser/record/18bf3ea7-1940-46ec-af52-9ba3f77ed708] |
||
| − | To add data to |
+ | To add data to GeoServer, you first need to create a new workspace. |
| + | * Click on the “Add new workspaces” option in the center of the page, or navigate to the left panel on the webpage and select “Workspaces” and then “Add new workspace.” |
||
| − | * First navigate to the workspace directory in geoserver(using the links at the side of the web administration page). |
||
* Click the add a new workspace button in the top left hand corner. |
* Click the add a new workspace button in the top left hand corner. |
||
| − | * Choose a unique workspace name and URI(make sure there are no spaces in the workspace name). |
+ | * Choose a unique workspace name and URI (make sure there are no spaces in the workspace name). |
| + | ** For simplicity, the URI should begin with http://geoserver.org/ and end with the name of the workspace |
||
* Then hit the submit button. |
* Then hit the submit button. |
||
| − | [[File: |
+ | [[File:NewWorkspace.png|750px]] |
'' Figure 2: The workspace creation page. '' |
'' Figure 2: The workspace creation page. '' |
||
Now that the workspace has been created, a layer store must be created, which will allow the user to upload and publish a layer. |
Now that the workspace has been created, a layer store must be created, which will allow the user to upload and publish a layer. |
||
| − | * First navigate to the stores directory( |
+ | * First navigate to the stores directory (found under Data on the left hand side of the web administration). |
| − | * Click the add new store button in the top left hand corner. |
+ | * Click the "add new store" button in the top left hand corner. |
| − | * Chose your data source type, in this |
+ | * Chose your data source type, in this example it is a shapefile. |
* Fill in your data's description and then navigate to the data that you wish to upload. |
* Fill in your data's description and then navigate to the data that you wish to upload. |
||
| + | ** Ensure that the name of the store is interruptible, as this name is how you will access the data |
||
| + | ** When connecting the shapefile if there are issues finding the file, try adding the data into a folder that can be seen when accessing the "Browse..." feature |
||
* Then hit the save button at the bottom of the page. |
* Then hit the save button at the bottom of the page. |
||
| − | [[File: |
+ | [[File:NewVectorData.png|750px]] |
'' Figure 3: The data store creation page. '' |
'' Figure 3: The data store creation page. '' |
||
| + | Now that the data has been loaded to GeoServer, it has to be published. To do this, navigate to the layers page on the left hand side |
||
| − | Now that the data has been loaded to geoserver it has to be published. Once you have clicked save and your data store has been created, you will be brought to the new layer page. This page will show you the data that has been upload and give you the option to publish that data. Click on the publish tab this will bring you to the layer configuration page, once you have configured your data appropriately click the save data button and now your data has been published to geoserver. Once you have published your data navigate to the layer tab on the left hand side of the page, find your data and click preview to see your data. |
||
| + | * Click the "Add a new layer" option in the top left of this page |
||
| + | * From the drop down, select the workspace and store that you are looking to publish. This will open the New layer page |
||
| + | * In the information about the layer, click on "Publish" located under "Action" |
||
| + | * Many options can be changed for publishing, but the two requirements are ensuring SRS handling is set to "Force declared" and setting bounding boxes |
||
| ⚫ | |||
| + | * Once all the changes are made, click "Apply" and "Save" |
||
| + | '' Note: save the values for Native Bounding Box as these will be used later '' |
||
| − | '' Notes '' |
||
| − | '' * Make sure that the SRS is force declared. '' |
||
| ⚫ | |||
| − | [[File: |
+ | [[File:LayerPublishing.png|750px]] |
'' Figure 4: The data publishing page. '' |
'' Figure 4: The data publishing page. '' |
||
| − | Now that you have added your data to the server, the next step in this process is to style it, so that when you request the map from the server it will have all the appropriate map elements. To add data go through the same process as described above, but make sure to change your data types. |
+ | Now that you have added your data to the server, the next step in this process is to style it, so that when you request the map from the server it will have all the appropriate map elements. To add data, go through the same process as described above, but make sure to change your data types. |
=Adding Style Elements:= |
=Adding Style Elements:= |
||
| − | When styling in |
+ | When styling in GeoServer, a language called Styled Layer Descriptor (SLD) is used; styling is accomplished using an XML-based SLD Style Document. These documents reference specific layers on the GeoServer data store and describe how they should be displayed. The XML SLD language is somewhat complex, so if the user has no experience using the language, just follow along with the Style Document example in Figure 5. More examples of SLD Style Documents can be found in the SLD cookbook. [https://docs.geoserver.org/latest/en/user/styling/sld/cookbook/index.html] The style documents are broken down into points, lines, polygons, rasters, and text. |
To edit the style of a layer, the layers default style must be determined. |
To edit the style of a layer, the layers default style must be determined. |
||
* First navigate to the layers link on the left hand side of the web administration page. |
* First navigate to the layers link on the left hand side of the web administration page. |
||
| − | * Click on the layer name |
+ | * Click on the layer name of the layer you wish to change the style. |
* Click on the publishing tab in the edit layer page. |
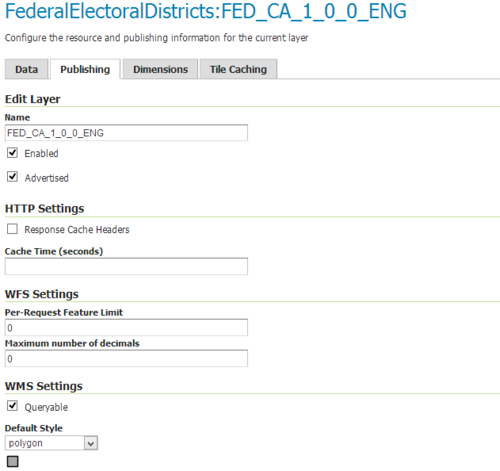
* Click on the publishing tab in the edit layer page. |
||
* Scroll down to the default style under the WMS settings and it will tell you what the default style is. |
* Scroll down to the default style under the WMS settings and it will tell you what the default style is. |
||
| Line 71: | Line 84: | ||
'' Figure 5: Showing the default style of the federal districts layer. '' |
'' Figure 5: Showing the default style of the federal districts layer. '' |
||
| − | Now that the default style of the layer you wish to edit has been determined navigate down to the style link on the left hand side of the web administration page. Click on the style name as determined in |
+ | Now that the default style of the layer you wish to edit has been determined, navigate down to the style link on the left hand side of the web administration page. Click on the style name, as determined in Figure 5, which was polygons, this will bring up the SLD code for this style. Now you can edit this SLD code to change how the layer looks. |
== Editing Existing Style Elements == |
== Editing Existing Style Elements == |
||
| − | '' Note: This tutorial will focus only on editing polygon styles, for more style examples visit [ |
+ | '' Note: This tutorial will focus only on editing polygon styles, for more style examples visit [https://docs.geoserver.org/stable/en/user/styling/sld/cookbook/polygons.html] '' |
| − | One of the easiest things to do is to change the |
+ | One of the easiest things to do is to change the colour of the polygons that you are editing. In this example the polygons will be changed from grey to a dark blue(#000080) colour. |
[[File: DarkBlue.png|500px ]] |
[[File: DarkBlue.png|500px ]] |
||
| − | '' Figure 6: Example of SLD code, changing the |
+ | '' Figure 6: Example of SLD code, changing the colour of a polygon to dark blue. '' |
| − | The |
+ | The colour of the polygons was changed on line 24, <CssParameter name="fill">#000080</CssParameter>. This line determines the fill color for the polygons, it was changed from a grey, to a dark blue. |
| − | Once the |
+ | Once the colour has been changed in the SLD code, click the validate button at the bottom of the page. This will make sure there are no errors in the code. If the code is good a message will appear at the top of the page. Once the code has been validated, go to the top of the page and in the workspace box and choose your layer, and hit submit. Now the SLD code has been associated with your layer, you can go to the layer preview and look at the change in color. |
| − | [[ File: |
+ | [[ File: MapDarkBlue.png|500px ]] |
| − | '' Figure 7: Layer preview of the federal districts layer, with a dark blue |
+ | '' Figure 7: Layer preview of the federal districts layer, with a dark blue colour. '' |
| − | Now that the |
+ | Now that the colour of the polygon has been changed, let's add labels to the polygons. |
| − | [[File: |
+ | [[File: AddingText.png|500px ]] |
'' Figure 8: SLD code for adding labels to polygons. '' |
'' Figure 8: SLD code for adding labels to polygons. '' |
||
| − | As can be seen in |
+ | As can be seen in Figure 8, the polygon labels are determined by the text symbolization from line 31 - 35. This section of code tells the server that there is a label that needs to be added to the polygons, and then line 33 <ogc:PropertyName>ED_NAMEE</ogc:PropertyName> tells the server what attribute field from the layer to use as the labels. In this case it was ED_NAMEE, or English Names, for federal electoral districts. At this point the colour of the map was also changed to a lighter green using the code #40FF40 to make the labels easier to see. |
| − | [[File: |
+ | [[File: MapWithLables.png|500px]] |
'' Figure 9: Demonstrating the labels for the federal electoral districts layer. '' |
'' Figure 9: Demonstrating the labels for the federal electoral districts layer. '' |
||
| Line 104: | Line 117: | ||
==Get Legend Graphic== |
==Get Legend Graphic== |
||
| − | The GetLegendGraphic is a |
+ | The GetLegendGraphic is a request that allows you to see the legend for a specific map that has been made. For more information, visit this GeoServer page. [https://docs.geoserver.org/stable/en/user/services/wms/get_legend_graphic/index.html] For example, if you wanted to see the legend for the Federal Electoral Districts, you would use the following URL. |
| − | http://localhost:8080/geoserver/wms?REQUEST=GetLegendGraphic&VERSION=1.0.0&FORMAT=image/png&WIDTH=20&HEIGHT=20&LAYER= |
+ | http://localhost:8080/geoserver/wms?REQUEST=GetLegendGraphic&VERSION=1.0.0&FORMAT=image/png&WIDTH=20&HEIGHT=20&LAYER=FED_CA_2023_EN |
| − | This |
+ | This URL can be used to get the legend for any of the maps that you may have on GeoServer, the only thing that will need to be changed is what is at the end of the link where it says "Layer=", that will just have to be set to whatever layer the user wishes to see. As of this moment, there is no easy way to get the legend to display on a user's map when they use the GetMap function, but the user can click on different features in the map and the server will display information about those features on the bottom on the map. For example, if you click on one of the Federal Electoral Districts, it would tell you things like the district name, the size, etc., as long as all of that data is associated with the layer. |
=Serving a Map= |
=Serving a Map= |
||
| − | To serve a map using |
+ | To serve a map using GeoServer there are three basic tools that can be used. The first is the GetMap function which allows the user to call up maps. The WMS reflector does pretty much the same thing as the GetMap function, but shortens it down, making it easier to handle. The first two options can only be used on the IP address that you are running GeoServer on. Finally, there is the cascading WMS option which allows a user to access a map remotely. |
==GetMap== |
==GetMap== |
||
| Line 198: | Line 211: | ||
| − | The |
+ | The link below would lead to an image showing the Federal Electoral Districts from GeoServer, with a width of 506 pixels, a height of 512 pixels, and a PNG file format. This link can be modified to meet a get map request; make sure to change the layer name and remove the parentheses. To find the information needed to perform the GetMap request, visit the desired layers' data and publishing information found by editing the layers properties. Here you can find the layer name, style, bounding box, and spatial reference. This link will only work on the same computer that you have GeoServer on (i.e. the "localhost" address points the computer back to itself). |
http://localhost:8080/geoserver/wms? (Normally used to get to the web administration page) |
http://localhost:8080/geoserver/wms? (Normally used to get to the web administration page) |
||
| + | |||
| + | request=GetMap (The operation that has been requested) |
||
&service=WMS (The service that has been requested) |
&service=WMS (The service that has been requested) |
||
| − | &Version=1.1.0 (The version of |
+ | &Version=1.1.0 (The version of GeoServer that is being used) |
| − | + | &layers=FederalElectoralDistricts:FED_CA_2023_EN (The layer that has been requested) |
|
| ⚫ | |||
| − | &layers=FederalElectoralDistricts:FED_CA_1_0_0_ENG (The layer that has been requested) |
||
| ⚫ | |||
| ⚫ | |||
| ⚫ | |||
| ⚫ | |||
| − | |||
| ⚫ | |||
&width=506 (The width requested) |
&width=506 (The width requested) |
||
| Line 221: | Line 234: | ||
&format=image%2Fpng (The image format requested) |
&format=image%2Fpng (The image format requested) |
||
| + | |||
<br> |
<br> |
||
| ⚫ | |||
| − | |||
| + | http://localhost:8080/geoserver/wms?request=GetMap&service=WMS&Version=1.3.0&layers=FED:FED_CA_2023_EN&styles=polygon&srs=EPSG:3347&bbox=3658201.4942857143,658872.9742857143,9019156.614285715,6083004.851428571&width=506&height=512&format=image%2Fpng |
||
| − | [[File: GetMap.png|500pxls]] |
||
| ⚫ | |||
== WMS Reflector == |
== WMS Reflector == |
||
| − | The WMS reflector is a function that shortens the GetMap request, so instead of typing the extremely long link above the user would type in a much shorter one. |
+ | The WMS reflector is a function that shortens the GetMap request, so instead of typing the extremely long link above, the user would type in a much shorter one. |
A reflect request of the above GetMap function would look like this. |
A reflect request of the above GetMap function would look like this. |
||
| − | * http://localhost:8080/geoserver/wms/reflect?layers= |
+ | * http://localhost:8080/geoserver/wms/reflect?layers=FED_CA_2023_EN |
| + | ''Changing what follows the layers= expression with a valid layer in your GeoServer will provide different maps '' |
||
| ⚫ | |||
| ⚫ | |||
| − | [[File: reflector.png|500px]] |
||
| − | |||
| − | ''Figure 11: An example of the reflector function for the federal electoral districts layer.'' |
||
== Serving your web map == |
== Serving your web map == |
||
| − | Now that you are able to view your maps |
+ | Now that you are able to view your maps using GeoServer on the local computer, it would be useful to be able to view map on a computer that is not on your home network. To serve maps that can be viewed beyond your own network, the user will need some sort of web server/website that they can serve their maps out to. |
=Conclusion= |
=Conclusion= |
||
| − | + | GeoServer is an extremely useful tool for viewing spatial data over the web. This tutorial has taught you how to install, set up, add data, style your data, and finally serve it out. These are just basic functions of GeoServer, for more information on GeoServer and its capabilities, read the GeoServer manual. |
|
=References= |
=References= |
||
| − | + | GeoServer User Manual [http://docs.geoserver.org/stable/en/user/] |
|
| + | |||
| + | Geobase: Federal Electoral Districts [https://app.geo.ca/en-ca/map-browser/record/18bf3ea7-1940-46ec-af52-9ba3f77ed708] |
||
| + | * |
||
| − | Geobase: Federal Electoral Districts [http://www.geobase.ca/geobase/en/data/admin/fed/description.html] |
||
Latest revision as of 21:52, 1 October 2025
Contents
Introduction:
This is simple guide to getting GeoServer running on your computer and displaying data. If you wish for a more detailed and in depth tutorial go to the GeoServer manual [1]. GeoServer is a free, open source web mapping service (WMS) tool for users to upload data and display to other users. The purpose of this tutorial is to show the user how to start, run, upload data, style their map, and serve it to other users.
Setting Up and Using GeoServer:
Before you begin your installation of GeoServer, make sure you have version 17 of JRE/JDK installed locally. [2]
Installing GeoServer:
- GeoServer can be downloaded from the following link [3]
- Under "Download" select the 2.27.2 "Stable" option.
- Once redirected, select "Windows Installer" (for Windows computer) in "Packages". This will automatically start the download.
- Follow along with the installation wizard, and install GeoServer in your chosen directory.
- If issues appear when selecting the Java runtime environment, point the installer to the location where your version 17 JRE/JDK is located
- For execution type, installing as a service launches and closes GeoServer upon computer startup and shutdown. Whereas, run manual must be launched by the user from the GeoServer file location
- Make sure to download the manual for GeoServer from the following link [4]
- Once the installation wizard has completed, you can now run GeoServer.
Note: It is recommended that you install GeoServer on its own machine or within a virtual machine. This will make sure that nothing conflicts with it, and give the software more space to run.
Starting GeoServer:
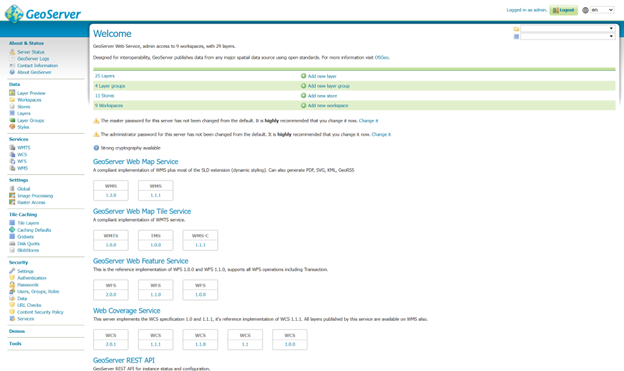
To run GeoServer, navigate to the bin folder in whatever directory you installed the software, and click on the startup icon. This will launch a command prompt showing diagnostic information, now that the command prompt has appeared you can access the server. Open your preferred browser and go to http://localhost:8080/geoserver/web, this will take you to the GeoServer web administration page. There will be a login option at the top right hand side of the page, if you set up a unique username and password during the installation enter it there, if not use the default "admin" as the username and "geoserver" as the password. This will bring you to your homepage, where you have access to all of GeoServer's functions and where all of your data is stored.
Figure 1: The web administration home page once you have logged into geoserver.
Adding Data To GeoServer:
For this tutorial, we are using the Canadian federal electoral districts of 2023. These are downloaded from Geo.ca [5] More information about the data can be found here [6]
To add data to GeoServer, you first need to create a new workspace.
- Click on the “Add new workspaces” option in the center of the page, or navigate to the left panel on the webpage and select “Workspaces” and then “Add new workspace.”
- Click the add a new workspace button in the top left hand corner.
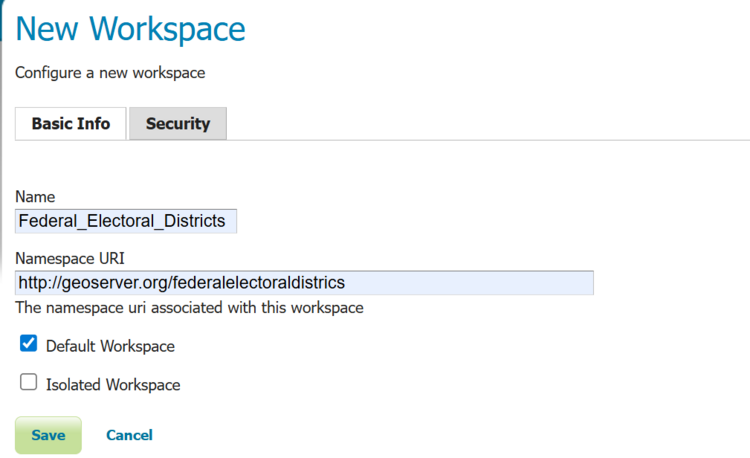
- Choose a unique workspace name and URI (make sure there are no spaces in the workspace name).
- For simplicity, the URI should begin with http://geoserver.org/ and end with the name of the workspace
- Then hit the submit button.
Figure 2: The workspace creation page.
Now that the workspace has been created, a layer store must be created, which will allow the user to upload and publish a layer.
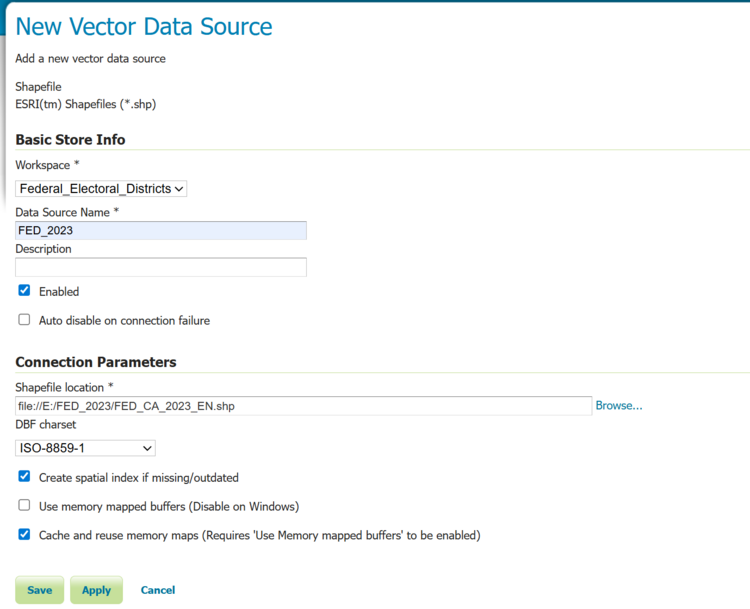
- First navigate to the stores directory (found under Data on the left hand side of the web administration).
- Click the "add new store" button in the top left hand corner.
- Chose your data source type, in this example it is a shapefile.
- Fill in your data's description and then navigate to the data that you wish to upload.
- Ensure that the name of the store is interruptible, as this name is how you will access the data
- When connecting the shapefile if there are issues finding the file, try adding the data into a folder that can be seen when accessing the "Browse..." feature
- Then hit the save button at the bottom of the page.
Figure 3: The data store creation page.
Now that the data has been loaded to GeoServer, it has to be published. To do this, navigate to the layers page on the left hand side
- Click the "Add a new layer" option in the top left of this page
- From the drop down, select the workspace and store that you are looking to publish. This will open the New layer page
- In the information about the layer, click on "Publish" located under "Action"
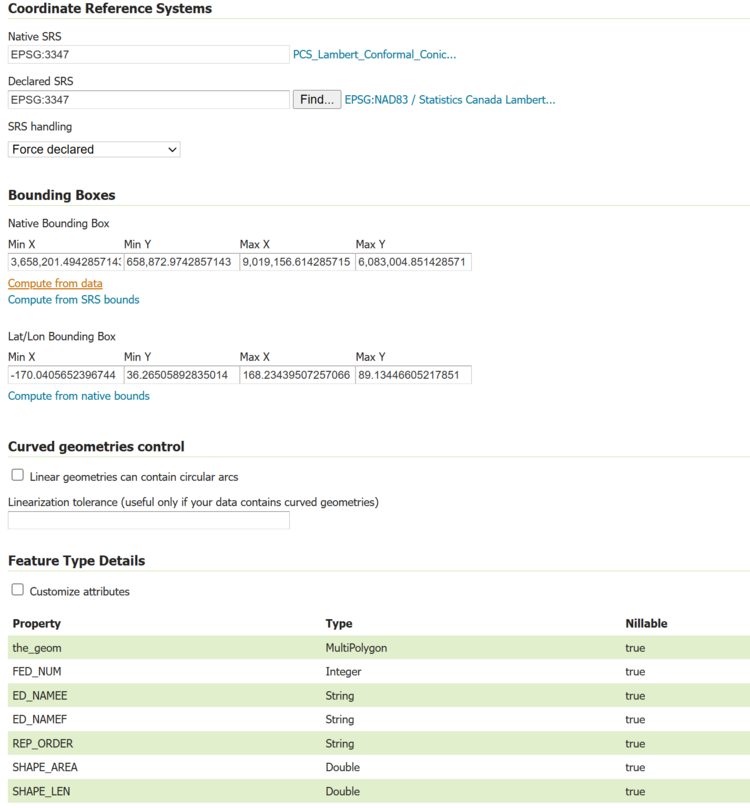
- Many options can be changed for publishing, but the two requirements are ensuring SRS handling is set to "Force declared" and setting bounding boxes
- Compute the bounding boxes by clicking on "Compute from data" and "Compute from native bounds".
- Once all the changes are made, click "Apply" and "Save"
Note: save the values for Native Bounding Box as these will be used later
Figure 4: The data publishing page.
Now that you have added your data to the server, the next step in this process is to style it, so that when you request the map from the server it will have all the appropriate map elements. To add data, go through the same process as described above, but make sure to change your data types.
Adding Style Elements:
When styling in GeoServer, a language called Styled Layer Descriptor (SLD) is used; styling is accomplished using an XML-based SLD Style Document. These documents reference specific layers on the GeoServer data store and describe how they should be displayed. The XML SLD language is somewhat complex, so if the user has no experience using the language, just follow along with the Style Document example in Figure 5. More examples of SLD Style Documents can be found in the SLD cookbook. [7] The style documents are broken down into points, lines, polygons, rasters, and text.
To edit the style of a layer, the layers default style must be determined.
- First navigate to the layers link on the left hand side of the web administration page.
- Click on the layer name of the layer you wish to change the style.
- Click on the publishing tab in the edit layer page.
- Scroll down to the default style under the WMS settings and it will tell you what the default style is.
Figure 5: Showing the default style of the federal districts layer.
Now that the default style of the layer you wish to edit has been determined, navigate down to the style link on the left hand side of the web administration page. Click on the style name, as determined in Figure 5, which was polygons, this will bring up the SLD code for this style. Now you can edit this SLD code to change how the layer looks.
Editing Existing Style Elements
Note: This tutorial will focus only on editing polygon styles, for more style examples visit [8]
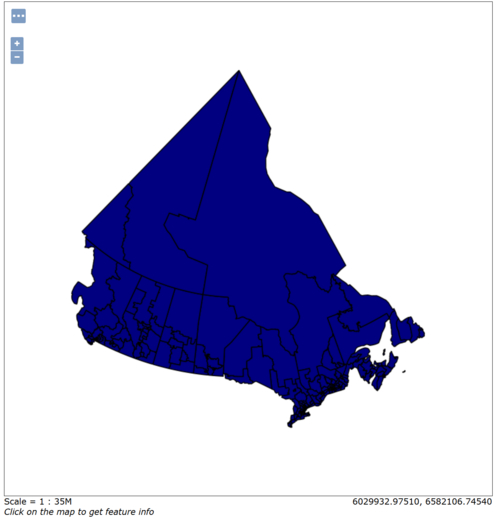
One of the easiest things to do is to change the colour of the polygons that you are editing. In this example the polygons will be changed from grey to a dark blue(#000080) colour.
Figure 6: Example of SLD code, changing the colour of a polygon to dark blue.
The colour of the polygons was changed on line 24, <CssParameter name="fill">#000080</CssParameter>. This line determines the fill color for the polygons, it was changed from a grey, to a dark blue.
Once the colour has been changed in the SLD code, click the validate button at the bottom of the page. This will make sure there are no errors in the code. If the code is good a message will appear at the top of the page. Once the code has been validated, go to the top of the page and in the workspace box and choose your layer, and hit submit. Now the SLD code has been associated with your layer, you can go to the layer preview and look at the change in color.
Figure 7: Layer preview of the federal districts layer, with a dark blue colour.
Now that the colour of the polygon has been changed, let's add labels to the polygons.
Figure 8: SLD code for adding labels to polygons.
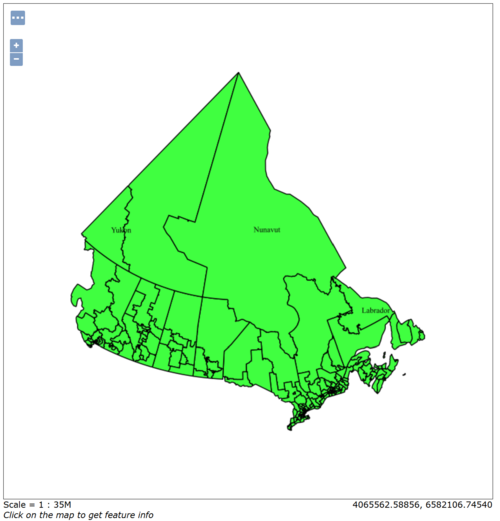
As can be seen in Figure 8, the polygon labels are determined by the text symbolization from line 31 - 35. This section of code tells the server that there is a label that needs to be added to the polygons, and then line 33 <ogc:PropertyName>ED_NAMEE</ogc:PropertyName> tells the server what attribute field from the layer to use as the labels. In this case it was ED_NAMEE, or English Names, for federal electoral districts. At this point the colour of the map was also changed to a lighter green using the code #40FF40 to make the labels easier to see.
Figure 9: Demonstrating the labels for the federal electoral districts layer.
Get Legend Graphic
The GetLegendGraphic is a request that allows you to see the legend for a specific map that has been made. For more information, visit this GeoServer page. [9] For example, if you wanted to see the legend for the Federal Electoral Districts, you would use the following URL.
This URL can be used to get the legend for any of the maps that you may have on GeoServer, the only thing that will need to be changed is what is at the end of the link where it says "Layer=", that will just have to be set to whatever layer the user wishes to see. As of this moment, there is no easy way to get the legend to display on a user's map when they use the GetMap function, but the user can click on different features in the map and the server will display information about those features on the bottom on the map. For example, if you click on one of the Federal Electoral Districts, it would tell you things like the district name, the size, etc., as long as all of that data is associated with the layer.
Serving a Map
To serve a map using GeoServer there are three basic tools that can be used. The first is the GetMap function which allows the user to call up maps. The WMS reflector does pretty much the same thing as the GetMap function, but shortens it down, making it easier to handle. The first two options can only be used on the IP address that you are running GeoServer on. Finally, there is the cascading WMS option which allows a user to access a map remotely.
GetMap
The GetMap function allows the user to call up a map from their browser, by requesting that the server generate said map.
There are a few required parameters that are used for the GetMap function
| Parameter | Required | Description |
|---|---|---|
| Service | Yes | Service is WMS |
| Version | Yes | The version can be one of 1.0.0, 1.1.0, 1.1.1, 1.3. |
| Request | Yes | GetMap |
| Layers | Yes | The layer that is to be displayed on the map. |
| Styles | Yes | The styles in which the layers are to be rendered. |
| srs | Yes | The spatial reference system. |
| bbox | Yes | The bounding box for the map extent. |
| Width | Yes | The width output of the map in pixels. |
| Height | Yes | The height output of the map in pixels. |
| Format | Yes | Format for the map output. [10] |
The link below would lead to an image showing the Federal Electoral Districts from GeoServer, with a width of 506 pixels, a height of 512 pixels, and a PNG file format. This link can be modified to meet a get map request; make sure to change the layer name and remove the parentheses. To find the information needed to perform the GetMap request, visit the desired layers' data and publishing information found by editing the layers properties. Here you can find the layer name, style, bounding box, and spatial reference. This link will only work on the same computer that you have GeoServer on (i.e. the "localhost" address points the computer back to itself).
http://localhost:8080/geoserver/wms? (Normally used to get to the web administration page)
request=GetMap (The operation that has been requested)
&service=WMS (The service that has been requested)
&Version=1.1.0 (The version of GeoServer that is being used)
&layers=FederalElectoralDistricts:FED_CA_2023_EN (The layer that has been requested)
&styles=polygon (The styles in which the layers are to be rendered)
&srs=EPSG:3347(The spatial reference)
&bbox=3658201.4942857143,658872.9742857143,9019156.614285715,6083004.851428571 (The bounding box, noted during the layer publishing step)
&width=506 (The width requested)
&height=512 (The height requested)
&format=image%2Fpng (The image format requested)
An example of the GetMap function for the Federal Electoral Districts layer: http://localhost:8080/geoserver/wms?request=GetMap&service=WMS&Version=1.3.0&layers=FED:FED_CA_2023_EN&styles=polygon&srs=EPSG:3347&bbox=3658201.4942857143,658872.9742857143,9019156.614285715,6083004.851428571&width=506&height=512&format=image%2Fpng
WMS Reflector
The WMS reflector is a function that shortens the GetMap request, so instead of typing the extremely long link above, the user would type in a much shorter one.
A reflect request of the above GetMap function would look like this.
Changing what follows the layers= expression with a valid layer in your GeoServer will provide different maps
This will bring up the map of the federal electoral districts at a default width of 512 pixels. This method is much easier than typing in the long GetMap function, but does takes away some of the control.
Serving your web map
Now that you are able to view your maps using GeoServer on the local computer, it would be useful to be able to view map on a computer that is not on your home network. To serve maps that can be viewed beyond your own network, the user will need some sort of web server/website that they can serve their maps out to.
Conclusion
GeoServer is an extremely useful tool for viewing spatial data over the web. This tutorial has taught you how to install, set up, add data, style your data, and finally serve it out. These are just basic functions of GeoServer, for more information on GeoServer and its capabilities, read the GeoServer manual.
References
GeoServer User Manual [11]
Geobase: Federal Electoral Districts [12]
