Difference between revisions of "Comparison of QGIS to ArcMap"
| (80 intermediate revisions by 4 users not shown) | |||
| Line 1: | Line 1: | ||
| − | **Note: original tutorial of least cost path using QGIS and GRASS had to be scrapped due to GRASS not working after many many attempts at making it work. |
||
| − | |||
== Introduction == |
== Introduction == |
||
| − | ESRI's ArcMap is a useful piece of software that can be used to create maps and perform various types of analysis. Unfortunately, it is an extremely expensive piece of software that not everyone can realistically afford; making it inaccessible. |
||
| + | [[File:Versus.png]] |
||
| − | As an alternative to ArcMap, many turn to Free Open Source Software (FOSS) in order to complete mapping and analysis. Through the use of FOSS, there are huge savings in costs and similar -- if not the same functions are still able to be used. There are many options for substitution of ArcMap to FOSS, all with varying effectiveness and suitability. |
||
| + | |||
| + | ESRI's ArcMap is a useful piece of software that can be used to create maps and perform various types of analysis. Unfortunately, it is an extremely expensive piece of software that not everyone can realistically afford, making it inaccessible. |
||
| + | |||
| + | As an alternative to ArcMap, many turn to Free Open Source Software (FOSS) in order to complete mapping and analysis. Through the use of FOSS, there are huge savings in costs and similar -- if not the same functions are still able to be used. There are many options for substitution of ArcMap to FOSS, all with varying effectiveness and suitability. |
||
A few examples include: |
A few examples include: |
||
| + | *[https://qgis.org/en/site/forusers/download.html QGIS] |
||
| − | *QGIS |
||
| + | *[https://grass.osgeo.org GRASS GIS] |
||
| − | *MapGuide |
||
| + | *[https://gisgeography.com/ilwis-integrated-land-and-water-information-management/ ILWIS] |
||
| − | *Bentley Geo Web Publisher |
||
| + | *[https://spatial.uchicago.edu/software GeoDa] |
||
| − | *etc. |
||
| − | For the purpose of this tutorial, QGIS will be the example used to compare directly to ESRI's ArcMap. |
+ | For the purpose of this tutorial, QGIS will be the example used to compare directly to ESRI's ArcMap. |
| − | < ''ArcMap version 10. |
+ | < ''ArcMap version 10.7 will be used'' > |
| + | |||
| + | <''QGIS version 3.10 will be used''> |
||
| + | |||
| + | (''Please note: this tutorial will be running on the assumption that one or both of the software packages have already been downloaded prior to the tutorial. For information on how to download QGIS please visit [https://qgis.org/en/site/forusers/download.html QGIS.org]. For information on how to purchase and download ArcMap please visit [https://store.esri.com/content/esri/en-us/arcgis-desktop.html ESRI.com]'' |
||
== Purpose == |
== Purpose == |
||
| + | The purpose of this tutorial is to demonstrate how knowledge of ArcMap can be transferred to QGIS. This tutorial will compare basic digitizing and symbology tasks between ArcMap and QGIS. It will also show you where to find many other vector- and raster-based tools in each software package. |
||
| − | To compare vector based tools between costly ArcMap and FOSS QGIS. |
||
| + | |||
| + | Furthermore, the tutorial will compare more features of the two software to help the users to choose the appropriate software according to their needs in carrying out GIS projects. |
||
| + | |||
== Methods == |
== Methods == |
||
| Line 29: | Line 37: | ||
For this tutorial, a comparison will be shown, with the ArcMap button/action on the left side and QGIS on the right, and will be displayed like so: |
For this tutorial, a comparison will be shown, with the ArcMap button/action on the left side and QGIS on the right, and will be displayed like so: |
||
ArcMap = QGIS |
ArcMap = QGIS |
||
| + | |||
| + | The data that was used for the tutorial example was sourced through Carleton University MacOdrum Library's Geospatial Database [https://library.carleton.ca/find/gis GIS @ MacOdrum Library] -- specifically using data on Gatineau Park, QC. Below is a list of layers that were used for the tutorial. |
||
| + | |||
| + | |||
| + | '''Layers included:''' |
||
| + | -25m Contours of Gatineau Park |
||
| + | -Gatineau Park Roads |
||
| + | -Gatineau Park Streams |
||
| + | -Gatineau Park Boundary |
||
| + | -10m DEM of Gatineau Park |
||
| + | |||
| + | The following link provides other sources of data for Gatineau Park: https://www.arcgis.com/home/item.html?id=90bc64f7c242421aba1eb4e06a269977 |
||
| + | |||
== Adding Shapefiles == |
== Adding Shapefiles == |
||
| + | To add/upload data in ArcMap click on the 'Add Data' icon (''Figure 1.'') and add all the files from the methods section. |
||
| − | QGIS offers multiple buttons to upload data, so, ensure that the correct button is pressed, whether it be for vector data or raster data. For the purposes of this tutorial, we are not using any previously downloaded or acquired data, but digitizing our own. |
||
| + | |||
| + | To add files in QGIS click on the 'Add vector data' icon (''Figure 1.'') and add all the files from the methods section. |
||
| + | |||
| + | |||
| + | |||
| + | [[File:Kate1.jpg|border|]] |
||
| + | |||
| + | ''Figure 1. Add Data Icon in ArcMap (left) and Add vector data/Add raster data in QGIS (right)'' |
||
| + | |||
| + | |||
| + | |||
| + | [[File:GatineauArc.PNG|border|700px]] |
||
| + | |||
| + | ''Figure 2. Data layers (provided in the methods section) visualized in ArcMap.'' |
||
| + | |||
| + | |||
| + | |||
| + | [[File:GatineauQGIS.PNG|border|700px]] |
||
| + | |||
| + | ''Figure 3. Data layers (provided in the methods section) visualized in QGIS.'' |
||
| + | |||
| + | == Tools == |
||
| + | The main concern when switching or opting for QGIS (or other FOSSs) over ArcMap is that the tool availability won't be the same, or comparable. And while QGIS doesn't have the same number of tools built into the program, there are many plugins and extensions that can be added that can run a variety of different processes. |
||
| + | |||
| + | QGIS’ toolbox can be accessed by clicking processing then toolbox in the top menu bar. The toolbox will be located on the right side of the screen. |
||
| + | |||
| + | |||
| + | [[File:Processing-qgis.png|border|]] |
||
| + | |||
| + | ''Figure 4. In QGIS showing the drop-down menu for where the toolbox is located.'' |
||
| + | |||
| + | |||
| + | When clicking on the toolbox button, tools for various programs will pop up with the number of tools that can be accessed. For QGIS, there are 79 tools that can be used. |
||
| + | |||
| + | [[File:Toolbox's.png|border|]] |
||
| + | |||
| + | |||
| + | |||
| + | ''Figure 5. Showing ArcMap toolbox (left) and the QGIS toolbox (right).'' |
||
| + | |||
| + | |||
| + | While ArcMap has more built-in tool availability, essential tools are included in QGIS with the opportunity to activate extra plugins and extensions. |
||
| + | |||
| + | Since you need a license to use ArcMap, you might need to purchase additional licenses to use additional tools. This could limit the use of ArcMap and could impact the data for interpretation. |
||
| − | [[File:Kate1.jpg]] |
||
== Digitizing == |
== Digitizing == |
||
| + | Digitization is a process of converting raster data to vector layers. |
||
| − | For the purposes of this tutorial, we are looking at digitizing our own data, so to do so, we need to create new shape files using the following steps. |
||
| + | If you were looking into digitizing your own data in ArcMap or QGIS, below is a step-by-step guide on how to create new shapefiles. |
||
| − | [[File:Kate2.jpg]] |
||
| + | |||
| + | |||
| + | [[File:Kate2.jpg|border|750px]] |
||
| + | |||
| + | ''Figure 6. Create a shapefile in ArcMap (left) through Arc Catalog feature. Create a shapefile using QGIS(right) by going to the 'Layers' dropdown menu > New > New Shapefile Layer'' |
||
| + | |||
| + | |||
| + | |||
| + | In both software, one location can create polygon, polyline and points, and a coordinate system is to be chosen. |
||
| + | |||
| + | [[File:Newshpfile.png|border|]] |
||
| + | |||
| + | ''Figure 7. Showing the control panel for creating a 'New Shapefile' in ArcMap (left) and a 'New Vector Layer' in QGIS (right) '' |
||
| + | |||
| + | |||
| + | |||
| + | The next step is to set the coordinate system of your new layer. |
||
| + | |||
| + | |||
| + | [[File:Coords.png|border|]] |
||
| + | |||
| + | ''Figure 8. ArcMap (left) categorizes the coordinate systems by projection and geographic, while QGIS(right) offers shows the user geographic location of projection .'' |
||
| − | In both software, the one location can create polygon, polyline and points, and a coordinate system is to be chosen. |
||
| − | [[File:Kate3.jpg]] |
||
| − | ArcMap categorizes the coordinate systems by projection and geographic, while QGIS offers all under one dropdown box. |
||
| − | [[File:Kate4.jpg]] |
||
From there, the shapefiles have been created. Now, we can edit the shapefiles. In Arcmap, you are to go through the editor, while in QGIS, right clicking on the layer will bring up a drop down box, in which toggle editing is to be selected. |
From there, the shapefiles have been created. Now, we can edit the shapefiles. In Arcmap, you are to go through the editor, while in QGIS, right clicking on the layer will bring up a drop down box, in which toggle editing is to be selected. |
||
| − | [[File:Kate5.jpg]] |
||
| + | [[File:Editing2.png|border|]] |
||
| − | To begin digitizing, in ArcMap you are to create features, and then create the polygon/line/point. In QGIS, once right clicking and selecting toggle editing, select add feature: [[File:Kate6.jpg]] and the polygon/line/point can be digitized on screen. To do so, move your curser to the desired location and either trace, or create the shapes desired. To complete the polygon, right click, and the following box will come up: |
||
| + | |||
| − | |||
| + | ''Figure 9. How to start editing in ArcMap (left) and in QGIS (right).'' |
||
| − | Give your polygon its own Id number and the polygon will then be complete and on your screen. |
||
| + | |||
| + | |||
| + | |||
| + | To begin digitizing, in ArcMap you are to create features, and then create the polygon/line/point. In QGIS, once right clicking and selecting toggle editing, select add feature: [[File:Kate6.jpg]] and the polygon/line/point can be digitized on screen. To do so, move your curser to the desired location and either trace, or create the shapes desired. |
||
| + | |||
| + | |||
| + | |||
| + | To complete the polygon, right click, and the following box will come up: |
||
| + | |||
| + | |||
[[File:Kate7.jpg]] |
[[File:Kate7.jpg]] |
||
| + | ''Figure 10. In QGIS, a prompt will come up, give your polygon its own Id number and the polygon will then be complete and on your screen.'' |
||
| − | == Tools == |
||
| + | |||
| + | QGIS provides many tools for efficient digitization. In comparison to ArcGIS, QGIS loads faster and performs processes in a smaller amount of time. This is because of its internal structure. |
||
| + | |||
| + | == Plugins == |
||
| + | |||
| + | Plugins are developed by independent organizations and developers, QGIS plugins add free additional functionality and useful features to the QGIS application. Plugins are found under plugins on the main ribbon in QGIS. |
||
| + | |||
| + | |||
| + | [[File:Kareemplug.png|border|]] |
||
| + | |||
| + | ''Figure 11. Plugin menu in QGIS'' |
||
| + | |||
| + | |||
| + | ArcMap has plugins for almost every spatial problem but most are paid they can be found here : |
||
| + | *[https://marketplace.arcgis.com/?start=1&view=grid&sortOrder=desc&sortField=uploaded ArcGIS Marketplace] |
||
| + | |||
| + | QGIS, unlike ArcMap, offers a Plugin Library with an entire list of plugins that can help a user with additional functionality. |
||
| + | |||
| + | == Symbology == |
||
| + | |||
| + | ArcMap and QGIS are two software programs that are able to produce high-quality maps in terms of symbology that are available for use. The way each program approaches symbology; however, is different. |
||
| + | |||
| + | [[File: QGISsymbology.PNG |border| 500px]] |
||
| + | |||
| + | ''Figure 12. The symbology interface in QGIS.'' |
||
| + | |||
| + | |||
| + | QGIS allows deeper colour customization for symbology using a colour wheel and colour gradient. |
||
| + | |||
| + | [[File:Wheel.png|border|]] |
||
| + | |||
| + | ''Figure 13. Colour Wheel In QGIS.'' |
||
| + | |||
| + | [[File: ArcSymbology.PNG |border| 500px]] |
||
| + | |||
| + | ''Figure 14. The symbology interface of ArcMap.'' |
||
| + | |||
| + | |||
| + | [[File:Arccolour.png|border|]] |
||
| + | |||
| + | ''Figure 15. Colour Selector ArcMap |
||
| + | |||
| + | |||
| + | Both software programs have very similar capabilities for symbology possibilities and the tools surrounding symbology. The QGIS symbology interface can be more intuitive and user friendly - resembling to the likes of Photoshop; but ArcMap offers the very same features that are in QGIS, just presented in a different fashion. |
||
| + | |||
| + | == Technical Support == |
||
| + | |||
| + | As ArcMap software is an industry staple, the support network is very helpful. ESRI has hundreds of forms to help any problem, they can be found by searching the problem on google or at [https://support.esri.com/en Esri Support] |
||
| + | |||
| + | With QGIS there are numerous training manuals to help use the software. When it comes to troubleshooting that is where QGIS lacks. The support system relies on the users to help each other open forums on [http://gis.stackexchange.com GIS Stackexchange]. Its is very likely to find someone who has had the same or similar issue with QGIS. |
||
| + | |||
| + | == Licensing == |
||
| + | |||
| + | ArcGIS has a very good geoprocessing framework. Very solid. Very extensive. But your license level determines which tools you can use in ArcGIS. |
||
| + | A basic license still gives you access to a large number of powerful tools. An advanced license gives you access to everything. |
||
| + | |||
| + | [[File:Licensing.png|border|]] |
||
| + | |||
| + | Now this part is important: |
||
| + | There are no license levels in QGIS. Open source QGIS software does not limit which tools can be used. |
||
| + | If you want to use the erase tool in ArcGIS 10, you’d have to turn on the advanced license. If there are no available advanced licenses, it means you can’t use the erase tool. |
||
| + | |||
| + | While ArcGIS requires a paid license which can be very expensive, QGIS in comparison is free. So, when it comes to comparing the licensing of QGIS and ArcGIS, QGIS is the more affordable option. |
||
| + | |||
| + | |||
| + | As both software are similar, the following table of comparisons gives more options to the user to make a decision on the software to use depending on the work to perform. |
||
| + | |||
| + | Differences QGIS ArcGIS |
||
| + | |||
| + | License Available for free Paid license |
||
| + | Operating system Windows Windows |
||
| + | Versions QGIS version 3.10 ArcMap version 10.7 |
||
| + | Tools Some free tools Licensed tools hence paid |
||
| + | File format accessibility Supports all formats Limited file formats |
||
| + | Source Code Open Source Closed Source code |
||
| + | Processing time Less Longer processing time |
||
| + | Reliability More reliable Comparatively less reliable |
||
| + | Mapping functions No advanced mapping functionalities Many advanced mapping functionalities |
||
| + | Plugins Available Not available |
||
| + | Tools availability Offers Plugin Library Offers various tools |
||
| + | Accessibility Desktop accessibility Mobile accessibility |
||
| + | Data Storage Relies on PostGIS File-based shapefiles |
||
| + | Geodata Comparatively fewer options available More options available for geodata |
||
| + | |||
| + | |||
| + | |||
| + | |||
| + | |||
| + | |||
| + | == Conclusion == |
||
| + | |||
| + | Both software packages offer ample opportunity to create interesting and dynamic maps. While ArcMap is widely known and used as a standard in the field of GIS, it is important to consider other options -- particularly FOSS's like QGIS. Affordable mapping is possible, and hopefully this tutorial offered a basis of understanding to bridge the gap between the two software programs! |
||
| + | |||
| + | |||
| + | |||
| + | |||
| − | QGIS’ toolbox can be accessed by clicking processing then toolbox in the top menu bar. The toolbox will be located on the right side of the screen. |
||
| + | '''Happy Mapping!!!''' |
||
| − | [[File:Kate8.jpg]] |
||
| − | When clicking on the toolbox button, tools for various programs will popup with the number of tools that can be accessed. For QGIS, there are 79 tools that can be used. |
||
| − | [[File:Kate9.jpg]] |
||
| + | [[File: Earth.gif | 100px]] [[File: Earth.gif | 100px]] [[File: Earth.gif | 100px]] |
||
| − | While you may pay more and get more with ArcGIS, some essential tools are included in QGIS at no cost. |
||
Latest revision as of 13:10, 1 October 2021
Contents
Introduction
ESRI's ArcMap is a useful piece of software that can be used to create maps and perform various types of analysis. Unfortunately, it is an extremely expensive piece of software that not everyone can realistically afford, making it inaccessible.
As an alternative to ArcMap, many turn to Free Open Source Software (FOSS) in order to complete mapping and analysis. Through the use of FOSS, there are huge savings in costs and similar -- if not the same functions are still able to be used. There are many options for substitution of ArcMap to FOSS, all with varying effectiveness and suitability.
A few examples include:
For the purpose of this tutorial, QGIS will be the example used to compare directly to ESRI's ArcMap.
< ArcMap version 10.7 will be used >
<QGIS version 3.10 will be used>
(Please note: this tutorial will be running on the assumption that one or both of the software packages have already been downloaded prior to the tutorial. For information on how to download QGIS please visit QGIS.org. For information on how to purchase and download ArcMap please visit ESRI.com
Purpose
The purpose of this tutorial is to demonstrate how knowledge of ArcMap can be transferred to QGIS. This tutorial will compare basic digitizing and symbology tasks between ArcMap and QGIS. It will also show you where to find many other vector- and raster-based tools in each software package.
Furthermore, the tutorial will compare more features of the two software to help the users to choose the appropriate software according to their needs in carrying out GIS projects.
Methods
For this tutorial, a comparison will be shown, with the ArcMap button/action on the left side and QGIS on the right, and will be displayed like so: ArcMap = QGIS
The data that was used for the tutorial example was sourced through Carleton University MacOdrum Library's Geospatial Database GIS @ MacOdrum Library -- specifically using data on Gatineau Park, QC. Below is a list of layers that were used for the tutorial.
 Layers included:
  -25m Contours of Gatineau Park
  -Gatineau Park Roads
  -Gatineau Park Streams
  -Gatineau Park Boundary
  -10m DEM of Gatineau Park
The following link provides other sources of data for Gatineau Park: https://www.arcgis.com/home/item.html?id=90bc64f7c242421aba1eb4e06a269977
Adding Shapefiles
To add/upload data in ArcMap click on the 'Add Data' icon (Figure 1.) and add all the files from the methods section.
To add files in QGIS click on the 'Add vector data' icon (Figure 1.) and add all the files from the methods section.
Figure 1. Add Data Icon in ArcMap (left) and Add vector data/Add raster data in QGIS (right)
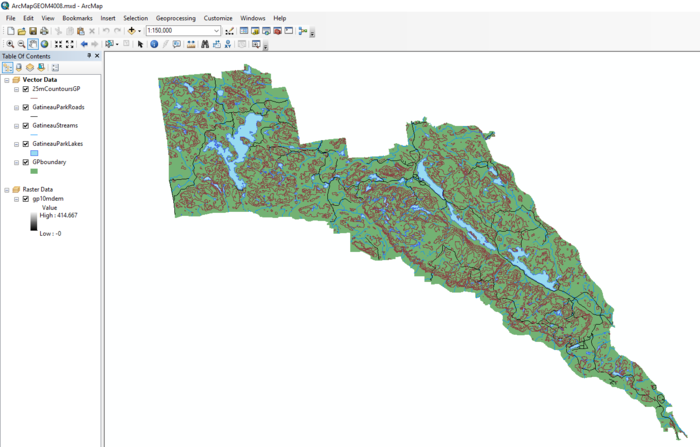
Figure 2. Data layers (provided in the methods section) visualized in ArcMap.
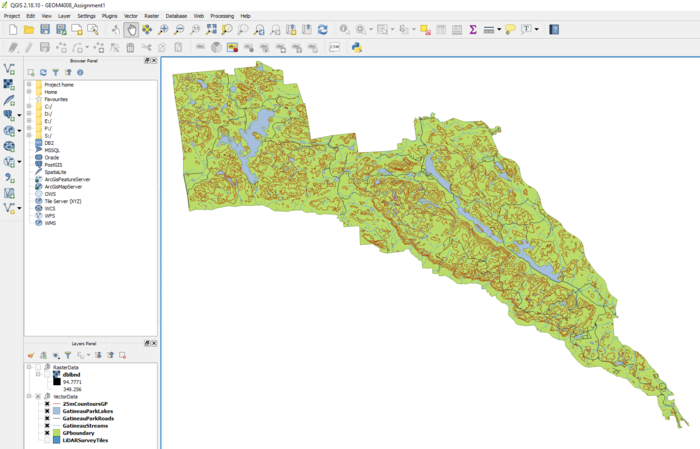
Figure 3. Data layers (provided in the methods section) visualized in QGIS.
Tools
The main concern when switching or opting for QGIS (or other FOSSs) over ArcMap is that the tool availability won't be the same, or comparable. And while QGIS doesn't have the same number of tools built into the program, there are many plugins and extensions that can be added that can run a variety of different processes.
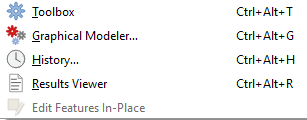
QGIS’ toolbox can be accessed by clicking processing then toolbox in the top menu bar. The toolbox will be located on the right side of the screen.
Figure 4. In QGIS showing the drop-down menu for where the toolbox is located.
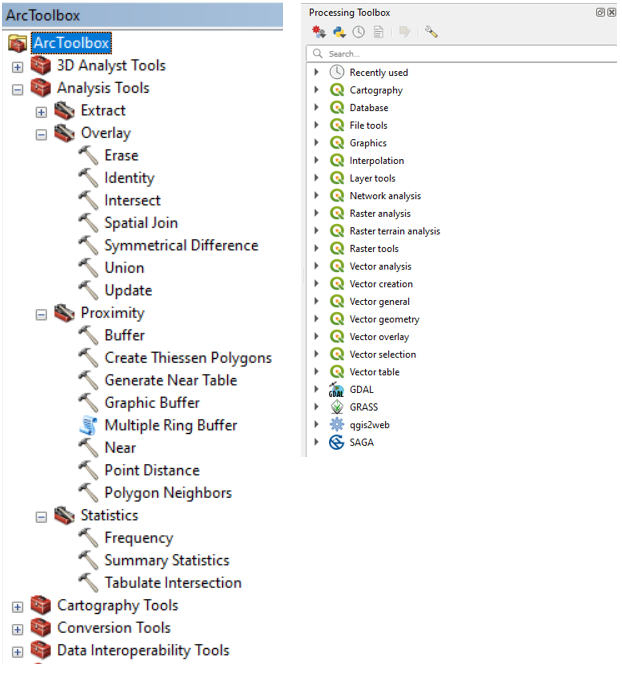
When clicking on the toolbox button, tools for various programs will pop up with the number of tools that can be accessed. For QGIS, there are 79 tools that can be used.
Figure 5. Showing ArcMap toolbox (left) and the QGIS toolbox (right).
While ArcMap has more built-in tool availability, essential tools are included in QGIS with the opportunity to activate extra plugins and extensions.
Since you need a license to use ArcMap, you might need to purchase additional licenses to use additional tools. This could limit the use of ArcMap and could impact the data for interpretation.
Digitizing
Digitization is a process of converting raster data to vector layers.
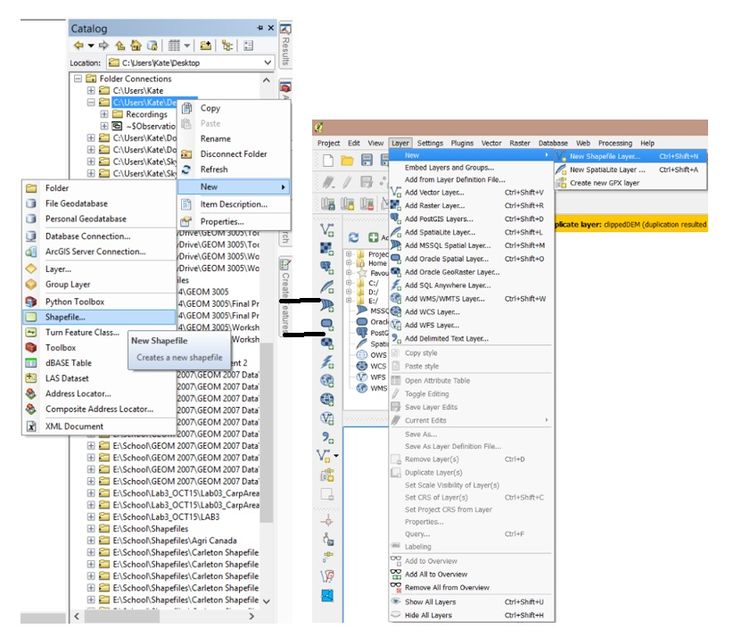
If you were looking into digitizing your own data in ArcMap or QGIS, below is a step-by-step guide on how to create new shapefiles.
Figure 6. Create a shapefile in ArcMap (left) through Arc Catalog feature. Create a shapefile using QGIS(right) by going to the 'Layers' dropdown menu > New > New Shapefile Layer
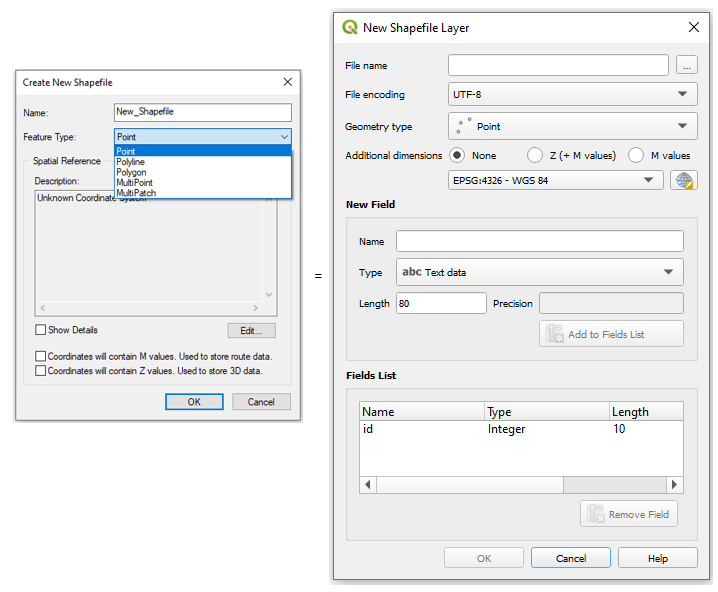
In both software, one location can create polygon, polyline and points, and a coordinate system is to be chosen.
Figure 7. Showing the control panel for creating a 'New Shapefile' in ArcMap (left) and a 'New Vector Layer' in QGIS (right)
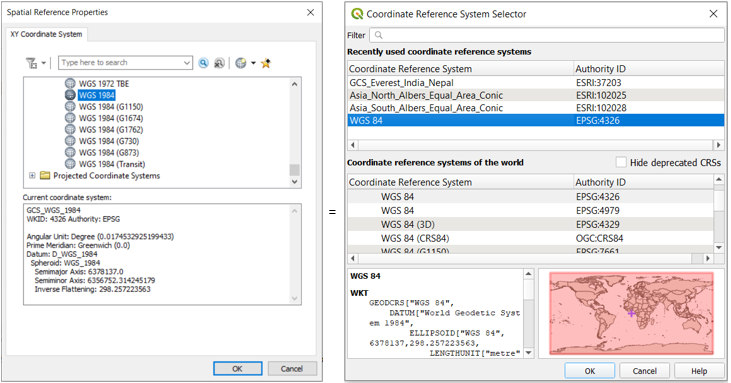
The next step is to set the coordinate system of your new layer.
Figure 8. ArcMap (left) categorizes the coordinate systems by projection and geographic, while QGIS(right) offers shows the user geographic location of projection .
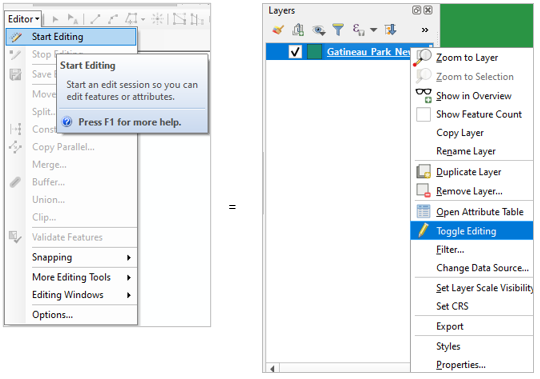
From there, the shapefiles have been created. Now, we can edit the shapefiles. In Arcmap, you are to go through the editor, while in QGIS, right clicking on the layer will bring up a drop down box, in which toggle editing is to be selected.
Figure 9. How to start editing in ArcMap (left) and in QGIS (right).
To begin digitizing, in ArcMap you are to create features, and then create the polygon/line/point. In QGIS, once right clicking and selecting toggle editing, select add feature: ![]() and the polygon/line/point can be digitized on screen. To do so, move your curser to the desired location and either trace, or create the shapes desired.
and the polygon/line/point can be digitized on screen. To do so, move your curser to the desired location and either trace, or create the shapes desired.
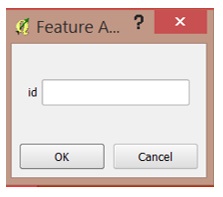
To complete the polygon, right click, and the following box will come up:
Figure 10. In QGIS, a prompt will come up, give your polygon its own Id number and the polygon will then be complete and on your screen.
QGIS provides many tools for efficient digitization. In comparison to ArcGIS, QGIS loads faster and performs processes in a smaller amount of time. This is because of its internal structure.
Plugins
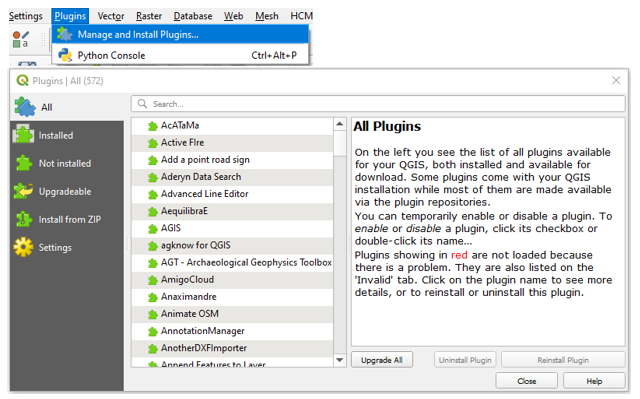
Plugins are developed by independent organizations and developers, QGIS plugins add free additional functionality and useful features to the QGIS application. Plugins are found under plugins on the main ribbon in QGIS.
Figure 11. Plugin menu in QGIS
ArcMap has plugins for almost every spatial problem but most are paid they can be found here :
QGIS, unlike ArcMap, offers a Plugin Library with an entire list of plugins that can help a user with additional functionality.
Symbology
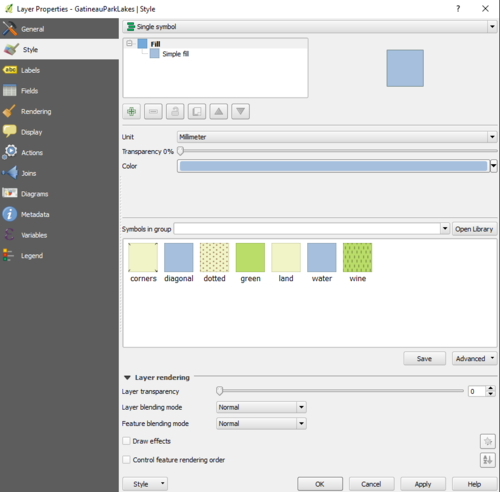
ArcMap and QGIS are two software programs that are able to produce high-quality maps in terms of symbology that are available for use. The way each program approaches symbology; however, is different.
Figure 12. The symbology interface in QGIS.
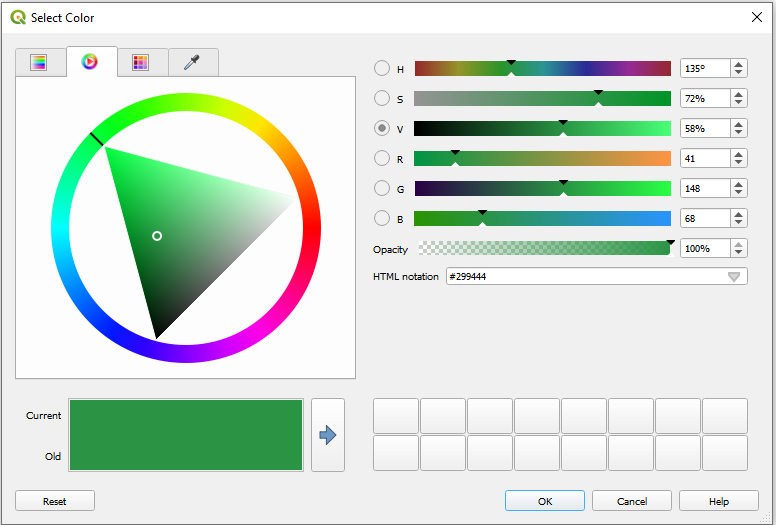
QGIS allows deeper colour customization for symbology using a colour wheel and colour gradient.
Figure 13. Colour Wheel In QGIS.
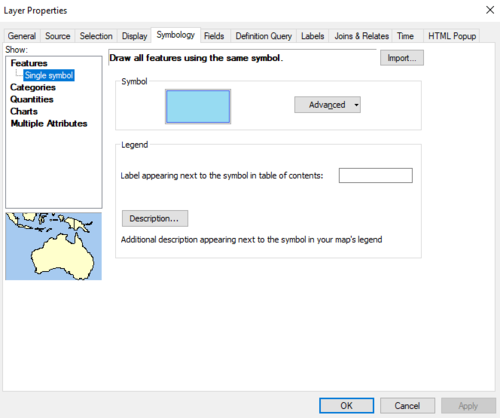
Figure 14. The symbology interface of ArcMap.
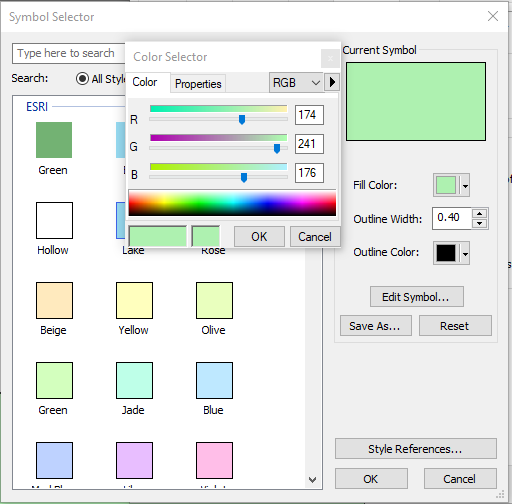
Figure 15. Colour Selector ArcMap
Both software programs have very similar capabilities for symbology possibilities and the tools surrounding symbology. The QGIS symbology interface can be more intuitive and user friendly - resembling to the likes of Photoshop; but ArcMap offers the very same features that are in QGIS, just presented in a different fashion.
Technical Support
As ArcMap software is an industry staple, the support network is very helpful. ESRI has hundreds of forms to help any problem, they can be found by searching the problem on google or at Esri Support
With QGIS there are numerous training manuals to help use the software. When it comes to troubleshooting that is where QGIS lacks. The support system relies on the users to help each other open forums on GIS Stackexchange. Its is very likely to find someone who has had the same or similar issue with QGIS.
Licensing
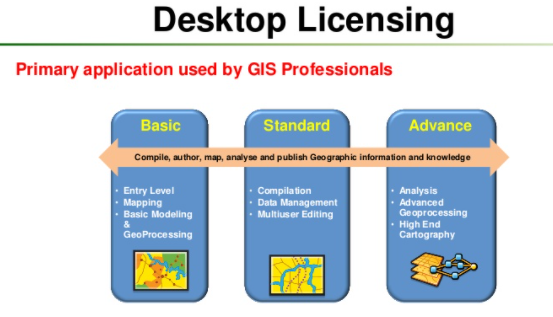
ArcGIS has a very good geoprocessing framework. Very solid. Very extensive. But your license level determines which tools you can use in ArcGIS. A basic license still gives you access to a large number of powerful tools. An advanced license gives you access to everything.
Now this part is important:
There are no license levels in QGIS. Open source QGIS software does not limit which tools can be used.
If you want to use the erase tool in ArcGIS 10, you’d have to turn on the advanced license. If there are no available advanced licenses, it means you can’t use the erase tool.
While ArcGIS requires a paid license which can be very expensive, QGIS in comparison is free. So, when it comes to comparing the licensing of QGIS and ArcGIS, QGIS is the more affordable option.
As both software are similar, the following table of comparisons gives more options to the user to make a decision on the software to use depending on the work to perform.
Differences QGIS ArcGIS
License Available for free Paid license Operating system Windows Windows Versions QGIS version 3.10 ArcMap version 10.7 Tools Some free tools Licensed tools hence paid File format accessibility Supports all formats Limited file formats Source Code Open Source Closed Source code Processing time Less Longer processing time Reliability More reliable Comparatively less reliable Mapping functions No advanced mapping functionalities Many advanced mapping functionalities Plugins Available Not available Tools availability Offers Plugin Library Offers various tools Accessibility Desktop accessibility Mobile accessibility Data Storage Relies on PostGIS File-based shapefiles Geodata Comparatively fewer options available More options available for geodata
Conclusion
Both software packages offer ample opportunity to create interesting and dynamic maps. While ArcMap is widely known and used as a standard in the field of GIS, it is important to consider other options -- particularly FOSS's like QGIS. Affordable mapping is possible, and hopefully this tutorial offered a basis of understanding to bridge the gap between the two software programs!
Happy Mapping!!!
