Difference between revisions of "Noise Modelling using OpeNoise in QGIS"
m (→Purpose) |
|||
| Line 3: | Line 3: | ||
===Purpose=== |
===Purpose=== |
||
| − | The objective of this tutorial is to help the user visualize the impact of sound and how it propagates from a location. The user will do this using the “opeNoise” Plugin in QGIS and create a noise map assessing the exposure to noise in a given area, due to the existence of different sources of noise. For this tutorial, the noise to be modelled is the impact of |
+ | The objective of this tutorial is to help the user visualize the impact of sound and how it propagates from a location. The user will do this using the “opeNoise” Plugin in QGIS and create a noise map assessing the exposure to noise in a given area, due to the existence of different sources of noise. For this tutorial, the noise to be modelled is the impact of Formula 1 race cars at Baku City Circuit, Azerbaijan. |
===Accessing opeNoise Plugin in QGIS=== |
===Accessing opeNoise Plugin in QGIS=== |
||
Revision as of 13:38, 12 January 2021
Contents
Introduction
Purpose
The objective of this tutorial is to help the user visualize the impact of sound and how it propagates from a location. The user will do this using the “opeNoise” Plugin in QGIS and create a noise map assessing the exposure to noise in a given area, due to the existence of different sources of noise. For this tutorial, the noise to be modelled is the impact of Formula 1 race cars at Baku City Circuit, Azerbaijan.
Accessing opeNoise Plugin in QGIS
To complete this tutorial the user will need to install QGIS and the opeNoise plugin:
1) Install QGIS 3.10 and open QGIS Desktop
2) when you open QGiS you are greeted by Recent QGIS news and Project templates. To begin click "New Empty Project"
2) Click "Plugins" on the ribbon at the top of the screen, then click "Manage/install plugins"
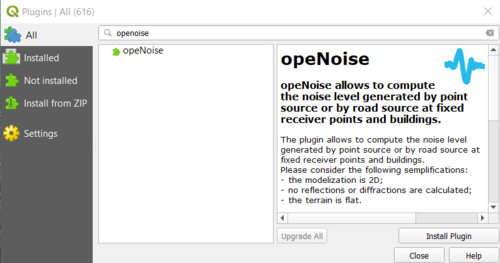
3) Search for opeNoise and click "Install Plugin". The user can then access opeNoise by clicking on the "Plugins" option on the ribbon.
Setting Coordinate Reference System(CRS)
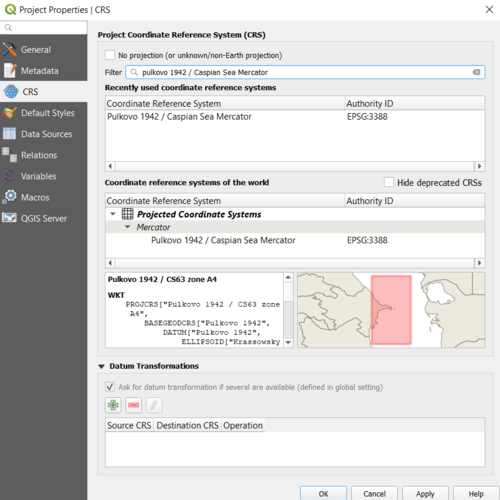
Before importing the required shapefile into QGIS, you must set a project coordinate system for your project file. Due to the study area being near the Caspian Sea we can use the "Pulkovo 1942/ Caspian Sea Mercator" projection to ensure accuracy in our analysis.
To change the projection in QGIS: press ctrl+ shift + p and click CRS. In the search bar type "Pulkovo 1942/ Caspian Sea Mercator" and click apply at the bottom of the screen.
Data
All data used for this tutorial is open source and shapefiles can be acquired at:
Baku City Street Circut and Baku Downtown Buildings
Download and Extract the contents of both flies
Adding Layers in QGIS
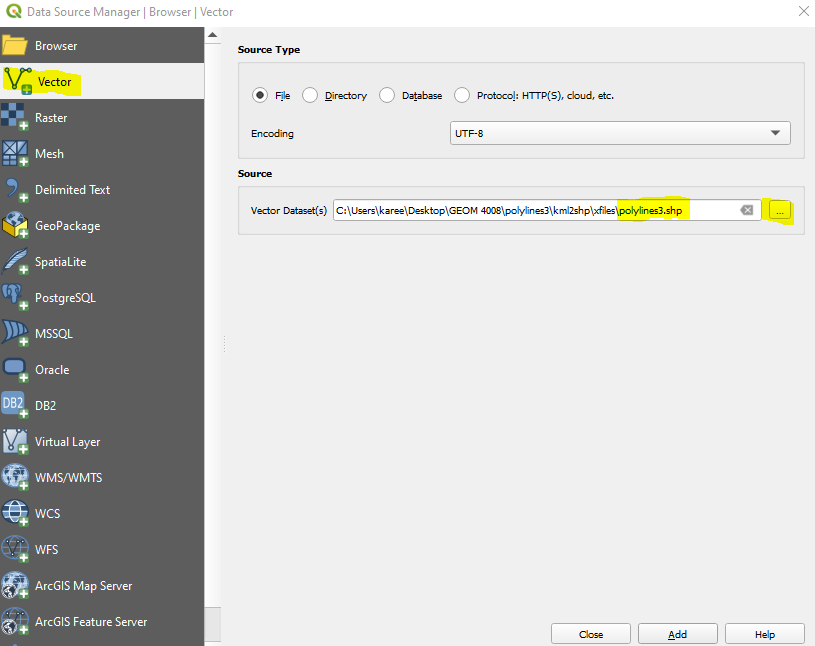
1) Press Ctrl + L to open the Data Source Manager in QGIS
2) Click on "Vector" in the list of options on the left side, under "source" like the three dots and add the files you downloads that end with .shp - then click Add
Once you have added both files we need to extract the Baku Circut from the "polylines3" layer
1) Right Click on the layer and select the attribute table
2) Under the column "NAME" find "nal Circuit", right click the number in the farthest left column so the row is highlighted blue
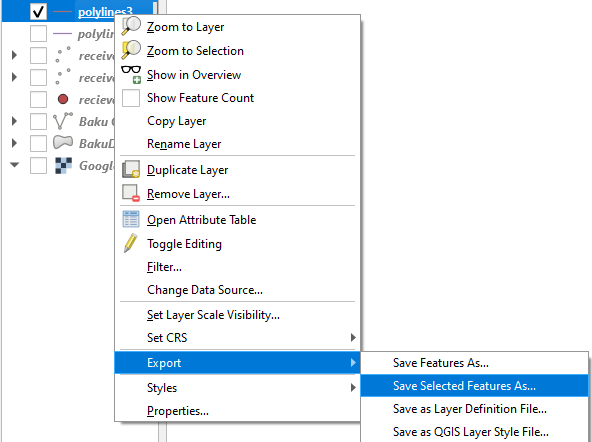
3) Close the attribute table and return to the project page, right click on polyines3 > hover over "Export" > then select "Save Selected Feature as"
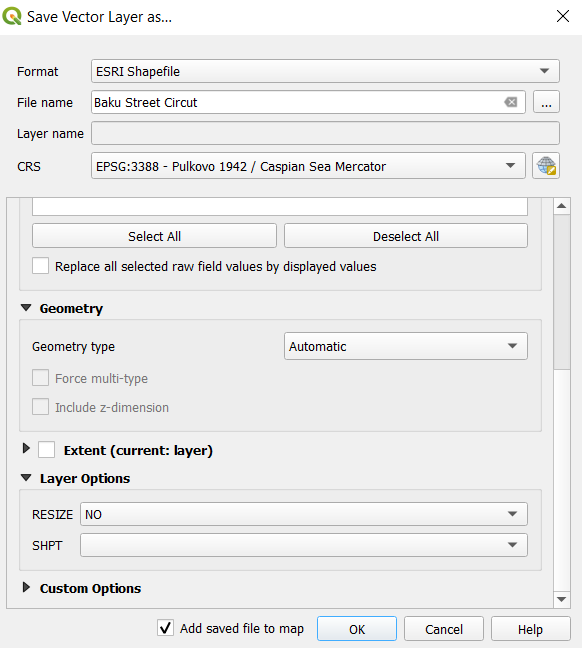
4) In the popup box save set the file name as "Bakustreetcircut", change the CRS to the Pulkovo 1942/ Caspian Sea Mercator from previous and click OK
Editing Attribute Tables
The user needs to add a decibel level to the Baku circuit layer for analysis
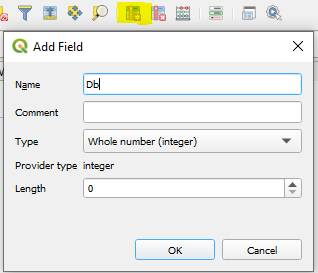
1) open the attribute table again, in the ribbon at the top click "Add new field" (sixth button from the right)
2) name the new field "Db", in the length section type "3" and press OK
3) Under the newly created "Db" column type "134" - this is the value for the decibel level of this track
4) Click the "save edits button"- the third option on the ribbon from the left
Using opeNoise
Creating Reciever Points
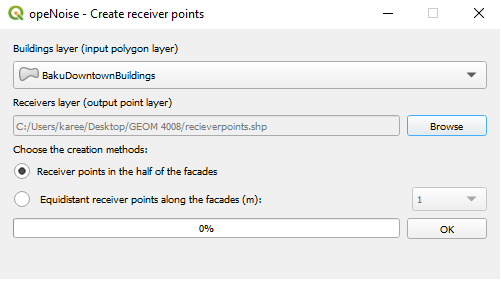
1) To begin click on plugins from the ribbon and hover over opeNoise. when the menu appears click on "Create Reciever Points". In the box that appears make sure that the "Building layer(input polygon layer)" dropdown box has the "BakuDowntownBuildings" shapefile as selected. In the "receiver layer" click browse and name the new shapefile "receiverpoints".
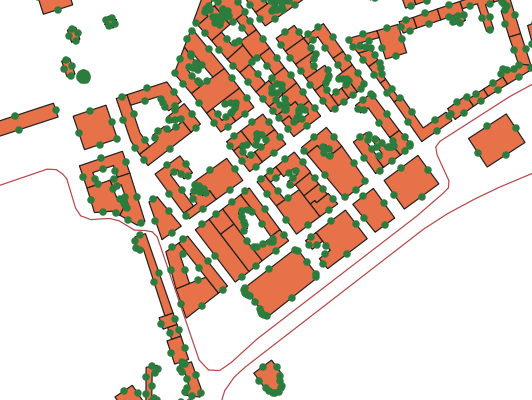
- Click "Ok"- the program will run and new points will populate facades of all the building shapefiles.
Calculate Noise levels
- For this Tutorial, a decibel level of 134 was chosen in accordance with the available literature on noise pollution of Formula 1 racecars. This value is given to the whole track and does not account for slow areas(corners) of the track where the decibel level would be decreased due to braking.
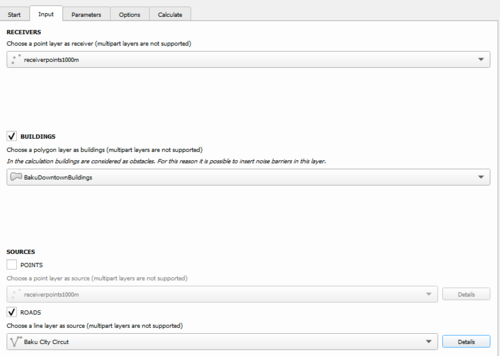
1) Return to the opeNoise dropdown window and select " Calculate Noise levels"
2) click the input tab- under "receivers" the point layer we created early should be selected.
3) Check the "buildings" box and select "BakuDownTownBuildings". Under "Sources" click the roads check box and choose "Baku City Circut"
4) Click the details button next to the Baku City Circut layer, in the top left select "NMPB(Power)". for data type check the "generic" box
5) in the first dropdown window below generic select the Sound Power level - B(A)- as "Db" and click OK
6) select the Parameters tab, under research ray(m) choose 1000
According to weather on race day for "atmospheric Absorption" change temperature(C) to 20 and Relative Humdity(RH%) to 70
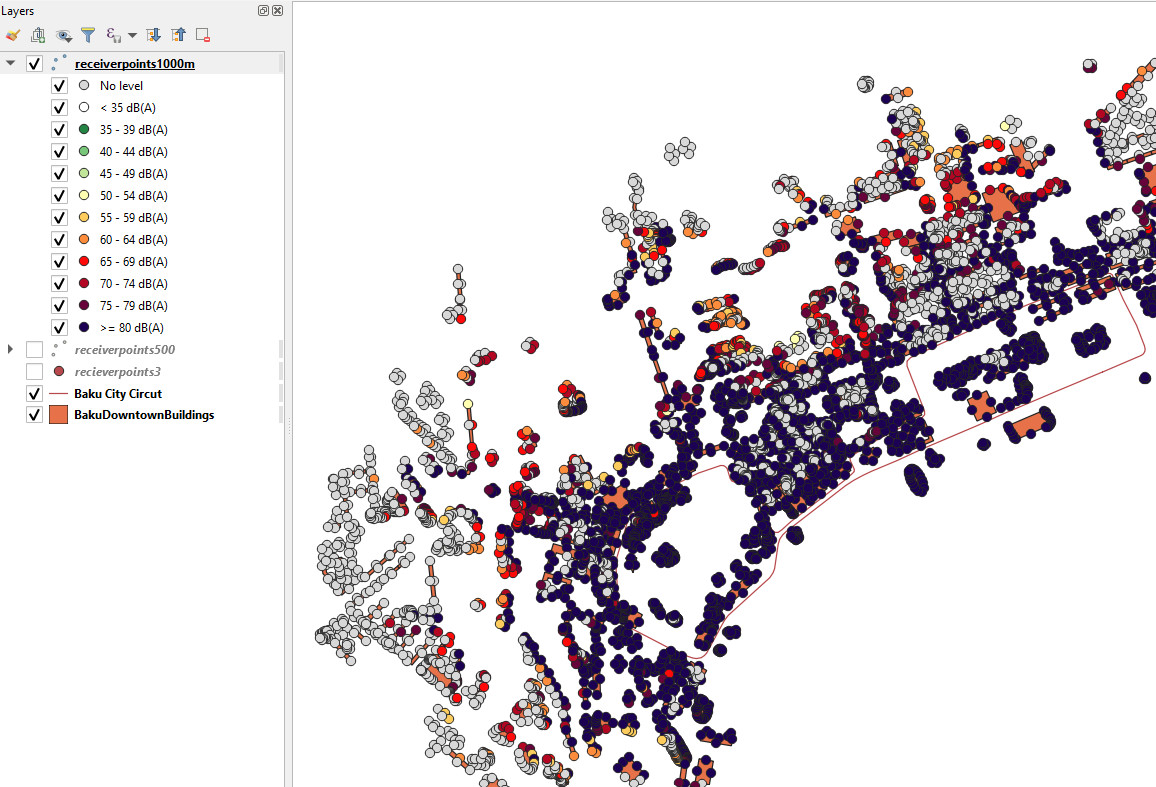
7) Go to the Calculate tab and click the calculate button this process may take between 1 and 2 hours depending on the users computing power
- Result of Calculate Noise levels assigns decibel values up to 1000 m from the sound source. Points beyond 1000m are gray and assigned "no level"
Assign Levels to Buildings
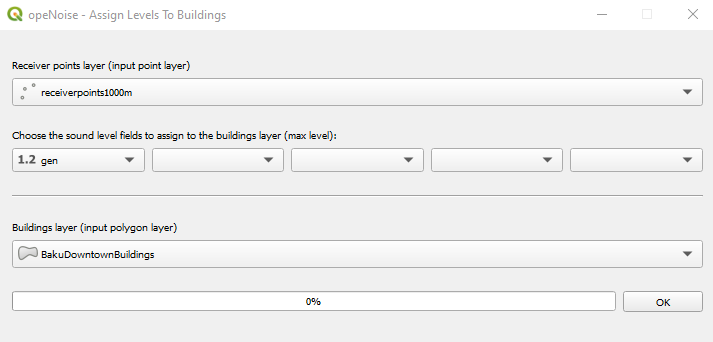
1) Return to the opeNoise Plugin and click on "Assign levels to buildings" - Press OK to the warning message
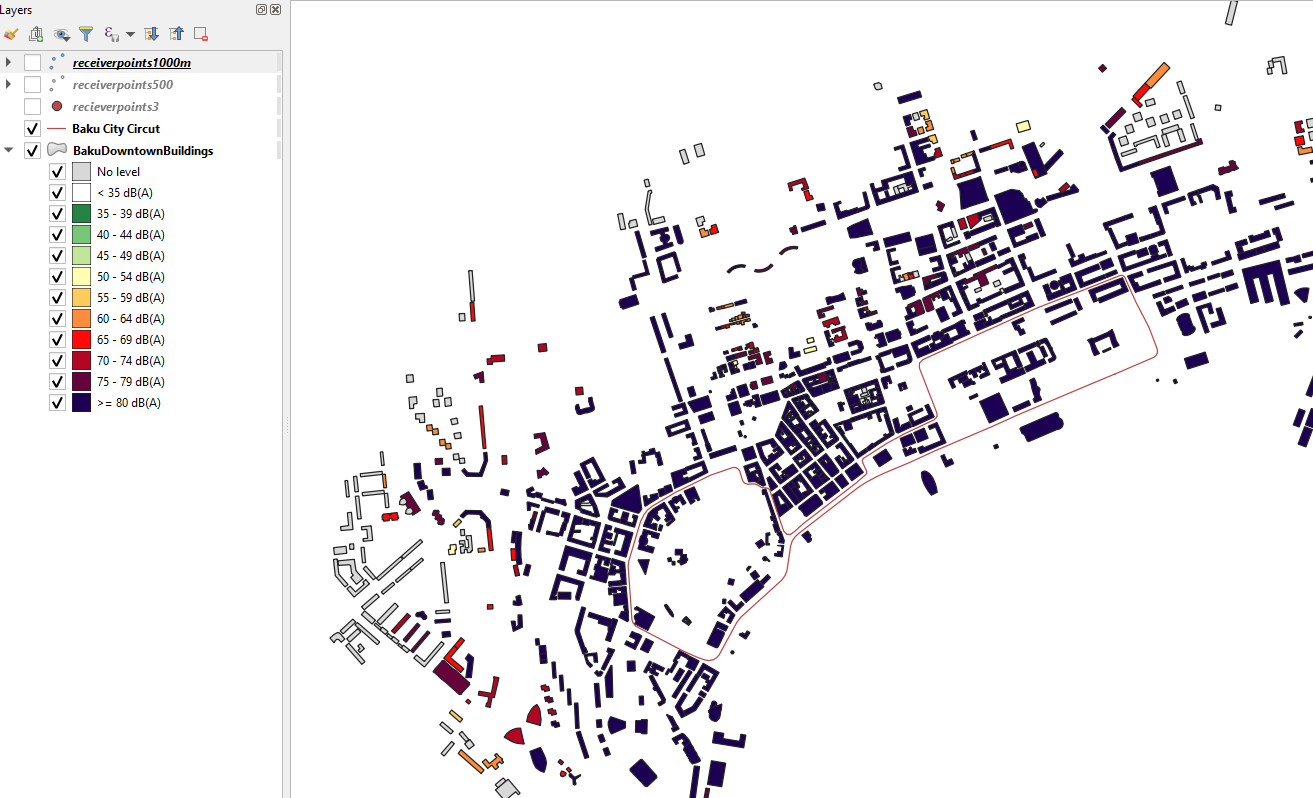
2) Make sure that the receiverpoints is selected for the receiver point layer, below the user receiver point click the first drop-down arrow and select "gen". Also check that the correct building layer has been chosen and press OK.
- Decibel values from receiver points have now been applied to the buildings, showing user how distance impact decibel levels
Conclusion & Limitations
The opeNoise plugin allows the user to create and visualize noise maps by modeling sound propagation of decible levels. The plugin is limited to showing propgation of noise up to 1000m from the given source of sound. This restricts the usage and accuracy of the plugin when dealing with high decibel levels.

