Difference between revisions of "Terrain Analysis with GRASS tools in QGIS"
Kirkhenike (talk | contribs) |
Kirkhenike (talk | contribs) |
||
| Line 4: | Line 4: | ||
| − | This Wiki page |
+ | This Wiki page was created for Advanced Topics in Geographic Information Systems (GEOM4008) students at Carleton University. The main purpose of this tutorial is to introduce and familiarize future users to understand the Raster Terrain analysis within Geographic Analysis and Support Systems (GRASS) tools in QGIS. Many familiar topics will touched upon, know that a basic understanding of geomatics or similar fields of study are needed as the complexity and the terminology are subjective based on geomatics and data processing like techniques. |
== 2 Objective == |
== 2 Objective == |
||
| − | The purpose of this tutorial is to touch on the concept of terrain based analysis using raster data. It will also include a work flow with detailed information into each step as to why the specified steps are important. Other general concepts and functionalities are also to be found with quick tips and tricks. Due to the specificity of GRASS tools and the QGIS workspace many steps will have to be repeated to ensure proper procedures and develop the appropriate data. The Area Of Interest (AOI) includes Gatineau Park, this analysis details the steps to create an elevation and depression model based on various resolutions. |
+ | The purpose of this tutorial is to touch on the concept of terrain based analysis using raster data. It will also include a work flow with detailed information into each step as to why the specified steps are important. Other general concepts and functionalities are also to be found with quick tips and tricks. Due to the specificity of GRASS tools and the QGIS workspace many steps will have to be repeated to ensure proper procedures and develop the appropriate data. The Area Of Interest (AOI) includes Gatineau Park, this analysis details the steps to create an elevation and depression model based on various resolutions. One can find supporting literature and videos linked in the Reference section. |
== 3 Data == |
== 3 Data == |
||
| − | The |
+ | The type of raster data that is to be used is referred to as DEM or Digital Elevation Model, it contains information that is specific to determining things like Aspect and Slope. Slope and Aspect are important as they refer to the degree of pitch, the length of the pitch and the direction of the pitch. The combination of these two data inputs will create the model by witch we can analyze various depressions and flow pathways in the AOI (Area of Interest) or Gatineau Park. |
== 4 Methods and Data Setup == |
== 4 Methods and Data Setup == |
||
| Line 24: | Line 24: | ||
• [http://qgis.org/en/site/forusers/download.html Click this link to download]. |
• [http://qgis.org/en/site/forusers/download.html Click this link to download]. |
||
| − | • Choose which version is compatible with the computer you are working on. Follow the steps in the pop-up downloading window |
+ | • Choose which version is compatible with the computer you are working on. Follow the steps in the pop-up downloading window. |
• Know there are many sources that can provide QGIS work space software packages. For this tutorial, the link and the steps below are specific to this source and the available versions of QGIS. |
• Know there are many sources that can provide QGIS work space software packages. For this tutorial, the link and the steps below are specific to this source and the available versions of QGIS. |
||
| Line 35: | Line 35: | ||
• Click the QGIS icon to open the program.[[File:qgis.jpg]] This will open the QGIS window. |
• Click the QGIS icon to open the program.[[File:qgis.jpg]] This will open the QGIS window. |
||
| − | • After the QGIS opens up, add the Raster data to QGIS space as detailed below |
+ | • After the QGIS opens up, add the Raster data to QGIS space as detailed below... |
'''4.3 Adding Raster Layers to QGIS''' |
'''4.3 Adding Raster Layers to QGIS''' |
||
| − | • Find and click [[File:addraster.jpg]] Add Raster layer to |
+ | • Find and click [[File:addraster.jpg]] Add the Raster layer to the data set. |
| − | • Once the data has been added, right click on the data properties to set the projection to the |
+ | • Once the data has been added, right click on the data properties to set the projection to the proper projection and coordinate system: |
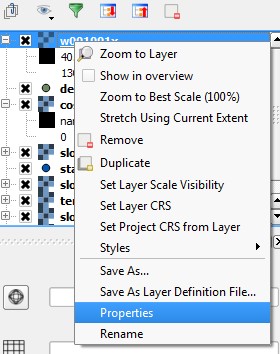
• Go to Properties.[[File:properties.jpg]] |
• Go to Properties.[[File:properties.jpg]] |
||
| Line 61: | Line 61: | ||
• Enter GRASS in the search menu to install or if the plugin is already installed, it will be an option under the Installed column, select it here. |
• Enter GRASS in the search menu to install or if the plugin is already installed, it will be an option under the Installed column, select it here. |
||
| − | • After |
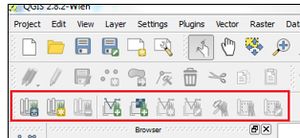
+ | • After it is installed, the GRASS toolbar layer will appear on the user interface. |
[[File:grasstools.jpg|300px|]] |
[[File:grasstools.jpg|300px|]] |
||
| Line 67: | Line 67: | ||
'''4.5 Creating GRASS Database''' |
'''4.5 Creating GRASS Database''' |
||
| − | • A GRASS Database is require to use these |
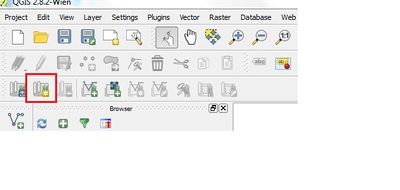
+ | • A GRASS Database is require to use these processes. Similar as a work space in ArcMap, the same should be done, however a designated save location is much more user friendly if one plans to use this software on more than one occasion. To create the GRASS database, click on the New Map Set boxed in red. |
[[File:nhm16.jpg|400px]] |
[[File:nhm16.jpg|400px]] |
||
| − | • In the new map set |
+ | • In the new map set browse to your existing directory or create a new one and then click next. |
[[File:nhm17.jpg|300]] |
[[File:nhm17.jpg|300]] |
||
| Line 81: | Line 81: | ||
[[File:nhm19.jpg|400px]] |
[[File:nhm19.jpg|400px]] |
||
| − | • Set up the extent or the GRASS default region by clicking on: set current QGIS extent |
+ | • Set up the extent or the GRASS default region by clicking on: set current QGIS extent, also the default GRASS region N, W, E and E can be entered. Keep in mind the AOI (Area of Interest), because the workflow is based on Gatineau Park, the values should be appropriate to the AOI's geographic region. |
[[File:nhm.jpg|350px]] |
[[File:nhm.jpg|350px]] |
||
| Line 107: | Line 107: | ||
[[File:nhm24.jpg|400px]] |
[[File:nhm24.jpg|400px]] |
||
| − | • When the below pops up, find File Management > Import Into GRASS > Import Raster Into GRASS > Import Raster Into GRASS From QGIS View. This will provide an series of redacted words. This is because a command series can be used to perform these operations. |
+ | • When the below pops up, find File Management > Import Into GRASS > Import Raster Into GRASS > Import Raster Into GRASS From QGIS View. This will provide an series of redacted words. This is because a command series can be used to perform these operations in a program supported by python. |
[[File:nhm25.jpg|400px]] |
[[File:nhm25.jpg|400px]] |
||
| Line 115: | Line 115: | ||
[[File:nhm26.jpg|400px]] |
[[File:nhm26.jpg|400px]] |
||
| − | • Then select layer from loaded layer > give output name > Run. It is wise to name the imported raster accordingly as this may become confusing as there can be many iterations of the same data at different scales or elements. |
+ | • Then select the layer from loaded layer > give output name > Run. It is wise to name the imported raster accordingly as this may become confusing as there can be many iterations of the same data at different scales or elements in the future. |
[[File:nhm27.jpg|400px]] |
[[File:nhm27.jpg|400px]] |
||
| Line 127: | Line 127: | ||
'''5.3.1 To run these tools.''' |
'''5.3.1 To run these tools.''' |
||
| − | • GRASS Modules > Raster > Spatial Analysis > Terrain analysis. There are a lot of Terrain |
+ | • GRASS Modules > Raster > Spatial Analysis > Terrain analysis. There are a lot of Terrain Analysis tools available for various operations.If needed familiarize ones self with the different options. Here we are simply demonstrating the one process. |
[[File:nhmterrian.jpg|300]] |
[[File:nhmterrian.jpg|300]] |
||
| Line 156: | Line 156: | ||
== Sources of Error == |
== Sources of Error == |
||
| − | • Many of the sources of error are user or administration based, what is meant by this, understanding ones own nomenclature. Though this seams simple in this example, as more |
+ | • Many of the sources of error are user or administration based, what is meant by this, understanding ones own nomenclature. Though this seams simple in this example, as more renderings are produced of the same area with different levels of scale, changing the resolution between each scale set and ensuring the analysis produced is not biased in any way. Bias' may include incorrect matching of DEM and Raster resolutions, a difference in projections and so on. |
• Know that many other sources of error do exist, those mentioned above only included user error and not error in the original data. This workflow assumes the original data is accurate before any analysis is conducted. |
• Know that many other sources of error do exist, those mentioned above only included user error and not error in the original data. This workflow assumes the original data is accurate before any analysis is conducted. |
||
| Line 162: | Line 162: | ||
== Conclusion == |
== Conclusion == |
||
| − | We have successfully demonstrated how to use various |
+ | We have successfully demonstrated how to use various Terrain Analysis tools offered in the free and open source software of GRASS within QGIS using a DEM of the Gatineau Park region. The Raster Terrain Analysis Plugin can be used to calculate the slope, aspect, hill shade, ruggedness index and relief for digital elevation models (DEM). It is very simple to handle and provides an intuitive graphical user interface for creating new raster layers. This workflow is a preliminary understanding of the basic functions available with GRASS plugins, different types of manipulations as mentioned can be conducted easily under this platform. Many different sources of literature can be found online to provide more theoretical understanding into the processing methods and how to curtail the analysis process to develop different data sets as well as work around's. Below one can find some links to literature, they discuss various DEM processing and application methods. Additional "How To" links for Youtube videos have been linked for an in action use of the GRASS programs and plugins. |
== Reference == |
== Reference == |
||
Revision as of 20:56, 19 October 2017
Contents
1 Introduction
This Wiki page was created for Advanced Topics in Geographic Information Systems (GEOM4008) students at Carleton University. The main purpose of this tutorial is to introduce and familiarize future users to understand the Raster Terrain analysis within Geographic Analysis and Support Systems (GRASS) tools in QGIS. Many familiar topics will touched upon, know that a basic understanding of geomatics or similar fields of study are needed as the complexity and the terminology are subjective based on geomatics and data processing like techniques.
2 Objective
The purpose of this tutorial is to touch on the concept of terrain based analysis using raster data. It will also include a work flow with detailed information into each step as to why the specified steps are important. Other general concepts and functionalities are also to be found with quick tips and tricks. Due to the specificity of GRASS tools and the QGIS workspace many steps will have to be repeated to ensure proper procedures and develop the appropriate data. The Area Of Interest (AOI) includes Gatineau Park, this analysis details the steps to create an elevation and depression model based on various resolutions. One can find supporting literature and videos linked in the Reference section.
3 Data
The type of raster data that is to be used is referred to as DEM or Digital Elevation Model, it contains information that is specific to determining things like Aspect and Slope. Slope and Aspect are important as they refer to the degree of pitch, the length of the pitch and the direction of the pitch. The combination of these two data inputs will create the model by witch we can analyze various depressions and flow pathways in the AOI (Area of Interest) or Gatineau Park.
4 Methods and Data Setup
4.1 QGIS Setup
Before beginning the tutorial install QGIS version 2.8.2; first, download QGIS to your computer.
Please follow the steps below:
• Click this link to download.
• Choose which version is compatible with the computer you are working on. Follow the steps in the pop-up downloading window.
• Know there are many sources that can provide QGIS work space software packages. For this tutorial, the link and the steps below are specific to this source and the available versions of QGIS.
4.2 Opening QGIS
• Once you completed the installation and found all the data you want to use, create a folder in your computer and place the data in this folder.
• Click the QGIS icon to open the program. This will open the QGIS window.
• After the QGIS opens up, add the Raster data to QGIS space as detailed below...
4.3 Adding Raster Layers to QGIS
• Find and click ![]() Add the Raster layer to the data set.
Add the Raster layer to the data set.
• Once the data has been added, right click on the data properties to set the projection to the proper projection and coordinate system:
• Go to General, search or select the right coordinate system from coordinate reference system. The projection displayed "NAD83/UTM zone 18N" is specific for data that is to be analysised. Other suitable projections for this application include "Lambert Conformal Conic" and "WGS 1984".
4.4 Installing and Setting up the GRASS Plugin
After the initial QGIS window has been opened and data added, next the GRASS Plugin be installed. The GRASS Plugin allows the tools from GRASS to be used within QGIS.
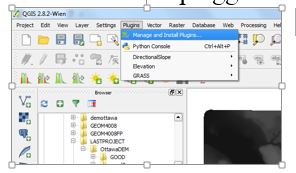
• To add GRASS pluggin , find Plugins in the menue bar, then Manage and Install Plugins in the drop down menue
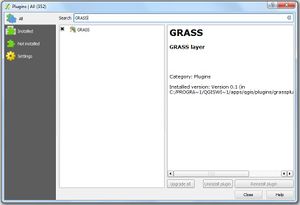
• Enter GRASS in the search menu to install or if the plugin is already installed, it will be an option under the Installed column, select it here.
• After it is installed, the GRASS toolbar layer will appear on the user interface.
4.5 Creating GRASS Database
• A GRASS Database is require to use these processes. Similar as a work space in ArcMap, the same should be done, however a designated save location is much more user friendly if one plans to use this software on more than one occasion. To create the GRASS database, click on the New Map Set boxed in red.
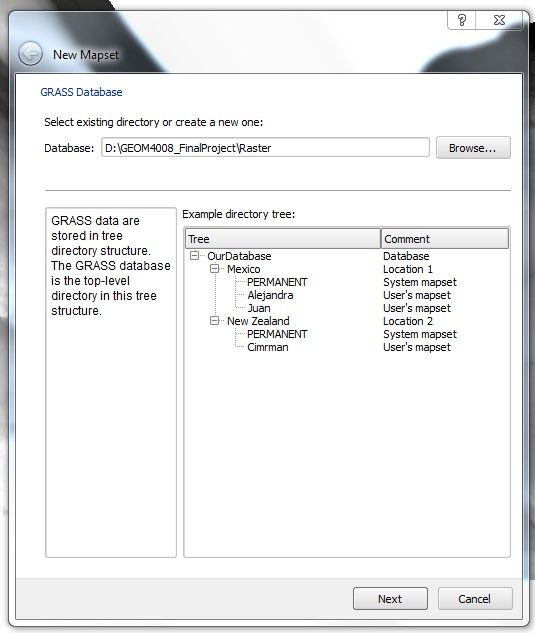
• In the new map set browse to your existing directory or create a new one and then click next.
• To create the GRASS location, click on create new location and name it appropriately and click next.
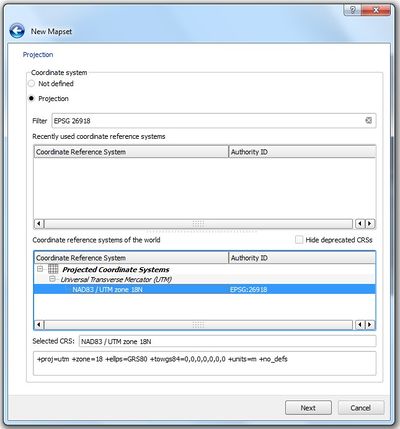
• Setting up the projection, search or select the coordinate reference system using filter tool or by selection from the exiting. It is highly suggested to use the same projection as mentioned in section 4.3. Though some may be similar in fashion, keeping them congruent is the most efficient way.
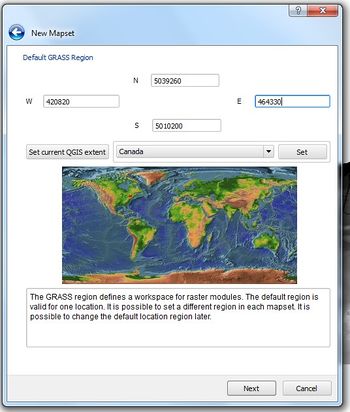
• Set up the extent or the GRASS default region by clicking on: set current QGIS extent, also the default GRASS region N, W, E and E can be entered. Keep in mind the AOI (Area of Interest), because the workflow is based on Gatineau Park, the values should be appropriate to the AOI's geographic region.
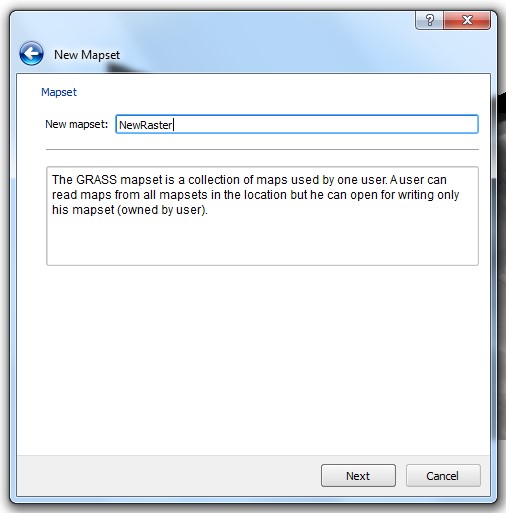
• Finally create the GRASS new mapset by giving it appropriate name. Name the mapset appropriately.
Data Processing
5.1 Editing the Current GRASS Region
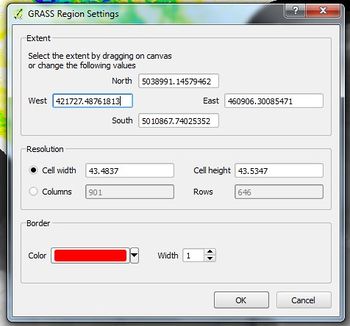
• Because map extents can be so large, they often take a little while to finish processing, it is suggested to set the extent to minimize processing time. To set the extent, click on the current GRASS region icon displayed.
• The settings window will pop up, there are two ways to set the extent, this can be done manually or by coordinates. Manually refers to drawing the AOI, while coordinates simply refer to furthest extents of each vortice in the AOI.
5.2 Importing Raster to GRASS Format
• To import a raster to GRASS area in question, click on the Open GRASS Tools
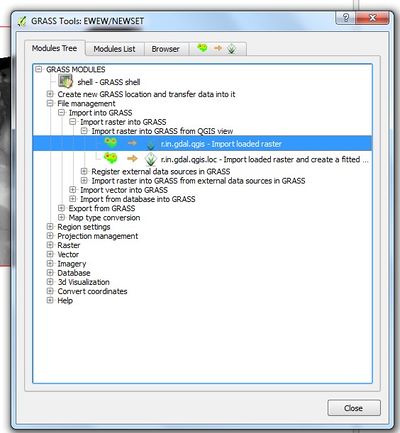
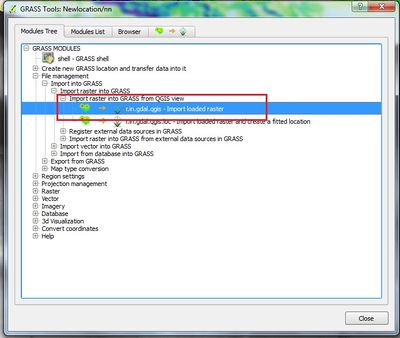
• When the below pops up, find File Management > Import Into GRASS > Import Raster Into GRASS > Import Raster Into GRASS From QGIS View. This will provide an series of redacted words. This is because a command series can be used to perform these operations in a program supported by python.
• The command series options looks as follows "r.in.gdal.qgis-Import loaded raster". Click the option, it will then prompt you to menu to import the desired raster. It is wise to have saved the raster in the GRASS workspace mentioned earlier as it will store all relevant data for this project in the same location.
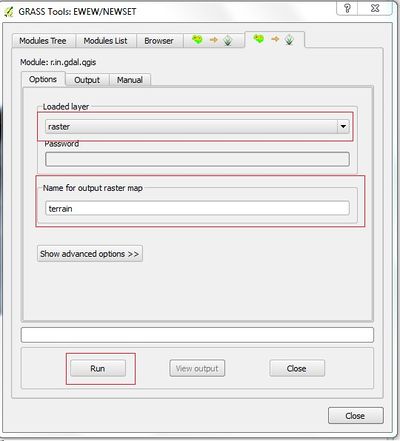
• Then select the layer from loaded layer > give output name > Run. It is wise to name the imported raster accordingly as this may become confusing as there can be many iterations of the same data at different scales or elements in the future.
• The data is now stored within the added GRASS database, the original files can be removed, this can be done in the GRASS tool set for vector and raster data. Use ones discretion whether to delete the original data, it can often be useful to keep in the event there is an error or more iterations need to be performed, though it may cluster lists and data sets. This is why properly designating data sets with specificity is important.
5.3 Exploring Terrain Analysis Tools in the GRASS Modules
5.3.1 To run these tools.
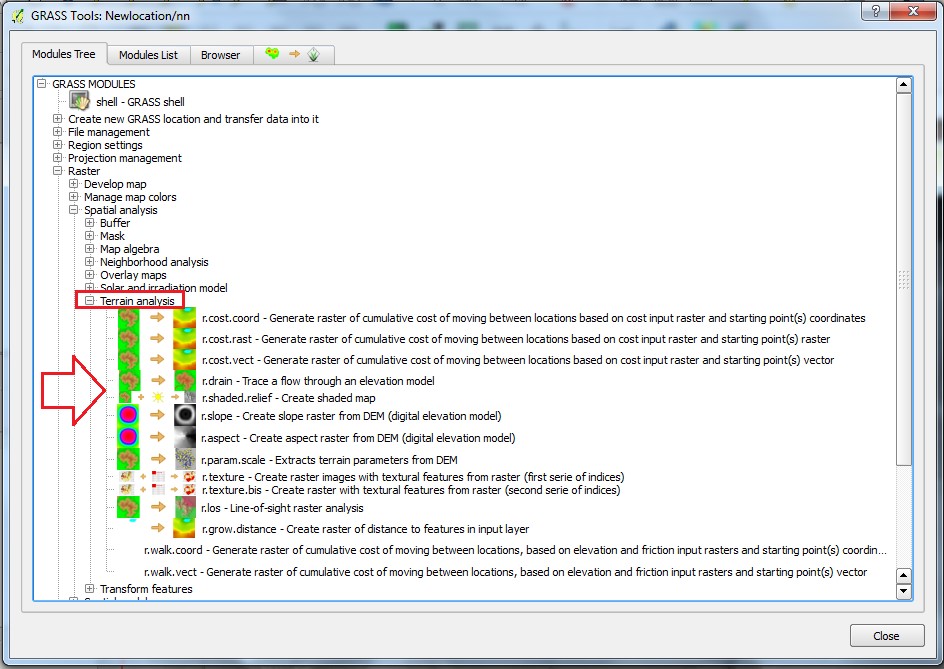
• GRASS Modules > Raster > Spatial Analysis > Terrain analysis. There are a lot of Terrain Analysis tools available for various operations.If needed familiarize ones self with the different options. Here we are simply demonstrating the one process.
5.3.2 To create slope raster from DEM
• Select r. slope - "Create slope raster from DEM" from the Terrain analysis tool box.
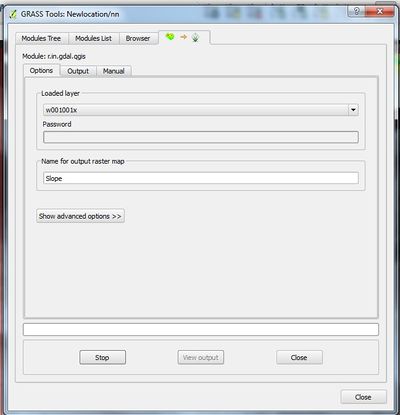
• After the tool has been selected, select the DEM data from elevation raster map > name the output slope raster map > click Run.
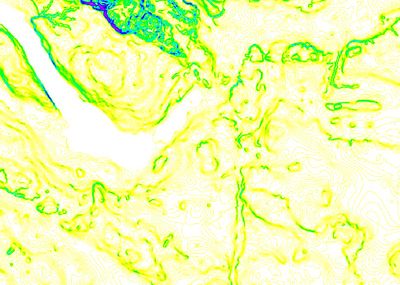
• To view the map click on view output.
5.3.3 Creating Aspect Raster from DEM.
• Select r.aspect - create aspect raster from DEM from Terrain analysis tool box.
• After selecting the tool again, select the DEM data from elevation raster map > name the output slope raster map > click Run. As it is shown in the previous steps. 5.3.1 - 5.3.3
Sources of Error
• Many of the sources of error are user or administration based, what is meant by this, understanding ones own nomenclature. Though this seams simple in this example, as more renderings are produced of the same area with different levels of scale, changing the resolution between each scale set and ensuring the analysis produced is not biased in any way. Bias' may include incorrect matching of DEM and Raster resolutions, a difference in projections and so on.
• Know that many other sources of error do exist, those mentioned above only included user error and not error in the original data. This workflow assumes the original data is accurate before any analysis is conducted.
Conclusion
We have successfully demonstrated how to use various Terrain Analysis tools offered in the free and open source software of GRASS within QGIS using a DEM of the Gatineau Park region. The Raster Terrain Analysis Plugin can be used to calculate the slope, aspect, hill shade, ruggedness index and relief for digital elevation models (DEM). It is very simple to handle and provides an intuitive graphical user interface for creating new raster layers. This workflow is a preliminary understanding of the basic functions available with GRASS plugins, different types of manipulations as mentioned can be conducted easily under this platform. Many different sources of literature can be found online to provide more theoretical understanding into the processing methods and how to curtail the analysis process to develop different data sets as well as work around's. Below one can find some links to literature, they discuss various DEM processing and application methods. Additional "How To" links for Youtube videos have been linked for an in action use of the GRASS programs and plugins.
Reference
Download QGIS for your platform: http://qgis.org/en/site/forusers/download.html. [Web] accessed: Dec 22, 2015. GRASS GIS Integration: https://docs.qgis.org/2.8/en/docs/user_manual/grass_integration/grass_integration.html. [Web] accessed: Dec 22, 2015. QGIS Application : http://hub.qgis.org/projects/quantumgis/wiki/Adding_New_Tools_to_the_GRASS_Toolbox. [Web] accessed: Dec 22, 2015. DEM Raster Resolution and Order Sequencing : http://onlinelibrary.wiley.com/doi/10.1111/j.1467-9671.2004.00169.x/epdf. [Web] accessed Oct 18, 2017. Watershed Basin Analysis Using GRASS : https://www.youtube.com/watch?v=6BQltTwsU7A. [Web] accessed Oct 18, 2017.
