Difference between revisions of "User:Brettbechamp"
Brettbechamp (talk | contribs) |
Brettbechamp (talk | contribs) |
||
| Line 1: | Line 1: | ||
= Introduction and Purpose = |
|||
The analysis of multispectral imagery is useful for a detecting a wide range of geospatial patterns that would otherwise not show in visible spectrum imagery. The purpose of this tutorial will be to familiarize you with concepts related to landcover classification based on multispectral imagery, and to expose you to SAGA GIS; an application for geospatial analysis. |
The analysis of multispectral imagery is useful for a detecting a wide range of geospatial patterns that would otherwise not show in visible spectrum imagery. The purpose of this tutorial will be to familiarize you with concepts related to landcover classification based on multispectral imagery, and to expose you to SAGA GIS; an application for geospatial analysis. |
||
= Software = |
|||
To perform the tasks described below, you will need to dowload SAGA from [https://sourceforge.net/projects/saga-gis/ sourceforge.net] |
To perform the tasks described below, you will need to dowload SAGA from [https://sourceforge.net/projects/saga-gis/ sourceforge.net] |
||
| Line 14: | Line 14: | ||
[[File:SAGA GUI.JPG | Left | 800px]] |
[[File:SAGA GUI.JPG | Left | 800px]] |
||
= Data = |
|||
The sample data used for the creation of this tutorial came from the Ontario SPOT Pansharpened Orthoimagery dataset. The dataset can be found on scholar's geoportal [http://geo2.scholarsportal.info/#r/details/_uri@=2870907016 Here]. |
The sample data used for the creation of this tutorial came from the Ontario SPOT Pansharpened Orthoimagery dataset. The dataset can be found on scholar's geoportal [http://geo2.scholarsportal.info/#r/details/_uri@=2870907016 Here]. |
||
Revision as of 10:48, 20 December 2018
Contents
Introduction and Purpose
The analysis of multispectral imagery is useful for a detecting a wide range of geospatial patterns that would otherwise not show in visible spectrum imagery. The purpose of this tutorial will be to familiarize you with concepts related to landcover classification based on multispectral imagery, and to expose you to SAGA GIS; an application for geospatial analysis.
Software
To perform the tasks described below, you will need to dowload SAGA from sourceforge.net
SAGA GUI interface
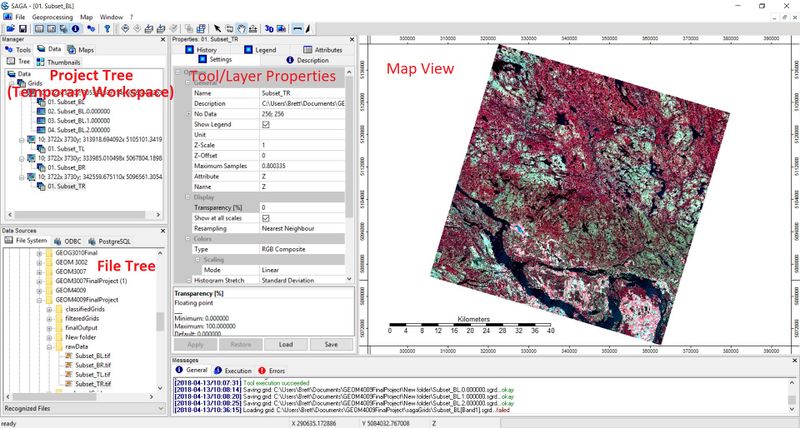
Here is the basic layout of SAGA GIS. Notice the multi-pained format. The project tree or temporary work space is in the top left. This where you'll find all of your project data as well as access SAGA's array of Geoprocessing tools. You can navigate between data view, map layer view, tools, and thumbnails using the tabs at the top of the temporary work space. Below that is the file tree. There is not a lot to be said about this area; It is where you can look up files and folders in order to add data. Beside the file tree is the Tool/layer properties window. This is where you will enter tool parameters, look up layer properties, analyse look up tables and set display parameters for you data. To the right, is the map view; fairly self explanatory.
Data
The sample data used for the creation of this tutorial came from the Ontario SPOT Pansharpened Orthoimagery dataset. The dataset can be found on scholar's geoportal Here. The data is three band, false-colour composite imagery with bands NIR-R-G. This combination of spectral bands is often used for the study of vegetation due to the high NIR reflectance of foliage. The dataset was collected with the SPOT satellite between 2005 and 2010. The pixel size for this imagery is 20m and each scene covers a geographic area of 40km by 40km.
Classification Workflow
Getting Started
After you open SAGA, in order to view the data you must first select:
File -> Open
and navigate to the desired image
Clipping the Imagery
The imagery as it comes from scholar's Geoportal, covers a very large area with a relatively high resolution and therefore, is a very large file (~150mb). In order to improve processing speed and ensure that SAGA does not crash during the classification process, we will first clip a more manageable subset from the larger image. To do this, first click on the tools tab at the top of the temporary work space.
