Difference between revisions of "Exploring Hydrological Analyses using ILWIS"
| Line 422: | Line 422: | ||
''Figure 40 - Drainage Network Order output table'' |
''Figure 40 - Drainage Network Order output table'' |
||
| + | |||
| + | |||
| + | ===DEM Visualisation=== |
||
| + | |||
| Line 470: | Line 474: | ||
This tutorial covers the most basic hydrological tools for a more simple and basic hydrological analysis using ILWIS. Operations that have not been covered but should be considered when desiring a more in-depth and accurate analysis include: |
This tutorial covers the most basic hydrological tools for a more simple and basic hydrological analysis using ILWIS. Operations that have not been covered but should be considered when desiring a more in-depth and accurate analysis include: |
||
| + | * Flow Modification |
||
| − | * DEM Visualization |
||
| − | * [http://spatial-analyst.net/ILWIS/htm/ilwisapp/ |
+ | ** [http://spatial-analyst.net/ILWIS/htm/ilwisapp/dem_optimization_functionality.htm DEM Optimization] |
| − | * [http://spatial-analyst.net/ILWIS/htm/ilwisapp/ |
+ | ** [http://spatial-analyst.net/ILWIS/htm/ilwisapp/topological_optimization_functionality.htm Topological Optimization] |
| − | * [http://spatial-analyst.net/ILWIS/htm/ilwisapp/ |
+ | * [http://spatial-analyst.net/ILWIS/htm/ilwisapp/variable_threshold_computation_functionality.htm Variable Threshold Computation] |
| + | *Network and Catchment Extraction |
||
| ⚫ | |||
| − | * [http://spatial-analyst.net/ILWIS/htm/ilwisapp/ |
+ | ** [http://spatial-analyst.net/ILWIS/htm/ilwisapp/catchment_extraction_functionality.htm Catchment Extraction] |
| ⚫ | |||
| − | ** Wetness Index |
||
| ⚫ | |||
| − | ** Stream Power Index |
||
| + | ** [ Flow Length to Outlet] |
||
| − | ** Sediment Transport Index |
||
| + | ** [ Flow Path Longitudinal Profile] |
||
| ⚫ | |||
| + | ** [http://spatial-analyst.net/ILWIS/htm/ilwisapp/compound_parameter_extraction.htm Compound Index Calculation] (includes the Wetness Index, Stream Power Index, and Sediment Transport Index) |
||
| + | * Statistical Parameter Extraction |
||
** [http://spatial-analyst.net/ILWIS/htm/ilwisapp/horton_statistics_functionality.htm Horton Statistics] |
** [http://spatial-analyst.net/ILWIS/htm/ilwisapp/horton_statistics_functionality.htm Horton Statistics] |
||
** [http://spatial-analyst.net/ILWIS/htm/ilwisapp/aggregate_statistics.htm Aggregate Statistics] |
** [http://spatial-analyst.net/ILWIS/htm/ilwisapp/aggregate_statistics.htm Aggregate Statistics] |
||
Revision as of 13:46, 3 October 2019
Contents
- 1 Purpose
- 2 Introduction to ILWIS
- 3 Methods
- 3.1 Software Download and Installation
- 3.2 Data Sourcing
- 3.3 Starting ILWIS
- 3.4 Importing a DEM
- 3.5 Projecting a DEM
- 3.6 Fill Sinks in a DEM
- 3.7 Flow Direction
- 3.8 Flow Accumulation Map
- 3.9 Drainage Network
- 3.10 DEM Visualisation
- 3.11 Overland Flow Length
- 3.12 Not Covered in this Tutorial
- 3.13 Additional Resources
- 4 Conclusion
- 5 References
Purpose
This Wiki tutorial has been produced for the purpose of exploring and describing the methods used for hydrological analyses in ILWIS (a FOSS4G program). The objective of this tutorial is to provide users with a better understanding of how the hydrological analyses within ILWIS works, in addition to providing the instructions necessary to reach the desired output for their study region. Additionally, this tutorial will allow for comparison of ILWIS and SAGA GIS, using the same data for analysis as the Exploring Hydrological Analyses using SAGA GIS tutorial from 2013.
This project will focus on hydrological analysis of Okanagan Lake, a popular tourist destination in British Columbia, Canada. The tutorial will cover topics such as Aspect mapping, Slope mapping, Watershed Delineation mapping and Wetness Index mapping through the use of ILWIS hydrological analysis tools.
Introduction to ILWIS
ILWIS stands for "Integrated Land and Water Information System". It is an open source Geographic Information System software program that was designed to be a user-friendly integrated software that contains both raster and vector processing capabilities, allowing for both analyses on remotely sensed images, vector maps and numerous spatial modeling abilities. ILWIS was developed by the International Institute for Aerospace Survey and Earth Sciences (ITC) in The Netherlands. This tutorial will focus on its ability to use Digital Elevation Models (DEMs) to run hydrological analyses of a study region. More information about this product can be found on the ILWIS Website
Methods
Software Download and Installation
ILWIS 3.8.5 can be downloaded for free from the GitHub page for 52 North. This is the most recent version of ILWIS 3 and was released on September 3, 2015. Since the release of this version, the ITC has released ILWIS 4. It is likely that new versions of ILWIS 3 will eventually stop being released, as the capabilities of ILWIS 4 become greater. More information about ILWIS 4 can be found on the ILWIS 4 website.
Data Sourcing
In order to carry out this exercise, a DEM of the area of interest is needed. For this project an open data DEM was obtained using the Geospatial Data Extraction Tool created by Natural Resources Canada.
Digital Elevation Models for locations outside of Canada can be obtained using the EarthExplorer Tool created by the United States Geological Survey (USGS).
Starting ILWIS
Before starting any analysis, create a working folder and ensure all data needed are in this folder. Keeping all your data in one folder makes analyses easier.
- Ensure that ILWIS 3.8.5 is properly installed on your computer
- Locate ILWIS from the program list and double click on the icon to launch program
- ILWIS main page will open
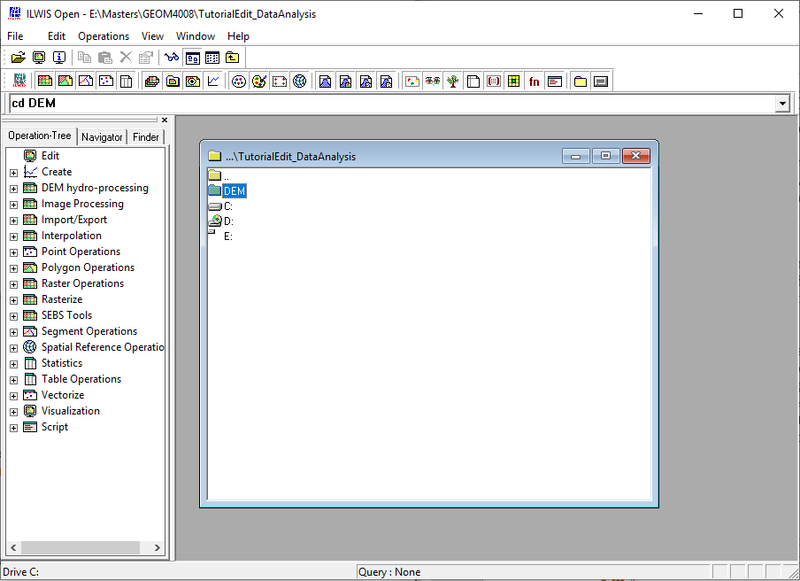
- Use the ILWIS Navigator Tab to locate your working folder. The Navigator lists all drivers and directories.
Figure 1: Screenshot of ILWIS Interface
Importing a DEM
Before any analysis can be completed, a DEM of the region of interest must be imported into ILWIS.
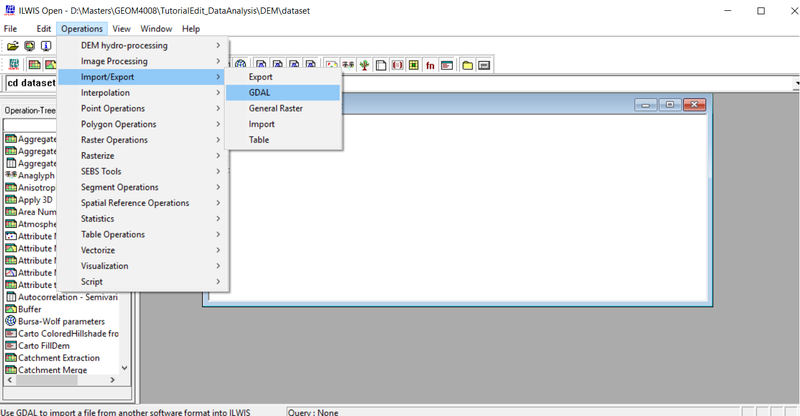
- 1) Click Operations --> Import/Export --> GDAL (Geospatial Data Abstraction Library)
Figure 2 - Finding the import tool in ILWIS
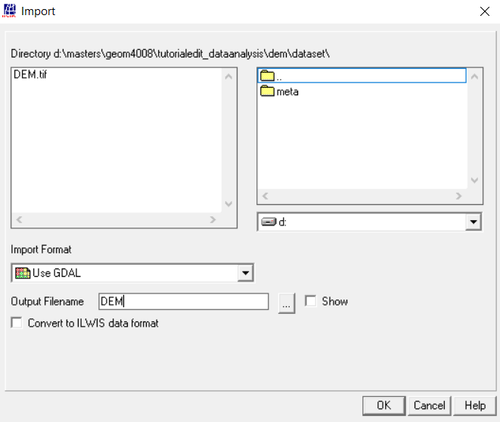
- An Import window will open
Figure 3 - ILWIS import window
- 2) Click to the DEM you want to import and ensure that the import format is set to Use GDAL.
- 3) Give your Output DEM a name and click OK.
- The new DEM (compatible in ILWIS) will save in your working directory
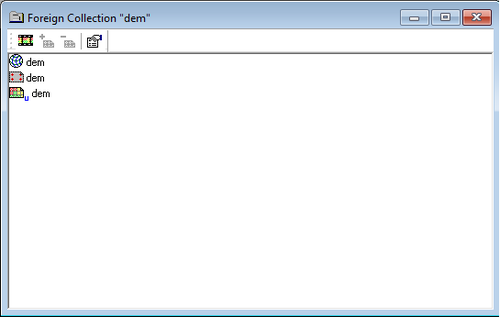
- 4) To view your DEM double-click on the DEM to open the Foreign Collection window.
Figure 4 - ILWIS foreign collection window
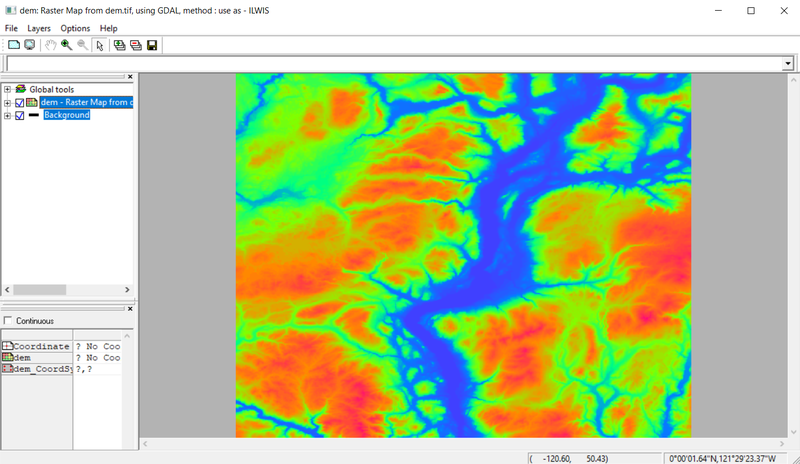
- 5) In the foreign collection window, double-click on the raster layer icon to open the DEM.
- The raster you have imported will open
Figure 6 - Projected DEM of Lake Okanagan in ILWIS software
Projecting a DEM
In this version of ILWIS 3, you are able to change the projection of the DEM without problems. This step is important, especially when working with data from multiple sources as they will often not use the same projection. The following steps explain how to find the current projection of the DEM, create a new projection, and then change the projection of the existing DEM.
(note: For the following hydrological analyses, the coordinate system chosen needs to be in planar coordinates (units of metres), not in polar coordinates (units of degrees))
Determining the Current Coordinate System
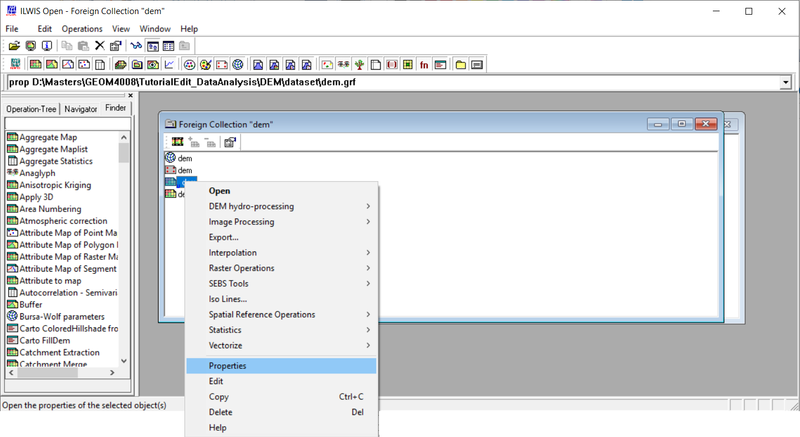
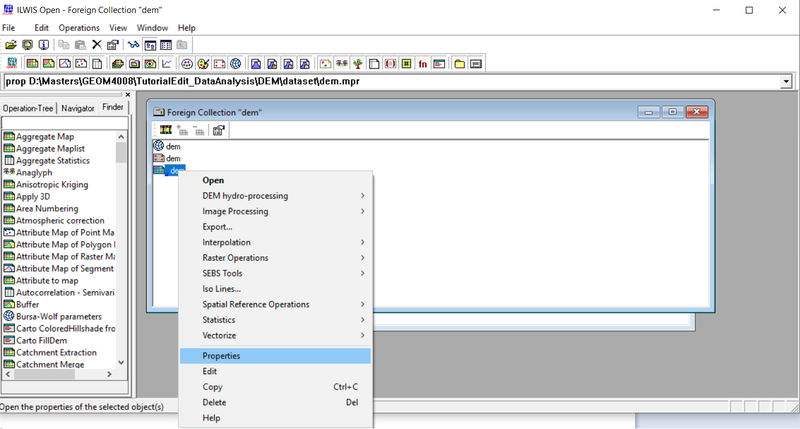
- 1) Right click on the raster, and select Properties.
Figure 7 - Path to find properties of a raster
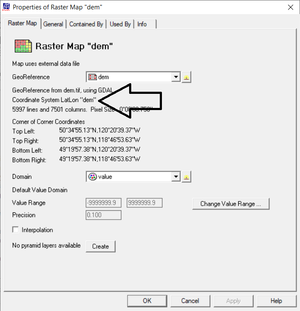
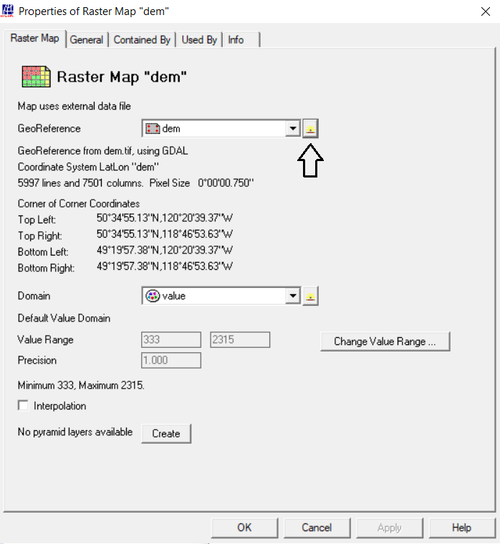
- The Properties of Raster Map window will open. Read the line that says: Coordinate System (see Figure 8 below).
- This tells you which Coordinate System file is currently being used by the raster. In this example, the Coordinate System file called "dem" is being used.
Figure 8 - Properties of Raster Map window with arrow pointing to the current Coordinate System in use
- 2) Close the Properties of Raster Map window.
- 3) Right click on the coordinate system in use by the raster, and select Properties.
Figure 10 - Path to find properties of a coordinate system
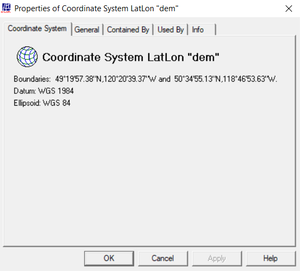
- The Properties of Coordinate System LatLon window will open.
- This tells you which coordinate system is current being used by the Coordinate System file and the raster. In this example, the reference coordinate system being used is WGS 1984.
Figure 11 - Properties of Coordinate System LatLon window
Creating a New Coordinate System
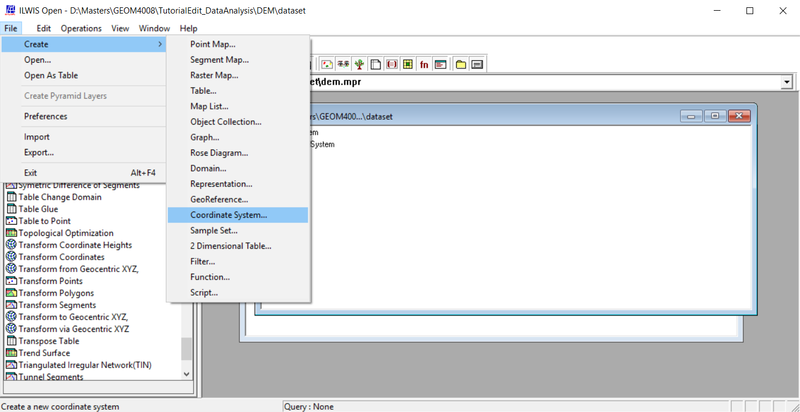
- 1) Click File --> Create --> Coordinate System
Figure 12 - Path to find properties of a coordinate system
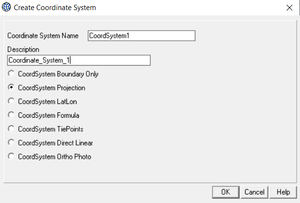
- The Create Coordinate System window will open.
Figure 13 - Create Coordinate System window
- 2) Input a name for the new coordinate system, and select CoordSystem Projection. Press OK.
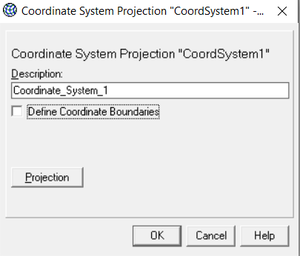
- The Coordinate System Projection window will open. Click Projection.
Figure 14 - Coordinate System Projection window
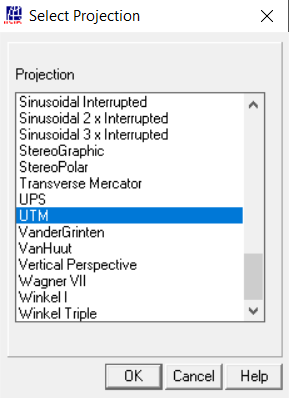
- The Select Projection window will open.
Figure 15 - Select Projection window
- 3) Double-click the projection you would like to use from the list. In this case the Universal Transverse Mercator (UTM) projection was selected.
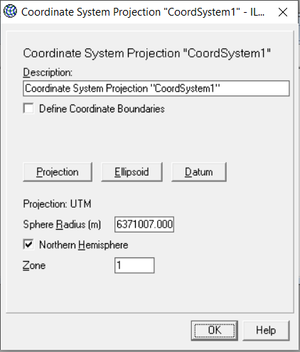
- The Coordinate System Projection window will open again, this time with more options.
Figure 16 - Updated Coordinate System Projection window
- 4) Click Datum.
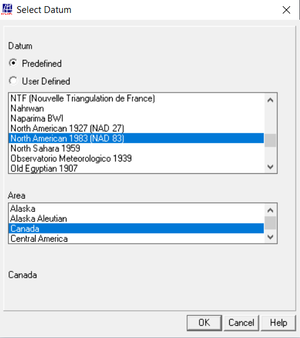
- The Select Datum window will open.
Figure 17 - Select Datum window
- 5) Choose the geodetic datum coordinate system from the list, and the Area for the datum if available. In this case, North American 1983 (NAD 83) and the Canada was selected as the area.
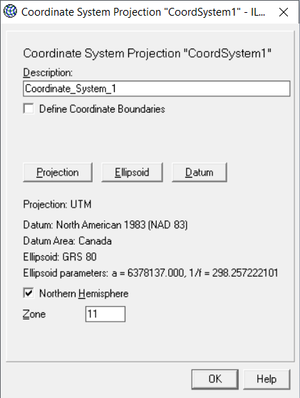
- Again, the Coordinate System Projection window will open, this time with more changes.
Figure 18 - Second updated Coordinate System Projection window
- 6) Check the Northern Hemisphere option (if applicable), and enter UTM zone that your area of interest is located in. In this case, Okanagan Lake is located in UTM zone 11.
- If you are unsure of the UTM zone your area of interest is located within, you can go to this website. Here, you are able to enter a location and the UTM zone will be provided on the map.
- 7) Click OK. Now the new coordinate system has been created, and appears in your working folder.
Projecting a DEM into a New Coordinate System
- 1) Right click on the raster in the Foreign Collection folder, and select Properties.
Figure 19 - Path to find properties of a raster
- Again, the Properties of Raster Map window will open.
- 2) Click the yellow GeoReference folder.
Figure 20 - Properties of Raster Map window with arrow pointing to yellow GeoReference folder
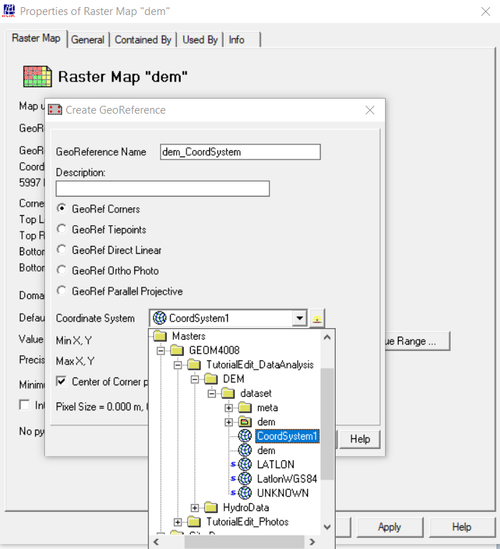
- The Create Georeference window will open.
- 3) Click down-arrow for the Coordinate System menu. Select your new coordinate system from this list.
Figure 21 - Create Georeference window with Coordinate System menu open
- 4) Press OK in the Create Georeference window. Then, Press OK in the Properties of Raster Map window.
- Now the raster map has been projected into the new coordinate system.
Fill Sinks in a DEM
Fills should be run on DEMs to remove any local depressions, which can cause inaccuracies in following hydrological analyses.
Within ILWIS there are two Fill Methods:
- Fill Sinks – removes depressions that consist of a single pixel and depressions that consist of multiple pixels. These pixels will then be given the smallest value of adjacent pixels.
- Cut terrain – removes the depressions, does not re-assign values to the pixels but removes them entirely from the DEM
More information on this operation can be found at the ILWIS Fill Sinks web page.
- 1) Right click on the raster layer in which the sinks have been filled, and select DEM Hydro-processing --> Fill Sinks.
Figure 22 - Path to the Fill Sink operation
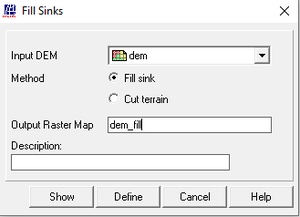
- The Fill Sinks window will open
Figure 23 - Fill Sinks window
- 2) Choose a method to fill sinks (in this case, fill sinks was selected).
- 3) Name the output raster with sinks filled, and click Show.
- A pop-up window called the Progress Manager will open after any operation is initiated. This window tracks the progress of the operation being using a status bar that shows the status of the operation.
Figure 24 - Progress Manager window
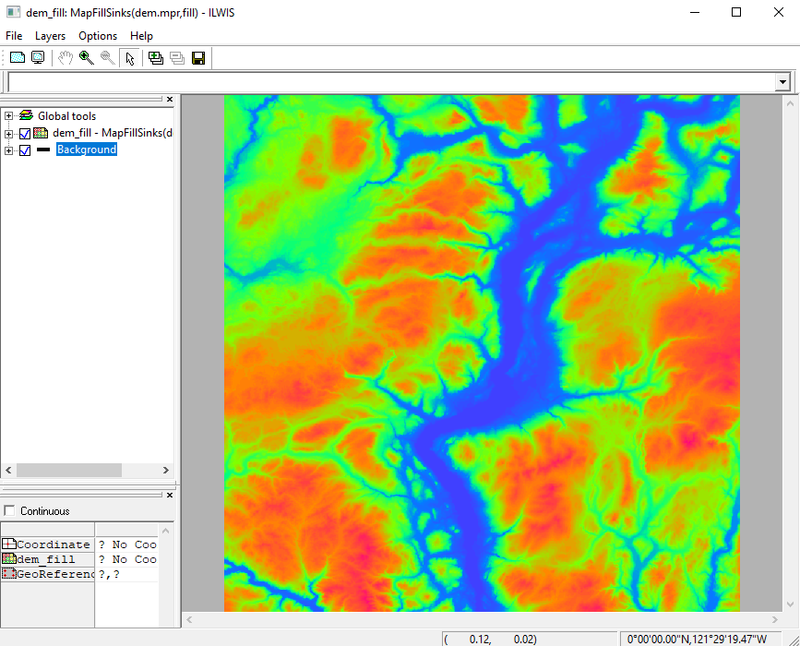
- 4) Once the operation is completed, the Progress Manager window will close. The raster with sinks filled will save in the foreign collection folder and open in a new window.
Figure 25 - Map of Lake Okanagan with sinks filled
Flow Direction
Flow direction depicts a main direction of flow (run-off). The flow direction operation determines into which neighbouring pixel any water from a given pixel would flow. This is determined by a moving 3x3 window for every single pixel, based on its neighbouring pixels height values.
Flow direction can be calculated by two methods:
- Steepest Slope: finds steepest slope of a central pixel to one of its 8 neighbouring pixels
- Lowest height: finds the neighbouring pixel with the smallest height value
More information on the methods can be found at the ILWIS Flow Direction web page.
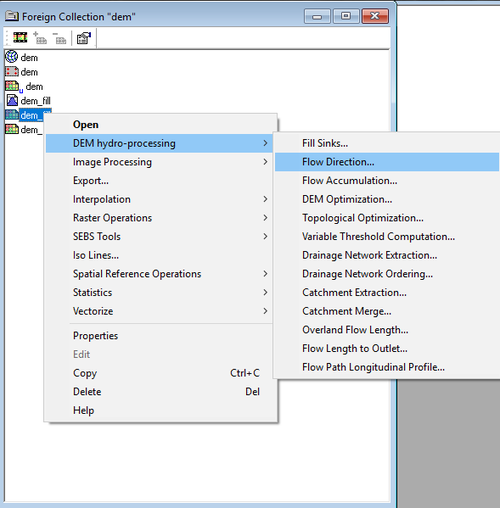
- 1) Right click on the raster layer in which the sinks have been filled, and select DEM Hydro-processing --> Flow Direction
Figure 26 - Path to the Flow Direction operation
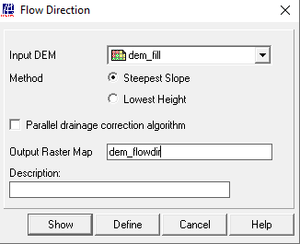
- The Flow Direction window will open
Figure 27 - Flow Direction window
- 2) Choose a flow direction method (in this case, steepest slope was selected)
- 3) Name the output flow direction raster, and click Show
- 4) The flow direction raster will save in the foreign collection folder and open in a new window
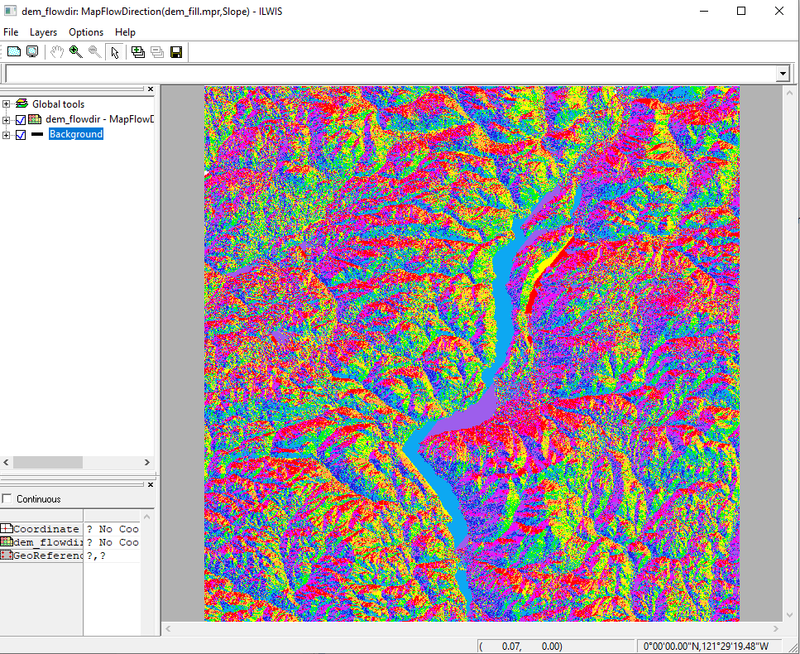
Figure 28 - Flow Direction map for Lake Okanagan
Flow Accumulation Map
Flow Accumulation performs a cumulative count of the number of pixels that would flow into any given cell on the way to an outlet. This operation is commonly used to determine potential drainage patterns of terrain.
Flow Accumulation is calculated from the map created in Flow Direction, counting the number of cells that would drain into outlets based on the flow direction.
More information on the method can be found at this ILWIS Flow Accumulation webpage
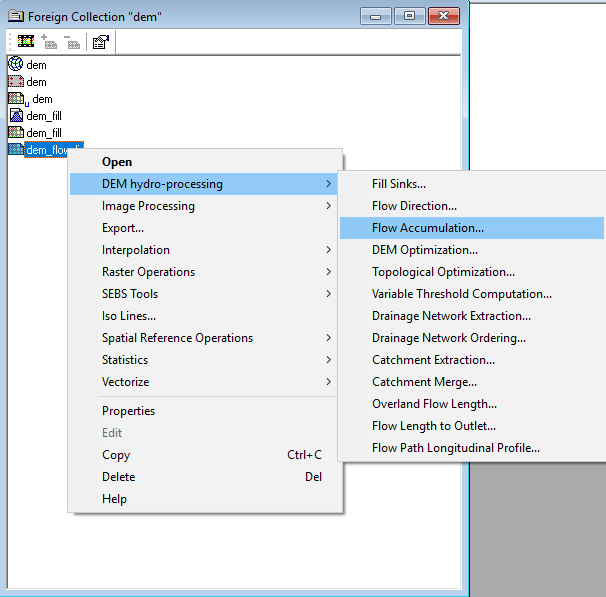
- 1) Right click on the raster layer in which the flow direction has been calculated, and select DEM Hydro-processing --> Flow Accumulation
Figure 29 - Path to the Flow Accumulation operation
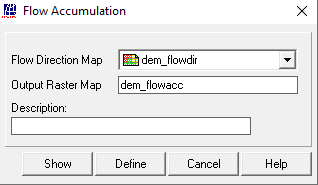
- The Flow Accumulation window will open
Figure 30 - Flow Accumulation window
- 2) Name the output Flow Accumulation raster, and click Show
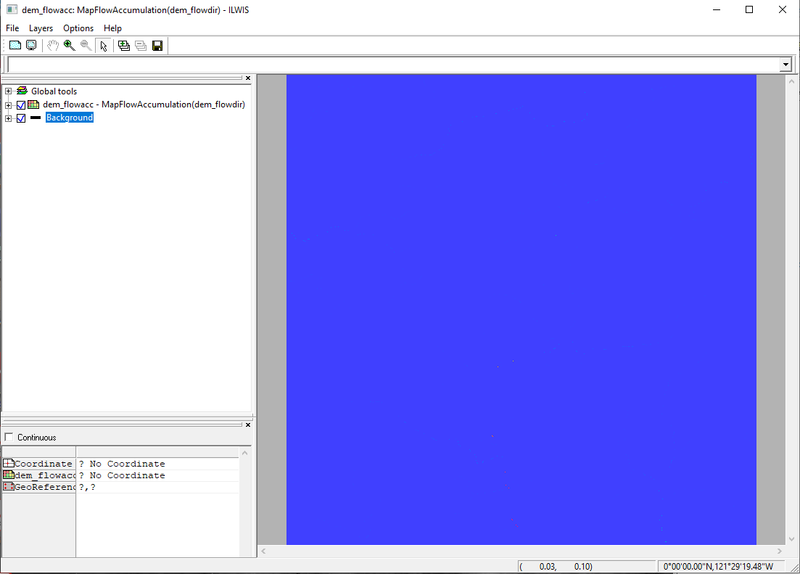
- 3) The flow accumulation raster will save in the foreign collection folder and open in a new window
Figure 31 - Flow Accumulation map for Lake Okanagan
- Legend values can be seen by expanding the menu on the left of the map in the map window
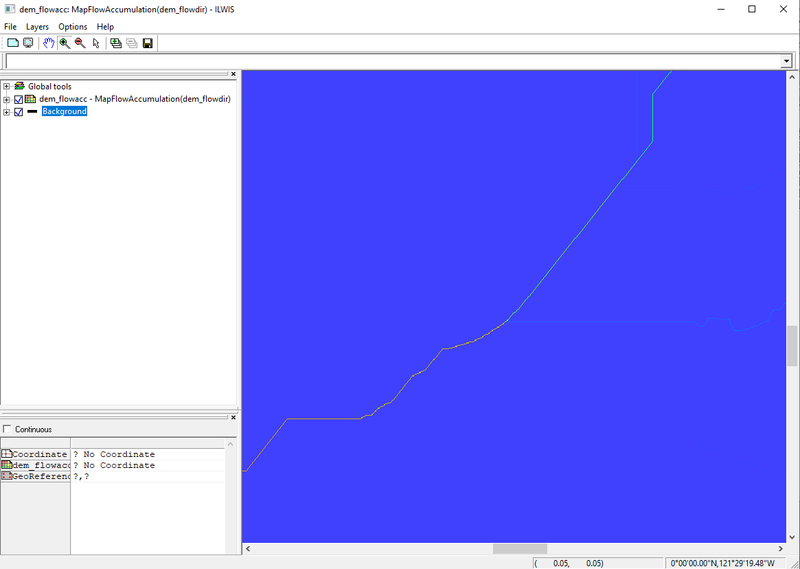
Figure 32 - Zoomed in view of flow in the Lake Okanagan Flow Accumulation map
Drainage Network
Drainage Network Extraction
The Drainage Network Extraction operation extracts a drainage network map. The map is boolean and will illustrate the drainage as pixels with value True, while all other pixels have value of False. The pixel value is determined by the Flow Accumulation Map and a threshold value. The threshold value in this operation is the minimum value required for a flow to be considered True in a drainage network, all cells with a value lower than the threshold will be classified as False.
More information on the operation can be found at the Drainage Network Extraction webpage
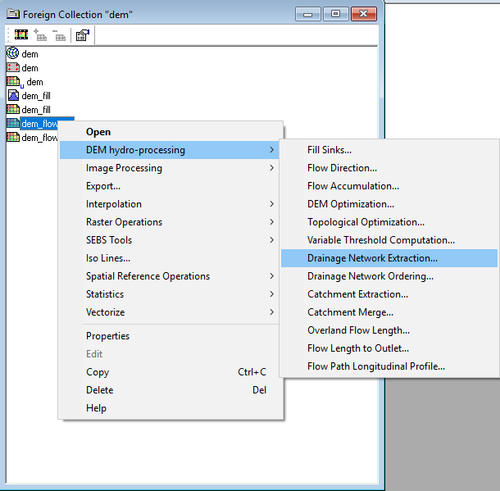
- 1) Right click on the raster layer in which the flow accumulation has been calculated, and select DEM Hydro-processing --> Drainage Network Extraction
Figure 33 - Path to the Drainage Network Extraction operation
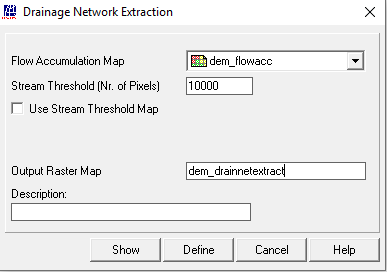
- The Drainage Network Extraction window will open
'Figure 34 - Drainage Network Extraction window
- 2) Determine desired threshold value (in this case, 10000 was the threshold)
- 3) Name the output drainage network raster, and click Show
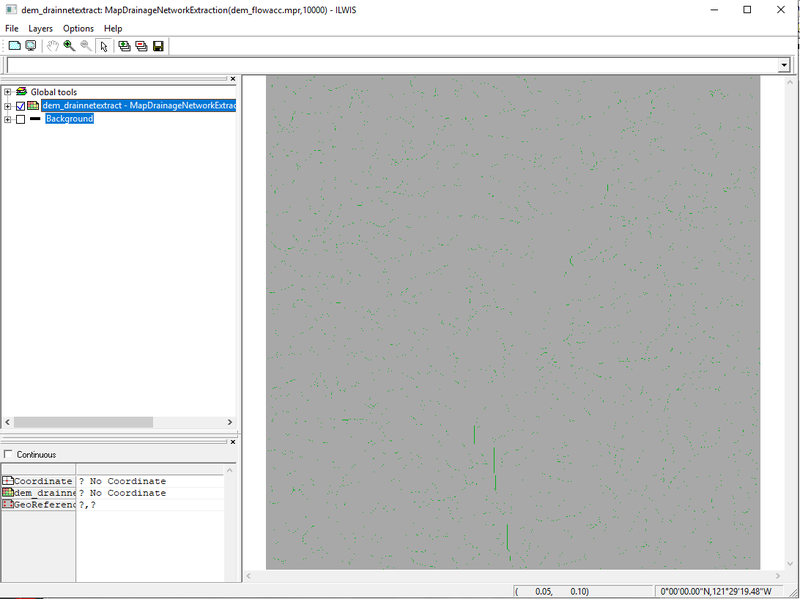
- 4) The drainage network map containing all streams that meet the threshold value will open
Figure 35 - Drainage Network map of Lake Okanagan region
- Again, using the zoom-in tool will allow you to see the drainage network more clearly
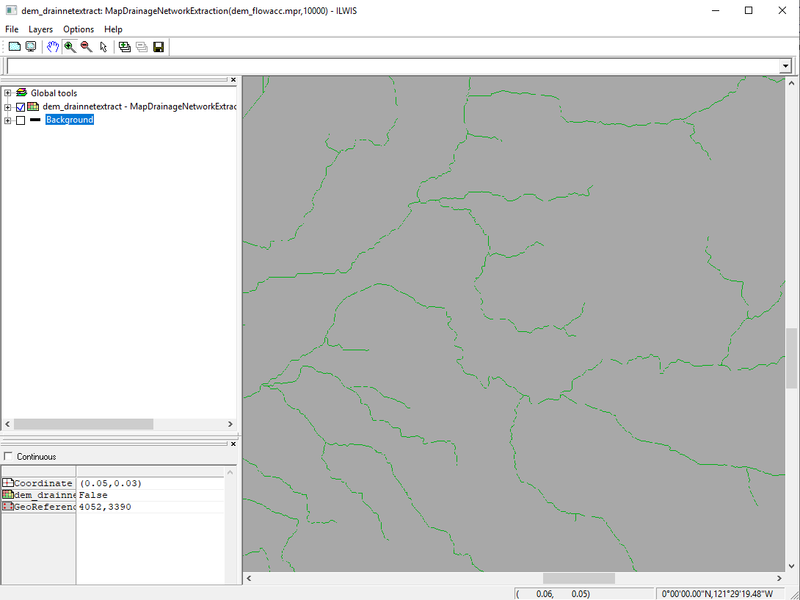
Figure 36 - Drainage Network map of Lake Okanagan region zoomed in
Drainage Network Ordering
The Drainage Network Ordering operation finds all drainage lines and nodes in the Drainage Network, and applies a unique ID to each stream.
Drainage Network Ordering requires the input of:
- A Filled DEM;
- A Flow Direction Map; and,
- A Extracted Drainage Network Map.
More information on the operation can be found at the Drainage Network Ordering webpage.
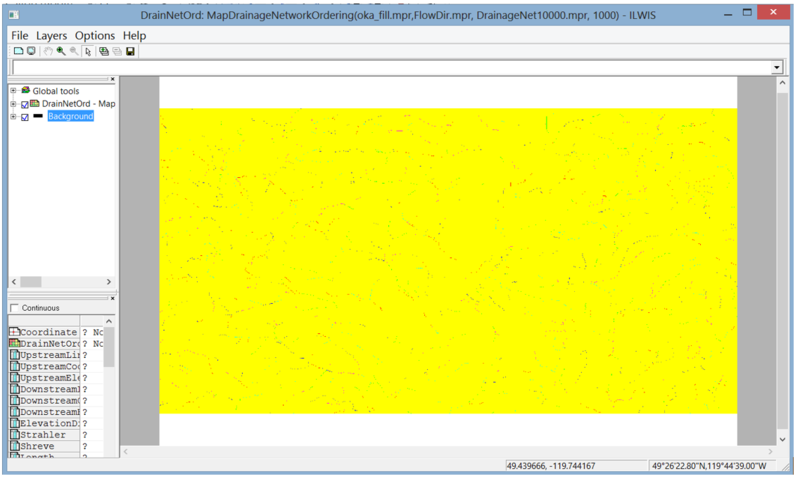
Please note: In version 3.8.5 of ILWIS, the Drainage Network Order operation did not produce any values in the attribute table. Therefore, the drainage network order was not produced. I have chosen to include Figure 39 and 40 to provide an example of what should have happened in the event that an update is provided for ILWIS 3 in the future, and this operation is debugged.
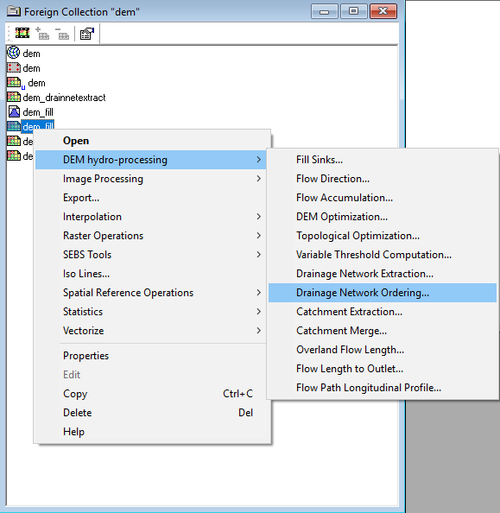
- 1) Right click on the raster layer in which the sinks have been filled, and select DEM Hydro-processing --> Drainage Network Ordering.
Figure 37 - Path to the Drainage Network Ordering operation
- The Drainage Network Ordering window will open.
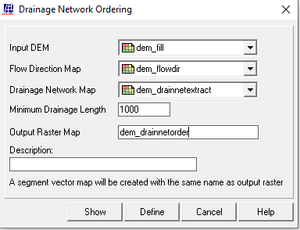
- 2) Input the previously created flow direction map, the extracted drainage network map, and name the output raster map.
Figure 38 - Drainage Network Ordering Window
- 3) Input a value for the minimum drainage length (in this case, 1000). Press Show.
- Minimum drainage length determines the minimum length a drainage line in the extracted drainage network map that can be assigned an unique ID.
- The output drainage network order map will open.
Figure 39 - Drainage Network Ordering output map
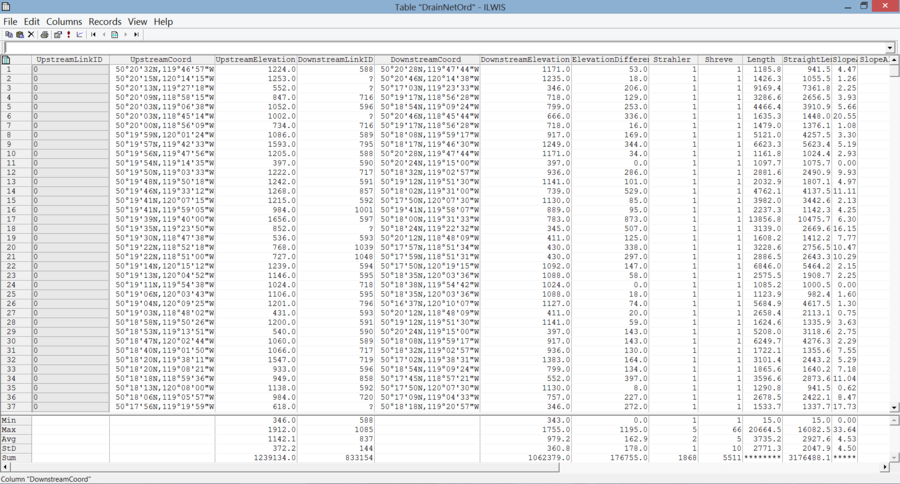
Output consists of both a map and a Table. The table lists all the streams with ID values, coordinates, lengths, slope of drainage. This can be seen in Figure 40.
Figure 40 - Drainage Network Order output table
DEM Visualisation
Overland Flow Length
The Overland Flow Length operation measures the overland distance towards the 'nearest' drainage location for each pixel based on flow paths available from the Flow Direction Map. This will create a map showing the distance a flow must travel to reach the outlet of a given watershed.
More information on Overland Flow Length that can be found at the ILWIS Overland Flow Length webpage
Please note: In version 3.8.5 of ILWIS, the Drainage Network Order operation did not produce any values in the attribute table. Therefore, the drainage network order was not produced. I have chosen to include Figure 43 and 44 to provide an example of what should have happened in the event that an update is provided for ILWIS 3 in the future, and this operation is debugged.
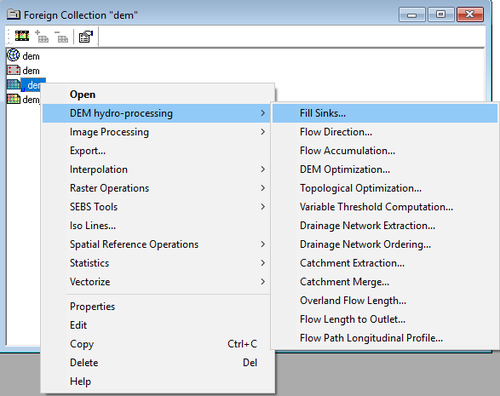
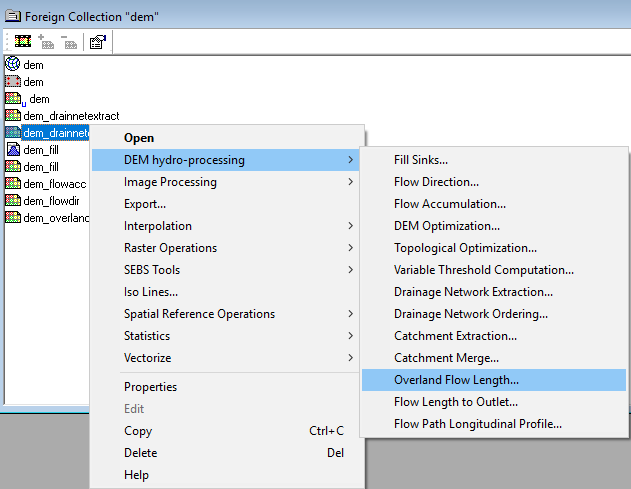
- 1) Right click on the DEM layer in which the drainage network order has been calculated, and select DEM Hydro-processing --> Overland Flow Length
Figure 41 - Path to the Overland Flow Length operation
- The Overland Flow Length window will open
Figure 42 - Overland Flow Length window
- 2) Input the raster in which flow direction has been calculated as the Flow Direction Map, and name the output raster. Click Show.
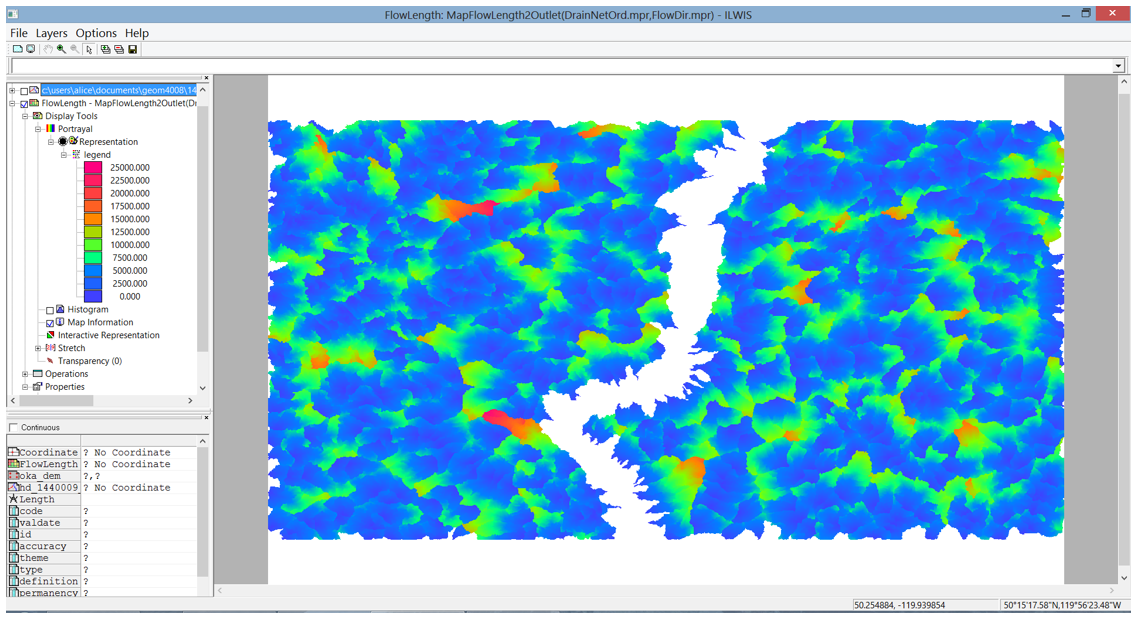
Figure 43 - Flow length in metres map for Lake Okanagan region
The output map will show the different sub watershed and the flow length for each cell to reach the outlet.
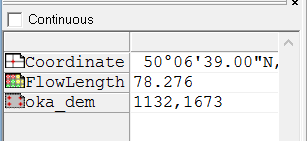
To determine the flow length of a specific cell, use the normal mouse cursor ![]() and click on the area of interest. The flow length value in metres will appear in the table on the bottom left portion of the screen.
and click on the area of interest. The flow length value in metres will appear in the table on the bottom left portion of the screen.
Figure 44 - Flow length for a given point selected with the cursor
Not Covered in this Tutorial
This tutorial covers the most basic hydrological tools for a more simple and basic hydrological analysis using ILWIS. Operations that have not been covered but should be considered when desiring a more in-depth and accurate analysis include:
- Flow Modification
- Variable Threshold Computation
- Network and Catchment Extraction
- Compound Parameter Extraction
- [ Flow Length to Outlet]
- [ Flow Path Longitudinal Profile]
- Compound Index Calculation (includes the Wetness Index, Stream Power Index, and Sediment Transport Index)
- Statistical Parameter Extraction
Additional Resources
For additional assistance, a beginner User Guide for ILWIS can be obtained at the 52 North Website
Additional information on ILWIS operations can be found in this ILWIS Operations Appendices
Conclusion
This tutorial showed the steps required to run some hydrological analyses using a DEM in ILWIS software. ILWIS software was used to reproject the DEM and run the hydrological analysis on the Lake Okanagan region. This tutorial should allow for basic hydrological analysis using ILWIS and a DEM of the study region. For a more in-depth analysis look into the topics not covered in this tutorial.
References
ILWIS Software ILWIS Software homepage
Natural Resources Canada Geospatial Data Extraction Tool
