Difference between revisions of "Conducting a Viewshed Analysis in QGIS"
| Line 25: | Line 25: | ||
== '''Process'''== |
== '''Process'''== |
||
Please download the data from the previous section before starting the tutorial. |
Please download the data from the previous section before starting the tutorial. |
||
| + | |||
Open QGIS Desktop and start an empty new project. |
Open QGIS Desktop and start an empty new project. |
||
[[File:Figure1MattNick.jpg|caption|border|1000px]] |
[[File:Figure1MattNick.jpg|caption|border|1000px]] |
||
| + | |||
| + | '''Figure 1.''' Open an empty new project and give it a name. |
||
Revision as of 21:20, 10 December 2020
Contents
Introduction
Viewshed Tool
The Viewshed analysis is a powerful tool which allows users to "know how visible objects might be—for example, from which locations on the landscape will the water towers be visible if they are placed in a particular location," (ArcGis 2020). For this particular tutorial, the Viewshed analysis will be conducted in a QGIS setting. QGIS is an open source software that is available to all users. It is a powerful GIS software that is comparable to other paid software such as ArcGis Pro. There is no built in viewshed analysis tool for QGIS, thus forcing the user to install an open source plugin through the plugin function.
Installation of Visiual Analysis Plugin in QGIS
Process
Before conducting the Viewshed analysis in QGIS the user will need to install the "Visual Analysis" plugin by...(To be continued) 1) Open QGIS 3.14 2) Select "Plugins" tab in the toolbar at the top of the screen. 3) Select
Objective
Mock Scenario
Data
Digital elevation models (DEMs) will be downloaded and used to conduct a viewshed analysis and are a form of raster data (comprised of a grid of pixels). The DEMs will be in a Tagged File Format that has the file extension “.tif”.
The data can be downloaded from the University of Minnesota’s ArcticDEM datasets from the following link:
https://www.pgc.umn.edu/data/arcticdem/
Click on the “Browse server” button and then click on the “mosaic” folder, then the “v3.0” folder, and finally download the 100 metre, 500 metre, and 1-kilometre resolution DEMs. Depending on internet speed, the downloads might take considerable time to download. Once downloaded, extract the zipped files into a drive of your choice.
Process
Please download the data from the previous section before starting the tutorial.
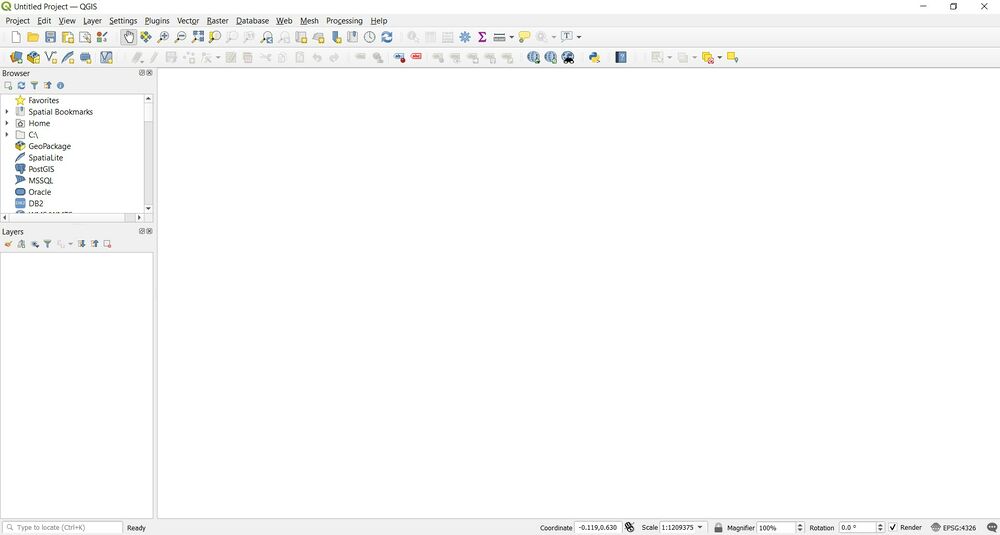
Open QGIS Desktop and start an empty new project.
Figure 1. Open an empty new project and give it a name.
