Difference between revisions of "Site suitability using SAGA GIS"
Sabeeh Syed (talk | contribs) (Created page with "== Purpose == The purpose of this tutorial is to explain and show users how to perform a multi criterion analysis (MCE) on a dataset of their choosing using SAGA GIS. The exam...") |
Sabeeh Syed (talk | contribs) |
||
| Line 52: | Line 52: | ||
| + | When a new grid system is created, a dummy grid map is automatically created as a member of the new grid system. |
||
| − | New Shapes Layer |
||
| − | |||
| − | Right click on the accidents layer that you have imported and select '''Open Attribute Table'''. An attribute table of the accident layer will appear containing a multitude of different fields, including the different types of impacts and the street names where the accident occurred. Once you have the attribute table open, select '''Select Features Using an Expression''' ([[File:Screenshot 2020-10-03 211358.png|frameless|link=]]). A '''Select By Expression''' window will appear, and in the function list, expand the '''Fields and Values''' and select '''IMPACT_TYP'''. Select the '''All unique''' button underneath the Search Bar. Doing so will bring up a list of the unique values from the chosen attribute. In this case, choosing '''IMPACT_TYP''' will list all the different impact types observed in the attribute table. |
||
| − | |||
| − | The expression box allows the user to create formulas that aid in simplifying the search process for the field desired. In the expression box, double clicking a field adds it to the expression. Double clicking on the '''IMPACT_TYP''' will cause "IMPACT_TYP" to appear in the expression window. Once that appears, you select the equal (=) sign where the available operators are listed. The next step is to select a field value. In this example, the first field value selected is '''Approaching'''. The expression listed in the expression window should read: "IMPACT_TYP" = 'Approaching'. Upon hitting '''Select Features''' in the bottom right corner, the impact types that are '''Approaching''' are now highlighted on your map. |
||
| − | |||
| − | [[File:SelectByExpression.png|650px|thumb|none|An example of selecting by expression. In this case, selecting the accidents that were caused by 'Approaching' vehicles]] |
||
| − | |||
=== Saving Selected Points (Shapefile) === |
=== Saving Selected Points (Shapefile) === |
||
Revision as of 20:49, 21 December 2020
Contents
Purpose
The purpose of this tutorial is to explain and show users how to perform a multi criterion analysis (MCE) on a dataset of their choosing using SAGA GIS. The example chosen in this tutorial is the production of a site suitability map to determine the best location for a windfarm in southern Manitoba.
Introduction
Wind energy refers to the process of creating electricity using the wind, or air flows that occur naturally in the earth's atmosphere. Modern wind turbines are used to capture kinetic energy from the wind and generate electricity. A collection of wind turbines is deemed a wind farm. Wind farms are best placed in locations that are near costal areas, or in open plains. Canada has [36] wind farms, with the majority being in Quebec and Ontario. What happens if we want to create a new wind farm somewhere? What are the factors we should be taking into consideration?
In this tutorial you will be given instructions to conduct a MCE in order to best determine the location of a wind farm in the region of Southern Manitoba bordering Saskatchewan.
Data
The data used in this tutorial is available through the Government of Manitoba's Land Initiative Website. The files used in this tutorial are a polygon shapefile of the Virden Region from 2006 and a shapefile of the City of Virden which includes buildings, utility lines, etc. To get ready for this tutorial, you should download all of these shapefiles and keep them in a working folder on your PC to make your work easier to locate.
Software required (SAGA GIS and QGIS)
System for Automated Geoscientific Analyses, also known as SAGA, is a great free and open source software (FOSS GIS tool). SAGA is great tool that offers users a comprehensive and growing set of geoscientific methods and modules that allow for manipulating and analyzing vector or raster data. SAGA also allows for users to script in commands using its Command Line Interpreter (CMD). Despite being not very user friendly, the CMD has the advantage that it can be executed from batch script files, which in turn enables a further automation of complex work flows and the routine processing of mass data. QGIS is available for Windows and Linux. Download the latest version of SAGA (v.7.9.0) to begin this tutorial.
Additionally, you should also have QGIS (v.3.14) installed as it is required in the very preliminary steps to make the data easier to work with.
Tutorial
Now that you have downloaded the software and shapefiles, it is time to begin.
Preparing the Data
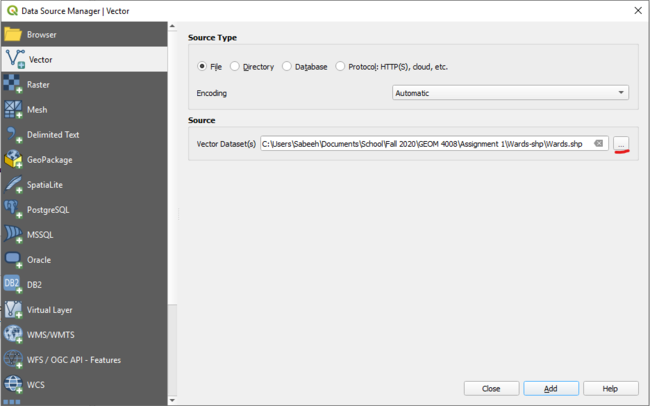
Open QGIS and go to the Layer menu -> Add Layer -> Add Vector Layer. In the pop-up window, set your source type as File and click the Browse button under the Source header. Browse to where your shapefile is and double-click it or highlight it and select Open.
insert photo
Upon opening the shapefile for the Virden region, proceed to right click the layer in the Layers window and click Open Attribute Table. Following this, click the Select/filter features using form button. On the far right of the window, beside the CLASSNAME field change the Excludes Field to Contains. Following this, in the field, type in agri and click the Select Features button at the bottom of the window. Doing so will highlight all the Agricultural and Agri - Forage Fields in the shapefile. Close the attribute table and again right click the layer in the Layers window. This time click Export and select Save Selected Features As. This will open a new window. Enter the file name of your choosing and set the format to Esri Shapefile, then click OK. Doing so will create a new shapefile. In our case, it was called Agriculture. Click the Deselect Features from All Layers button in the toolbar at the top, and then repeat the process again for all other classes in the original shapefile.
Adding Shapefiles into SAGA
Launch SAGA and in the Data Sources window navigate to where your newly create shapefiles for all the different classes and the Virden City shapefiles are located. Clicking a file will automatically add it to the Manager Window under the Data tab. Do this for every shapefile.
How SAGA works is that files can in the Data tab can be added to the Maps tab by simply right clicking the file and selecting Add to Map. If this is the first file you are doing this with, it will automatically create a new map with the name of the given file. For subsequent files, it will prompt you on which map you wish to add your chosen shapefile to.
Insert photo of adding to map
Defining a Project Area and Creating Grid Maps
Grid maps are members of a specific grid system defined by a spatial extent and cell size. When a grid map is loaded into a SAGA work session, if the grid system it is a member did not already exist for the session, it is now listed along with any other loaded grid systems. In this tutorial, a specific grid system is defined for the project area and referred to as the project area grid system.
In order to define the project area first click the Tools tab, then click Shapes -> Tools -> Create New Shapes Layer. This will open a window as seen below
insert photo
Enter the name you wish and change the Shape Type to Polygon, then hit Execute. To create a new grid system, in the Tools tab, click Grid -> Tools -> Create Grid System. In the window that opens, change the Cell Size to 30, the Initialization Value to 1 and the Extent Definition to One or more shapes layers. In the >> Shapes Layers field, input the polygon that you created. This will create a new grid definition with the value:
When a new grid system is created, a dummy grid map is automatically created as a member of the new grid system.
Saving Selected Points (Shapefile)
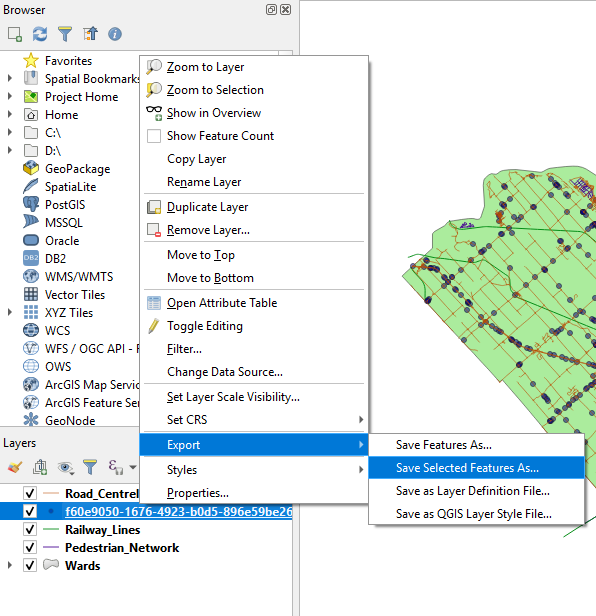
The selected points that are now highlighted can be saved as their own shapefile. To do this, right click on the accidents layer, mouse over Export, then select Save Selected Features As and a window will appear.
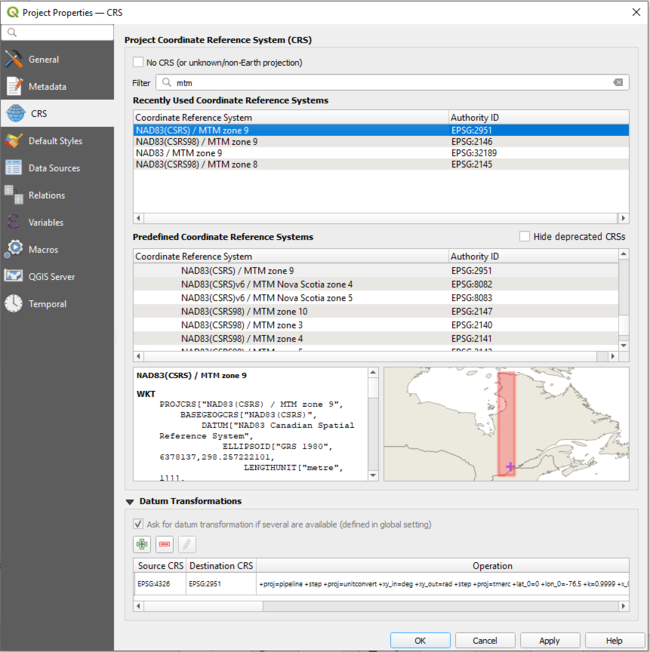
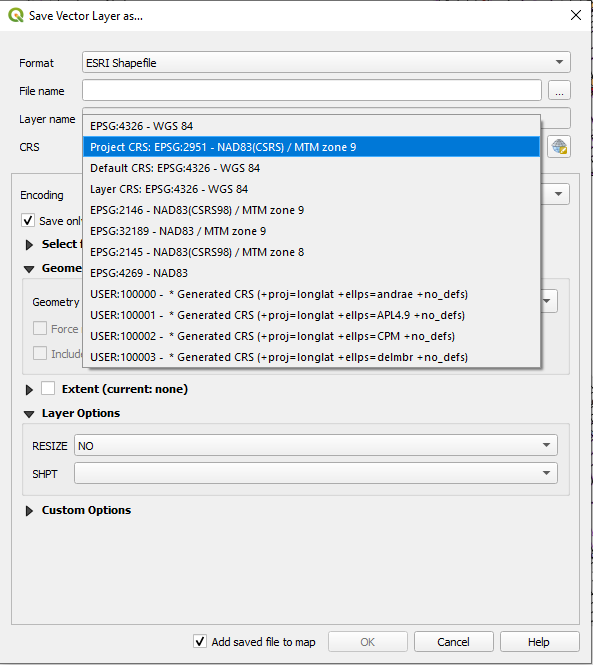
In this window, the format that the shapefile should be saved under is "ESRI Shapefile". Additionally, you will be given the option to set the CRS of the shapefile you are about to create. Set the CRS to the Project CRS, in this case it will be Project CRS: ESPG:2951 - NAD83(CSRS)/MTM zone 9. Name the file what you please, and then click OK. Doing so will create and save the shapefile in the location/folder where the Map Project is saved.
Repeat both the Editing Attribute Tables: Selecting by Expression and Saving Selected Points (Shapefile) steps until all the impact types have been saved as their own individual shapefiles.
Selecting a Specific Area
To select a specific area, open the attribute table for the Wards shapefile layer. Click on the Select features using an expression (![]() ) button.
) button.
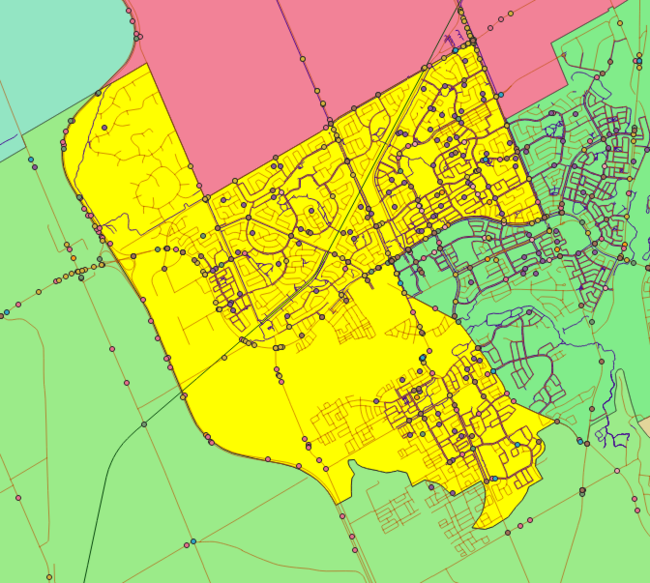
The Select By Expression window will appear, and in the function list, expand the Fields and Values and select the specific area you want to study. In our case, Barrhaven is the chosen site. In order to select only Barrhaven, we can use a number of different options for the expression: "WARD_EN" = 'BARRHAVEN' , "WARD_NAME_" = 'Barrhaven' , "WARD_NAM_1" = 'Barrhaven' , "DESCRIPTIO" = 'BARRHAVEN - Jan Harder' . Any of them do the job.
If we were tasked with selecting more than one ward at a time, our expression would look something like: "WARD_EN" = 'BARRHAVEN' OR "WARD_EN" = 'CUMBERLAND' . Once the wards you want are selected, save and create shapefiles for the selected layers as described in the Saving Selected Points (Shapefile) section.
Clipping Files
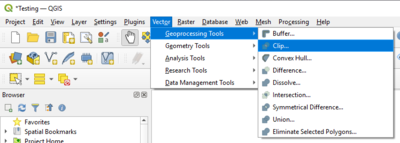
When the newly merged shapefile has been made, you can simply clip all of the other information (accidents, roads, railways, pedestrian paths) onto the study area as well. To do this, go to the Vector Menu, select Geoprocessing Tools and then select Clip.
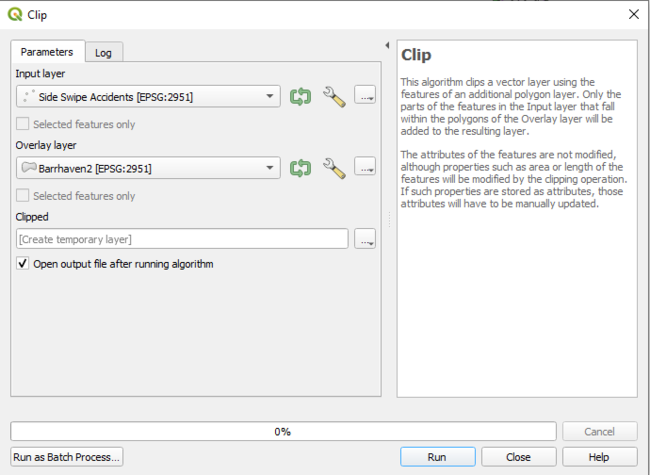
A clip window will appear and the input vector layer will be what shapefile you want to clip onto the output vector layer. For example, in order to clip all the Side Swipe Accidents that occurred in the Barrhaven area, the input vector layer should be Side Swipe Accidents and the overlay layer would be the Barrhaven shapefile that was created in the previous selection. For output shapefile, you can browse to the folder that contains all of your other shapefiles and choose a name for your clipped file.
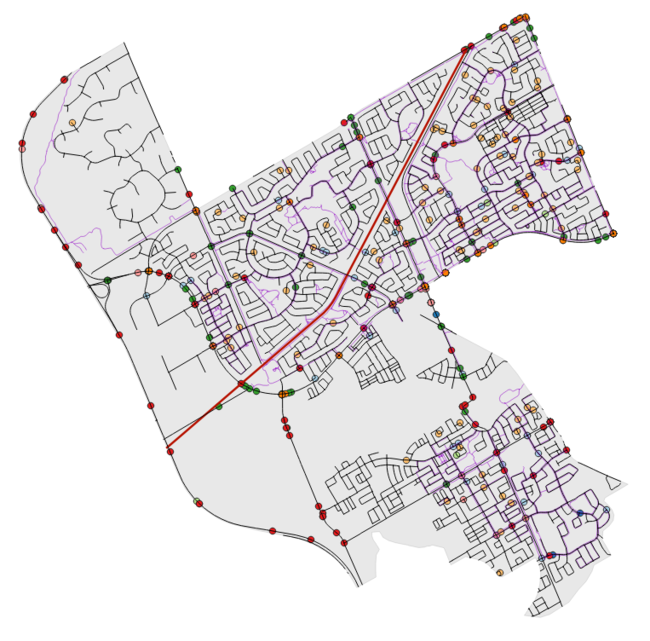
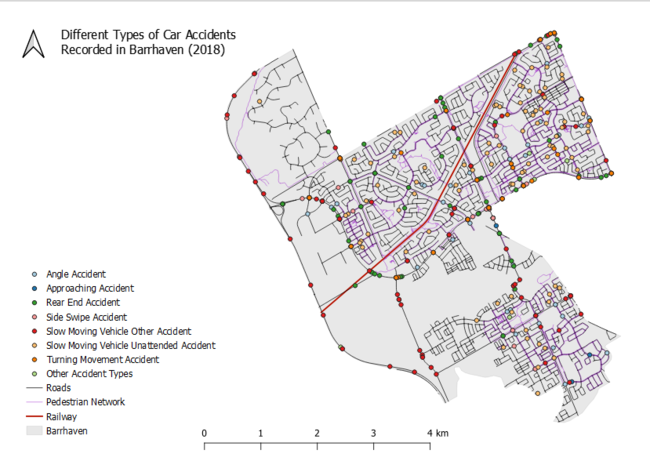
When clipping the other shapefiles, the overlay layer remains the same, but the input vector layer changes. Proceed to clip all the other vector layers as done above, and format them to the style of your liking. Once completed, you should have a map similar to something below.
Analyzing the Data
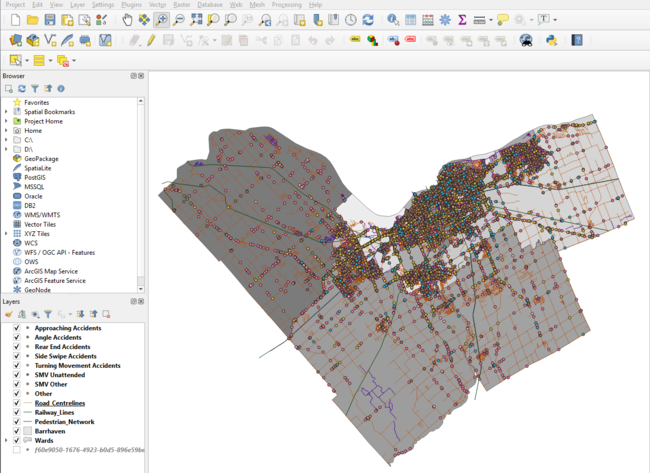
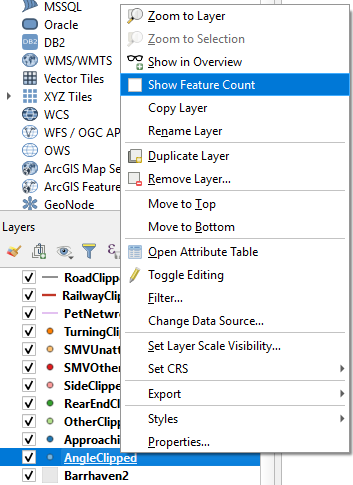
In order to determine how many of each accident type has occurred, one can right click the layer in the Layers menu on the bottom left of the display, and can "check" the Show Features Count, which then displays the number of occurrences for the layer beside the layer name.
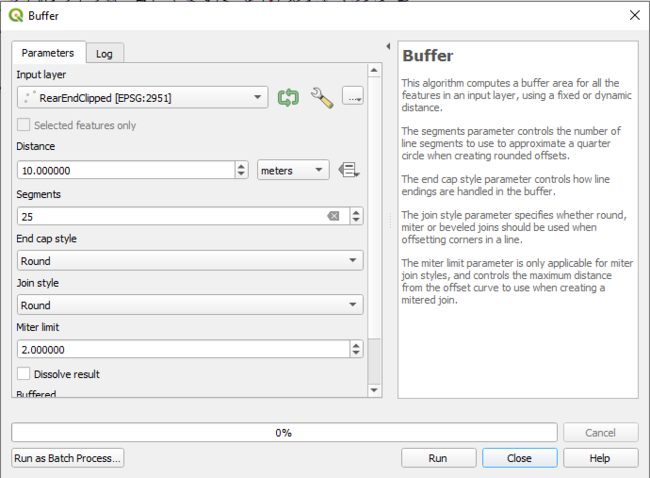
Lets say that we wanted to determine how many Rear End accidents occurred near Local roads, we would first create a buffer around the clipped rear end accidents shapefile. To do so you select Vector -> Geoprocessing Tools -> Buffer. In this example, a buffer distance of 25m was used and the segments to approximate value was 25. The created file will be temporary, which we can then later save if desired.
Once we have the desired buffer for the desired accident type, we can then filter and use the Select by Expression option in the attribute table of the clipped Roads shapefile to filter and select the roads whose "SUBCLASS" = 'LOCAL' . Once this is completed, the local roads will be highlighted in yellow on your screen.
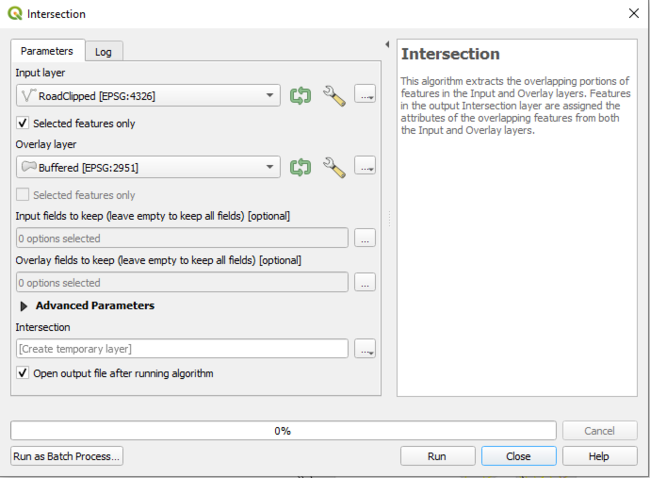
With these two steps completed, we then use the intersection tool found by selecting Vector -> Geoprocessing Tools -> Intersection. Our input layer will be the clipped Road shapefile with the "Selected features only" button checked, and the overlay layer being our temporary Buffered shapefile that we created in the first step of this section.
This will again create a temporary shapefile. Once created we can again determine the count of the new shapefile, which in turn tells us how many Rear end accidents occurred within 25 meters of a local road. In this case, 36.
Using these methods, you can perform a multitude of operations to interpret things such as how many accidents occur within a distance from pedestrian pathways, how many accidents occur within a ward, how many accidents occur within a distance from railways, how many of a certain accident type occur within a distance from other accident types etc.
Making a Map
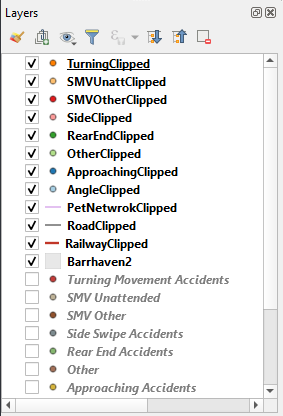
Once we have produced the data that we want to showcase, we can use QGIS to make an aesthetically pleasing map. First, turn on all of the layers that you would like to be showcased and turn off all others by selecting and unselecting the checkbox next to each layer name. I want to showcase different types of accidents that occur within Barrhaven so I have selected these layers:
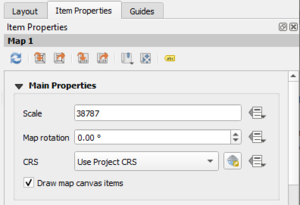
Select Project -> New Printer Composer and then type a name for your map in the text box and select OK (it does not have to be the same as the title you place on your final map). In the pop-up window, select Layout -> Add Map (![]() ) and then draw a rectangle on your canvas where you would like your map. To reposition your map display, select Layout -> Move Content. Now you can drag your map into place and zoom in and out. Under the Item Properties tab on the right hand side, you can also change the scale to get the perfect sizing.
) and then draw a rectangle on your canvas where you would like your map. To reposition your map display, select Layout -> Move Content. Now you can drag your map into place and zoom in and out. Under the Item Properties tab on the right hand side, you can also change the scale to get the perfect sizing.
To add a title, select Layout-> Add Label and draw a box for your title. Under Item Properties -> Label you can type your title in the textbox and change the font type, size, colour etc.
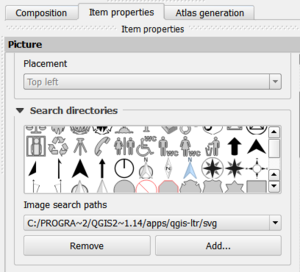
To add a north arrow, select Layout -> Add Image and draw a box on your canvas. Under Item Properties -> Search directories you can view different North Arrows and choose which one you would like to use.
Similarly, you can add a scale bar by selecting Layout -> Add Scalebar.
To add a legend select Layout -> Add Legend. In the Item Properties tab, there is a Legend Items menu. Here you can adjust which layers you wish to add to your legend. Should you have multiple layers that you don't wish to add, you can uncheck the "Auto Update" box, which will then allow you to freely remove legend entries. To rename legend items, double click a legend item and enter the text you want displayed. You can also rearrange legend items by dragging them up and down, or using the up and down arrow
(![]() ) buttons underneath the list of legend entries.
) buttons underneath the list of legend entries.
Once you are happy with your map, you can export it as an image, SVG or PDF by selecting Composer from the top left hand menu and choosing either Export as Image, Export as SVG or Export as PDF. Here is an example of a completed map of Barrhaven that indicates locations of different types of traffic accidents from 2018.
Conclusion
QGIS is an intuitive and user-friendly software that in this instance has allowed the production of a map that showcases traffic accidents in the Barrhaven ward of Ottawa as well as allowed the user to analyze different scenarios. This is just an example of the many ways that a few shapefiles can be combined to produce a multitude of useful and easily understood data
References
- City of Ottawa. (2020). OpenData Ottawa | City of Ottawa. Retrieved October 6, 2020, From City of Ottawa: http://data.ottawa.ca/
- City of Ottawa. (2014). Safer Roads Ottawa Program | City of Ottawa. Retrieved December 20, 2014, from City of Ottawa: http://ottawa.ca/en/residents/transportation-and-parking/safer-roads-ottawa-program
- City of Ottawa. (2014). Safety Improvement Program | City of Ottawa. Retrieved December 20, 2014, from City of Ottawa: http://ottawa.ca/en/residents/transportation-and-parking/road-safety/safety-improvement-program
- MacOdrum Library. (2014). Maps, Data and Government Information Centre | MacOdrum Library. Retrieved December 19, 2014, from MacOdrum Library: https://www.library.carleton.ca/contact/service-points/maps-data-and-government-information-centre
- QGIS. (2014). Discover QGIS. Retrieved December 20, 2014, from QGIS: http://www.qgis.org/en/site/about/index.html
- QGIS. (2014). Download QGIS. Retrieved December 20, 2014, from QGIS: http://www.qgis.org/en/site/forusers/download.html
