Difference between revisions of "Creating service area in QGIS"
(→Data) |
|||
| Line 23: | Line 23: | ||
Tutorial_inputdata.PNG| |
Tutorial_inputdata.PNG| |
||
</gallery> |
</gallery> |
||
| + | |||
| + | ==== Setting projections ==== |
||
| + | To be able to do some of the network analysis we will be doing in this tutorial we will need to have our data and project CRS set to a projected coordinate system. <br> |
||
| + | At the bottom right corner of the screen you will see a little earth looking icon with EPSG:4326.Click this icon to set the map CRS. In the search bar of the menu that opens search 32618. Then select WGS 84/ UTM zone 18N which should appear in the predefined coordinate reference systems section. Then select Ok. <br> |
||
| + | To change the projections in the projection tool bar click vector general and select reproject layer. Under the input later title select one of the files and in target CRS select project CRS from the drop down menu. Then under reprojected click the three dots to open your file explorer. Save the file in the project folder created earlier in the tutorial and give the file a unique name. Then select save and in the menu select run. Repeat this step with all of the files. |
||
== '''Part 1: QGIS Network analyst tool''' == |
== '''Part 1: QGIS Network analyst tool''' == |
||
Revision as of 00:52, 21 December 2021
Contents
Introduction
Network analysis is
When using QGIS there are many ways to do Network analysis between different plugins and QGIS tools. In this tutorial we will be looking at two different tools, one from a plugin and one already in QGIS, to create service areas of parks within the city of Ottawa. These two tools use very different approaches to preform network analysis. The QGIS Network Analysis tool ..... The Valhalla Plugin creates its results using .... Service areas...
From this tutorial you will learn
Data
Finding and downloading data
For this tutorial we will be using only open data and open sourced programs. You will need to have QGIS installed to perform this tutorial. All data will come from Open Ottawa Catalogue. The files you will need for this tutorial are: road-centerlines play-area-structures ottawa-neighbourhood-study-ons-neighbourhood-boundaries-gen-2.
To download these files select down load or the symbol that looks like a cloud with a down arrow in it. This will open several options of formats to download the files in. You should select Shapefile.
Once all the data is downloaded create a folder in you computer to move all your data files to. Name this new folder something relevant to the tutorial so it is easy to find like NetworkAnalysis_ServiceAreasTutorial. This is to ensure you can easily all the files needed.
Uploading data into QGIS
To add the data in to QSIS go to the Layer tab at the top of the program select Add Layer > Add Vector Layer. This will open a menu called Data Source Manager| Vector. In this menu click the three dots symbol to browse your computer and find the files that were downloaded in the previous step. Select the Play_Area_-_Structures folder and then select the .shp file in that folder. Click Open. After this select Add at the bottom of the menu. Do this for the rest of the files downloaded in the previous step.
Setting projections
To be able to do some of the network analysis we will be doing in this tutorial we will need to have our data and project CRS set to a projected coordinate system.
At the bottom right corner of the screen you will see a little earth looking icon with EPSG:4326.Click this icon to set the map CRS. In the search bar of the menu that opens search 32618. Then select WGS 84/ UTM zone 18N which should appear in the predefined coordinate reference systems section. Then select Ok.
To change the projections in the projection tool bar click vector general and select reproject layer. Under the input later title select one of the files and in target CRS select project CRS from the drop down menu. Then under reprojected click the three dots to open your file explorer. Save the file in the project folder created earlier in the tutorial and give the file a unique name. Then select save and in the menu select run. Repeat this step with all of the files.
Part 1: QGIS Network analyst tool
What is the network analyst tool how does it work
Creating Service Areas Using Qgis Network Analyst Tools
Editing Network
To begin this tutorial we must edit our Roads that we will be using as our network. Unfortunately, there are not well connected pedestrian networks available for Ottawa so we will be using a street centerline file as our network and will delete any roadways that pedestrians cannot walk on.
First we will open the Select Features menu. In the third tool bar from the top, the second symbol in click the small down arrow beside the symbol and select Select Features. In the menu that open in the section called sub class change the drop down menu to the right to Equal to. Then in the Subclass section type Freeway and then at the bottom of the menu click select feature. Repeat this but with putting Ramp, Highway, Parkway, Transitway, and then Busonly. Between typing each subclass into the Subclass section click the the arrow beside select feature and click add to current selection. This will select all the road ways that are most likely not walkable.
To delete these selected roads right click on the Road Centerlines file in the layers menu on the left side of the screen and select Open Attribute Table. Then at the top of the attribute table click the pencil icon. This will turn on editing. After you click the pencil click the little red trash can. This is the delete selected features button. Finally click the pencil button again and save the changes you have just made
Using QGIS Network Analyst tool
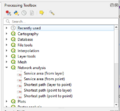
You will be able to find the Network analyst tool in the processing tool box. If you do not have the processing tool box open go to the processing tab and click Toolbox. Once you find the Network analyst tab click it and then select Service Area (from layer).
setting Network analyst menus output
Creating polygons of the Service Areas
Creating polygons around them ?dissolve
Finalized Service Areas
Part 2: Valhalla Network Analyst tool
What is the Valhalla plug in how does it work
Plugins
Downloading the plugins
To start this section of the tutorial you will first need to install two plugins. To do this you will go to Plugins tab at the top of the QGIS program and select manage and install plugins. In the search bar of the menu that opens type in QucikMapServices and select install. This plug in will allow us to put a base map of the city into our map. Then in the same menu search for Valhalla and install this plugin as well.
Creating Service Areas Using Valhalla
Creating a mapbox account and and API key
Before you will be able to use this tool you must create a mapbox account to obtain an API tool. To create an account go to Mapbox and select sign up at the top of the page. Once you create and account and log in it will take you to a page that at the bottom will have a box that say "Access token". Select Create a token.
In the page you are taken to you will see you must create a name for your token. You may call this whatever you like. For example call it Tutorial.
After you create your token copy it by clicking the small clipboard symbol beside it and go back to QGIS.
Inputting API key
You must input your token to run any Valhalla tools. This is just to keep track of who is using the tool. To do this you must select the Web tab go to Valhalla and then click Valhalla. In the menu that opens click the gear looking symbol. This will open a menu called Provider Settings. In this menu select Mapbox, which should be the second option in the menu, and past your token into the section that says API Key and click OK. You may now close the Valhalla menu you have open
Using Valhalla tools
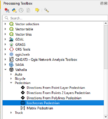
To open the Valhalla tool go to the processing tab and select tool box (you can skip this step if you already have the tool box open). You should now be able to scroll to find Valhalla or you can search for it at the top of the processing tool box.
In this tutorial we will be creating service areas for walking distances so click Valhalla > Pedestrian > Isochrones Pedestrian in the processing tool box. In the Isochrones Pedestrian menu that opens select Mapbox in the Provider section. Then in the input point layer section select Play_Area_-_Structures file. In Mode select Fastest because we will be looking at time intervals instead of distance intervals. Lastly in the Comma-separated time internals [Min] section put 5, 10, 15 and make sure to leave the Comma-Separated distance intervals [km] blank. This will give us three intervals for each point for just out time intervals we put in. (This tool does have a glitch that if you have mode set to fastest and are putting in distance intervals it will put the units as minutes instead of km in the output). You will not have to set any of the advanced parameters for this tutorial as Valhalla already has appropriate defaults for them. For example walking speed will be 5.1 km/h if you do not set anything in this parameter.
The output you get from this should be automatically added into your map. You will see that it has a symbol beside its name. This is because this is only a temporary file as there is not a way to set it to save somewhere in the tool. To make this a permanent file in the layers section, right click on the file name and select make permanent. Then in the menu that opens click the 3 dots this will open your file explorer. Go to the folder you made at the beginning of the tutorial with you files in it and then name the file and click save and then click OK in the menu.
Refining Results
Right now the service areas created are hard to see as they are all overlapping and it is diificult to clearly see all three intervals made. Because of this we are going to dissolve over lapping layers at the same intervals into each other.
To do this, in the processing tool bar go to Vector Geometry > Dissolve. in the menu that opens select your service area file you just made. Then in the Dissolve field(s) field click the three dots, check off contour and then OK. in the Dissolved section click the three dots and select save to file, name your new file and click save. Select Run.
Troubleshooting Invalid Geometries
It is likely you will receive and error message that says Feature 3996 has invalid geometry. Do not worry if this happens it is an easy fix. Under vector geometry in the processing tool bar find Fix geometries. In the input section select your service areas file and under fixed geometries click the three dots, select save to file, name the file and click save. Then select run. With this new file you should be able to repeat the steps above to dissolve the interval areas without anymore errors.
Set Symbology
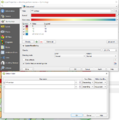
Now we will have to set the symbology of the new dissolved service area file created as currently the area are all the same colour. Right click on file and select properties. In the Layer Properties menu that opens select symbology from the list on the left side. Click where it says single symbol and select categorized. In the value section select contour and at the bottom of the menu click classify. This will separate the areas created by their travel intervals. In the colour ramp section you can select the method you want the intervals to be coloured with for example select spectral. Then select apply.
If you cannot see each interval you may need to change the order the interval are being displayed in. to do this in the same section the above steps were completed click layer rendering, this will open more options to pick from, and then check off control feature rendering mode. After you do this a symbol to the right of that will become coloured, click on this symbol. In the menu that opens click the small arrow and in the drop down menu that opens select contour, then where it says ascending click the arrow and switch it to descending. Then click Ok. Back in the layer properties menu also click OK.
Finalized Service Areas
Conclusion
comparing out puts from both tools strengths and weaknesses from both tools uses for these tools and their outputs


