Difference between revisions of "Visualizing Multi-Temporal Data with Time Manager"
From CUOSGwiki
Jump to navigationJump to search| Line 69: | Line 69: | ||
==Importing Data== |
==Importing Data== |
||
| − | ===Importing a |
+ | ===Importing a Spreadsheet === |
* Start QGIS and click "Layer" on the toolbar. A drop down menu will appear. |
* Start QGIS and click "Layer" on the toolbar. A drop down menu will appear. |
||
* Click "Add Delimited Text Layer". |
* Click "Add Delimited Text Layer". |
||
| Line 84: | Line 84: | ||
* Click on the "OK" button. |
* Click on the "OK" button. |
||
| − | ===Importing a |
+ | ===Importing a Vector Polyline/Polygon=== |
* Start QGIS and click "Layer" on the toolbar. A dropdown menu will appear. |
* Start QGIS and click "Layer" on the toolbar. A dropdown menu will appear. |
||
| Line 91: | Line 91: | ||
* Click on the "Open" button to import. |
* Click on the "Open" button to import. |
||
| − | ===Importing a |
+ | ===Importing a Single Dataset to Time Manager=== |
* Click on the "Settings" button. |
* Click on the "Settings" button. |
||
| Line 98: | Line 98: | ||
* Choose "Datetime" column as the Start Time. |
* Choose "Datetime" column as the Start Time. |
||
* Click "OK" to confirm and exit. |
* Click "OK" to confirm and exit. |
||
| − | |||
| − | [[File:TM3.png]] |
||
==Visualizing the Distribution of the Type of Emergency== |
==Visualizing the Distribution of the Type of Emergency== |
||
Revision as of 00:18, 19 December 2012
Contents
Requirements
Windows/Macintosh/Linux Compatible
- A Screenr account.
- Libreoffice 3.6.4 or Openoffice 3.4.1
- QGIS 1.8
- Time Manager plugin for QGIS
- Skitch or Gyazo
Installing Time Manager
Setting Repository
- Start QGIS
- Click "Plugins" on the toolbar. A drop down menu will appear.
- Click "Fetch Python Plugins"
- Click "Repositories"
- Click "Add"
- Name your plugin "Time Manager"
- Type in "https://github.com/anitagraser/TimeManager" in the URL field
- Click "OK" to exit.
Installing Plugin
- Click "Plugins"
- Search "Time Manager"
- Click "Install Plugin" and wait for confirmation of install.
- Click "Close" to exit.
Enabling Plugin
- Click "Plugins" on the toolbar. A drop down menu will appear.
- Click "Manage Plugins"
- Search "Time Manager"
- Enable "Time Manager"
- Click "OK" to exit.
Enabling User Interface
- Time Manager should appear under "Plugins" drop down menu.
- If not, right click on the toolbar, drop down menu will appear; scroll down to Time Manager and check.
- Time Manger should now be at the bottom of your screen.
Getting Data
Getting CSV data
- Proceed to data.seattle.gov
- Search & open Seattle Real Time Fire 911 Calls
- Click "Export", A drop down menu will appear.
- Scroll down to "Download As"
- Download a copy of this dataset in XLSX format
Getting Vector data
- Proceed to data.seattle.gov
- Search & open Street Network Database
- Download a copy of this polyline shapefile in ZIP format
- Search & open Neighbourhoods
- Download a copy of this polygon shapefile in ZIP format
Preparation of Data
Spreadsheet
- Import to Libreoffice or Openoffice or Microsoft Excel
LibreOffice Calc/OpenOffice Calc
- Right click on "datetime" column and proceed to "Format Cells".
- Find and click "User defined" in "Numbers" tab.
- Change format to the following: YYYY-MM-DD HH:MM:SS
- Save file in CSV format.
Microsoft Excel
- Right click on "datetime" column and proceed to "Format Cells".
- Find and click "Custom" in "Numbers" tab.
- Change format to the following: YYYY-MM-DD HH:MM:SS
- Save file in CSV format.
Importing Data
Importing a Spreadsheet
- Start QGIS and click "Layer" on the toolbar. A drop down menu will appear.
- Click "Add Delimited Text Layer".
- Browse to location of Seattle_Real_Time_Fire_911_Calls.csv file.
- Click on the "OK" button.
- Right click on the imported spreadsheet on the Layers panel. A drop down menu will appear.
- Click "Save As"
- Format should be "ESRI shapefile"
- CRS should be "WGS84"
- Name of file is "Seattle.shp"
- "Add saved file to map" should be enabled.
- Save file to a desired location.
- Click on the "OK" button.
Importing a Vector Polyline/Polygon
- Start QGIS and click "Layer" on the toolbar. A dropdown menu will appear.
- Click "Add Vector Layer".
- Browse to location of your "Seattle.shp" file.
- Click on the "Open" button to import.
Importing a Single Dataset to Time Manager
- Click on the "Settings" button.
- Click "Add Layer".
- Choose "Seattle.shp" as the Layer.
- Choose "Datetime" column as the Start Time.
- Click "OK" to confirm and exit.
Visualizing the Distribution of the Type of Emergency
- Right click on seattle.shp, click "properties" from the drop down menu.
- Browse to the "Style" tab.
- Change symbology from "Single Symbol" to "Categorized"
- Choose "Type" as the column.
- Pick a gradient color ramp.
- Click on the "Classify" button.
Result
Points in Polygon Spatial Analysis
- Click "Vector" on the toolbar. A drop down menu will appear.
- Click "Analysis" from the drop down menu. Another drop down menu will appear.
- Click "Points in Polygon"
- Choose "Neighbourhoods.shp" as the input polygon vector layer.
- Choose "Seattle.shp" as the input point vector layer.
- Choose a output shapefile name, for this tutorial I chose "area.shp".
- Click "OK" to process.
- Click "Close" afterwards to exit.
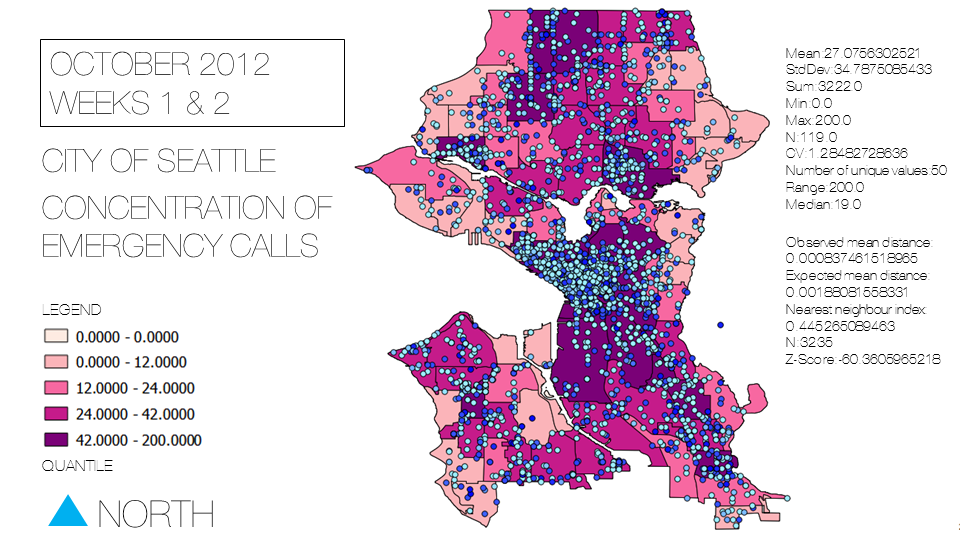
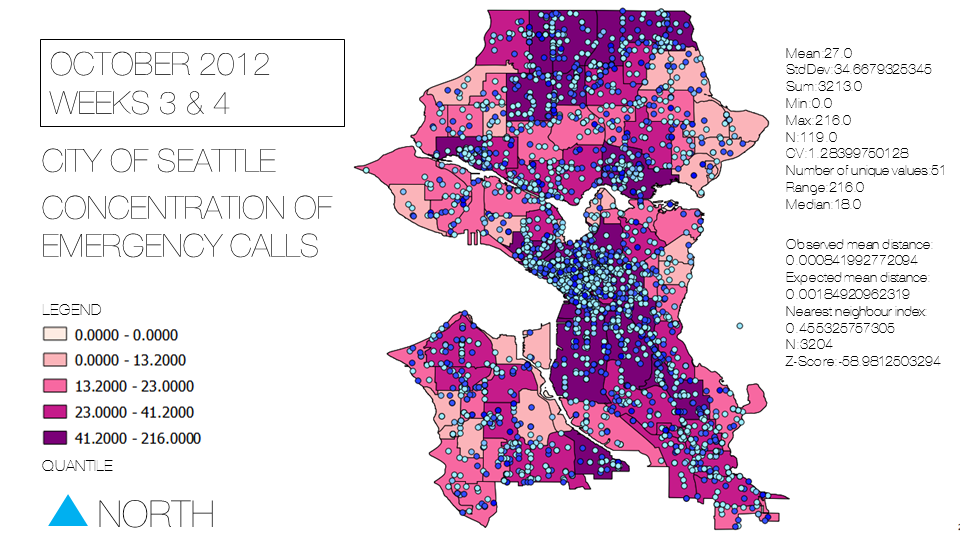
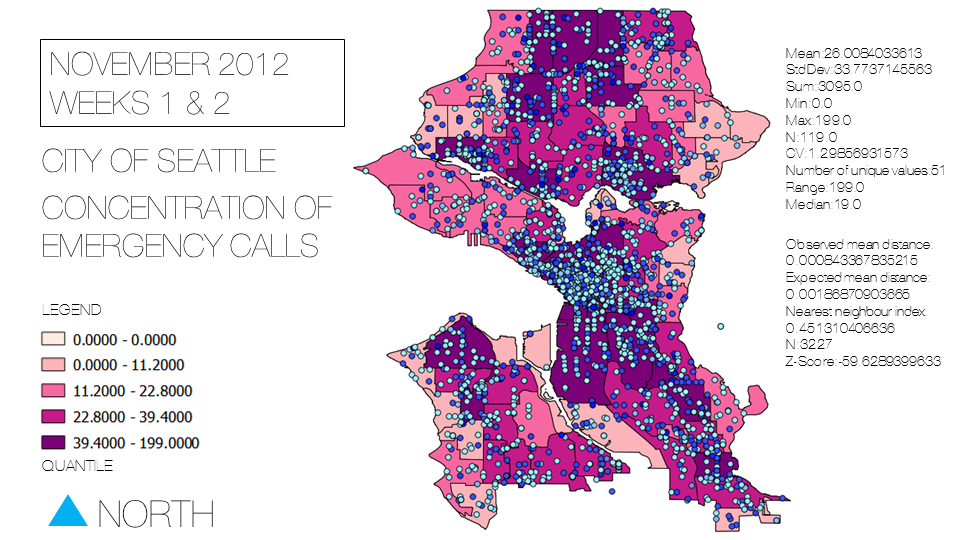
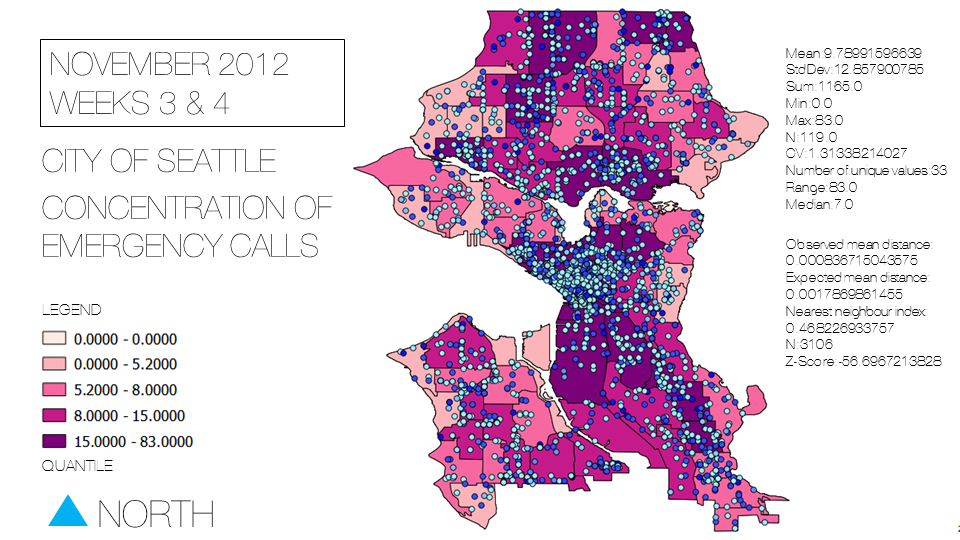
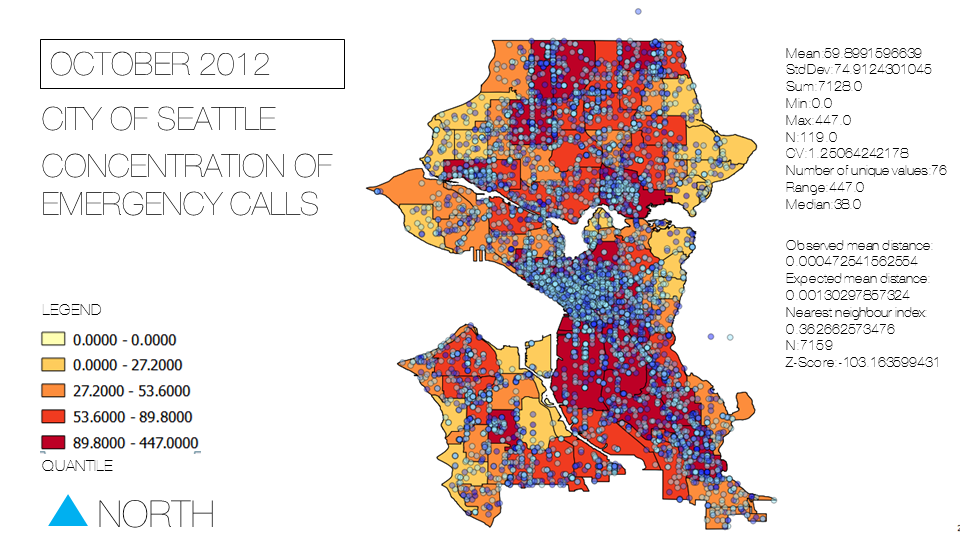
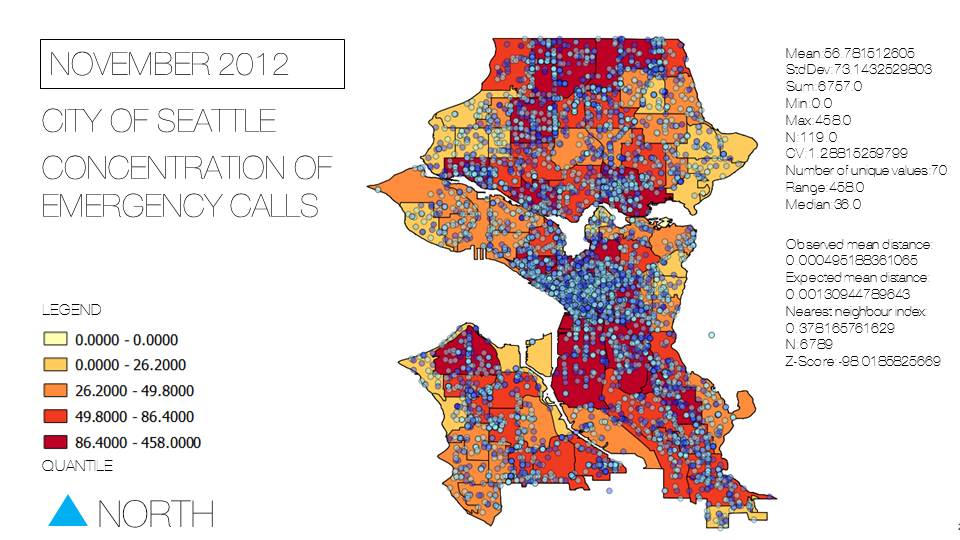
Result:Bi-Weekly
Result:Monthly
Animation with Time Manager
Importing multiple datasets
- Click on the "Settings" button.
- Click "Add Layer".
- Choose "Seattle_Start.shp" as the Layer.
- Choose "Datetime" column as the Start Time.
- Click "OK" to confirm and exit.
- Repeat process with "Seattle_End.shp" as the Layer.
- Change the offset to -20
- Click "OK"

