Difference between revisions of "Exploring Hydrological Analyses using SAGA GIS"
| Line 96: | Line 96: | ||
* Go to the Modules menu in the main toolbar. |
* Go to the Modules menu in the main toolbar. |
||
| − | * Next navigate to the |
+ | * Next navigate to the Terrain Analysis menu, expand it and then hover the mouse over Preprocessing. |
| − | * Once the |
+ | * Once the Pre-processing menu has opened up beside the Terrrain Analysis, you will need to locate the fill sinks tool titled '''Fill Sinks (Wang Lui)'''. |
* ............................ |
* ............................ |
||
Revision as of 19:45, 12 December 2013
Contents
Introduction to SAGA GIS
SAGA GIS stands for System for Automated Geoscienific Analyses. It is a Geographic Information System software program designed to easily and effectively implement spatial algorithms, for real world situations and education. This geospatial software offers a continuously growing comprehensive set of geoscientific tools/methods. The program has an accessible graphical user interface with various visualization options to help users easily operate the various analysis tools. SAGA is capable of running on both Windows and Linux operating systems. SAGA GIS also comes at no cost for the user because it is a Free Open Source Software for Geospatial analysis (FOSS4G). Being a FOSS4G program allows a high degree of freedom for the user; it allows the user to run the program for any geoscientific purpose, to modify the program, to redistribute copies of it, and to improve the program while sharing those improvements with the public. More information about this program is available at SAGA GIS's Website.
Hydrology Definitions
- Hydrology: Hydrology is the study of the movement, and distribution of water in all parts of the Hydrosphere. The focus of this project is on Watershed Hydrology which deals with surface runoff within specific watersheds, based on regional topography.
- Watershed: A watershed (also known as catchment area or drainage basin) is the area of land where surface water converges to the same lower elevation base point. In this project Okanagan Lake is the baseline of the basin for all the surface runoff.
- Topographic Wetness: The topographic wetness index is a method used to monitor rainfall and runoff. The analysis describes the aptness of an area to be saturated based on the surrounding areas slope characteristics and porosity of the ground surface.
Purpose of Tutorial
Introduction
Data
In order to conduct this tutorial and appropriately follow the procedures you will first need to download data that is hydrologically correct and has elevation values for the entire study region. For the hydrological analyses you will essentially need to download a fully processed digital elevation model (DEM) for the region you are interested in. One important thing to note when retrieving DEMs is to make sure that if the elevation data for your area of interest is in separate tiles and requires that they be merged, you must insure that the DEMs were developed at the same resolution, cell size and during the same project. If these ideas are not followed it is possible that the tiles have cliffs within the DEM where the merging has occurred. In specific to this tutorial the study area will be the Okanagan Lake region for which a processed DEM has been acquired from the Natural Resources Canada Geospatial Data Extraction Tool. This data extraction website is great for getting good processed elevation data for much of Canada and also contains other data files for many projects.
| Data | Data Format | Data Source |
|---|---|---|
| Toponyms for Okanagan Region | Vector Points | Geogratis Layer: Cities and Towns / Producer: Natural Resources Canada |
| Transportation Network | Vector Polyline | Geogratis Layer: Highways and Municipal Roads / Producer: Natural Resources Canada |
| Hydrography | Vector Polygon | Geogratis Layer: Rivers and Lakes - Region / Producer: Natural Resources Canada |
| Digital Elevation Model (DEM) | Raster | Geogratis Layer: Canadian Digital Elevation Model Data / Producer: Natural Resources Canada |
| Okanagan Region Aspect Map | Raster | Created Data |
| DEM with Filled Sinks | Raster | Created Data |
| Catchment Area | Raster | Created Data |
| Topographic Wetness | Raster | Created Data |
Methods Conducted in SAGA GIS for Hydrological Analysis
SAGA GIS Basic Setup
Before you start setting up SAGA GIS for use it is recommended that you acquire the data which you plan to use for your project; be aware of where your data is located in a folder and make sure all of the data you are using is located in that folder.
Opening SAGA GIS
To run your hydrological analyses ensure that SAGA GIS is properly installed onto your computer and functional. If you do not have SAGA GIS you can download it at SAGA GIS homepage.
- If installed and functional, one simply has to locate and click the SAGA GIS icon
this will open the initial SAGA GIS window.
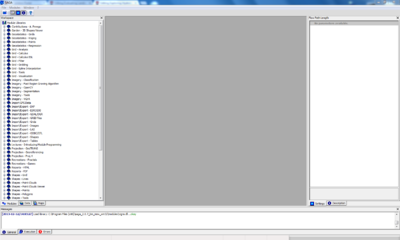
- Once SAGA GIS has been opened your user interface will be shown as below.
Figure 1. Screenshot of what the SAGA GIS graphical user interface looks like at start up
Importing DEM
This section will instruct you how to appropriately bring in a processed DEM into SAGA GIS so that you can effectively conduct a hydrological analysis.
- In the SAGA GIS graphical user interface (gui) you will first need to navigate to the Modules pull down menu located within the main menu toolbar at the top of the screen.

- In the Modules menu navigate to File and then to GDAL/OGR and open the GDAL: Import Raster command.
- Once the Import Raster dialogue box has opened you will see that the first row has the word File in the left column and nothing in the right column. You need to click on the empty column, which will result in the box displaying an ellipsis (...) button. You will then click on this button, which will open a file browser, and navigate to your DEM file. When you have located your elevation model file click Open and then in the Import Raster dialogue box click Okay. Note: When downloading when importing a DEM into SAGA, it can be in any raster format (e.g. .rst, .GRID, .tiff) but the tiff format is preferred.
- After you have started the importation process for the DEM file, you can see the progress of the module in the messages window located at the bottom portion of the SAGA gui. When the message window displays Module Execution Succeeded, your DEM has been correctly imported into SAGA.
- One aspect that is important to remember when importing any file into SAGA including the DEM raster file, is that the imported file will show up in the data tab of the workspace,
 however in order to visually see your data you need to double click on the file name which will open a new window entitled Add layer to selected map, then select new and click OK.
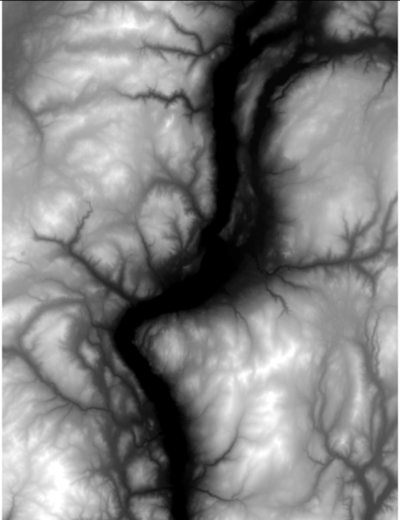
 - Now the DEM is been completely and accurately imported into SAGA GIS and will be displayed like Figure 2.
Figure 2. Digital Elevation Model for Lake Okanagan, British Columbia, Canada (Source: NRCan, 2013)
Filling in the Sinks of a DEM
It is absolutely vital for people conducting hydrological analyses to fill in the sinks contained within digital elevation models. By filling in the these sink features you are essentially limiting the number of geometric artefacts, errors from specular reflection of water, and other errors in the elevation model caused by a variety of aspects. To fill in the sinks go through the following steps:
- Go to the Modules menu in the main toolbar.
- Next navigate to the Terrain Analysis menu, expand it and then hover the mouse over Preprocessing.
- Once the Pre-processing menu has opened up beside the Terrrain Analysis, you will need to locate the fill sinks tool titled Fill Sinks (Wang Lui).
- ............................
Projecting the Data Properly to Conduct Analysis
- Go to the modules tab in main menus tool bar.
- You than go down to Projection.
- Once you select Projection go to Alternatives
- After selecting Alternatives select Proj.4(Command Line Arguments,Grid)
- Look up your specific project 4 code online for your area of interest at the following Projection website
- For this project the


