Difference between revisions of "Highly Effective Construction of Thematic Maps"
| Line 130: | Line 130: | ||
<center>'''Thanks for Reading my Tutorial'''</center> |
<center>'''Thanks for Reading my Tutorial'''</center> |
||
<center>[[Image:Figure3.2.gif|400px|]]</center> |
<center>[[Image:Figure3.2.gif|400px|]]</center> |
||
| + | [https://gcps.desire2learn.com/d2l/lor/viewer/viewFile.d2lfile/6605/7713/scattercalc_print.html] |
||
Revision as of 11:50, 22 December 2013
OpenJUMP Tutorial by Thomas Brown
Contents
Introduction to OpenJUMP
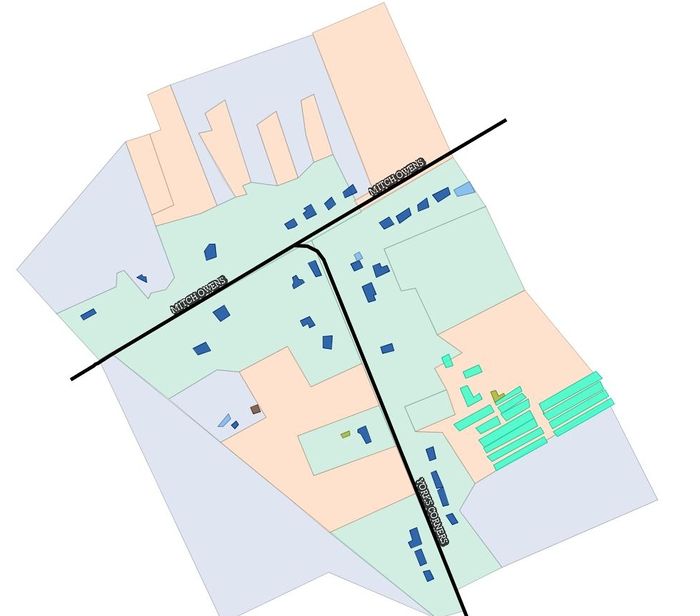
OpenJUMP is a Free and Open Source Software for Geospatial (FOSS4G) program that can be downloaded from http://openjump.org/. It is an excellent software package that is similar to other commonly using Geographic Information Systems (GIS) like ArcGis or Quantum GIS. The feature that really sets it apart from other programs is that the main focus of its tools and functionality leans more towards style. This tutorial will demonstrate the construction of a common thematic map like the one shown in Figure 1.1 below using OpenJump.
Starting up OpenJUMP
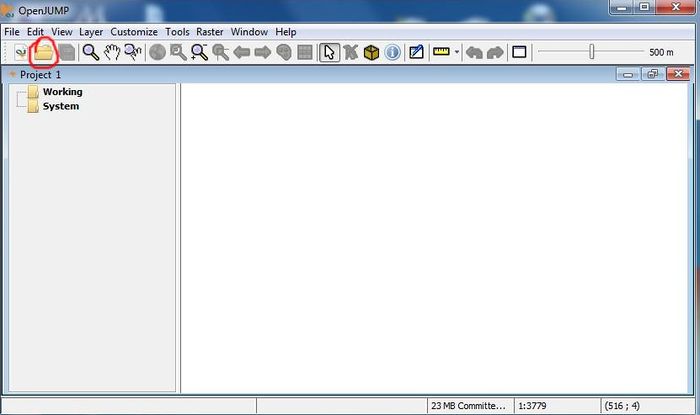
OpenJUMP opens from the ![]() icon and starts off with the open screen shown in Figure 1.2. Add files by using the folder icon circled with red in Figure 1.2. OpenJUMP does support many different file types although some of them require that extra packages to be downloaded and installed. For this reason it is recommended that you use import shapefiles since they work for sure without any other packages.
icon and starts off with the open screen shown in Figure 1.2. Add files by using the folder icon circled with red in Figure 1.2. OpenJUMP does support many different file types although some of them require that extra packages to be downloaded and installed. For this reason it is recommended that you use import shapefiles since they work for sure without any other packages.
Imported Files
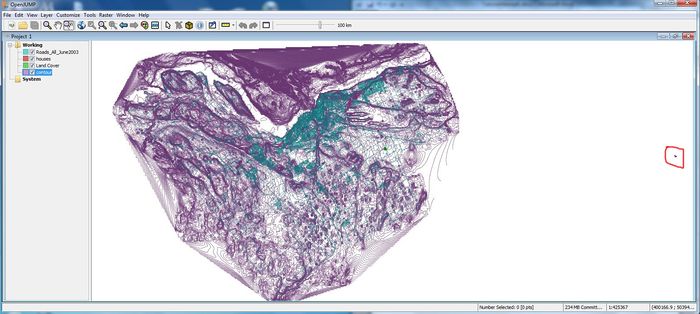
Once the files are imported into OpenJUMP they will be given a default color and style scheme. If one layer is visually blocking another it just needs to be selected in the table of contents in the upper left of Figure 1.3 and dragged to below the layer that it is blocking. A common problem with OpenJUMP is that input files with different projections can end up far apart on the map as shown in Figure 1.3 where the shapefile of houses (circled in red) ended up far to the right.
Manipulating Files with Tools
Since OpenJUMP is designed for easily changing the way that maps look, putting a shapefile back in the right place is fairly simple:
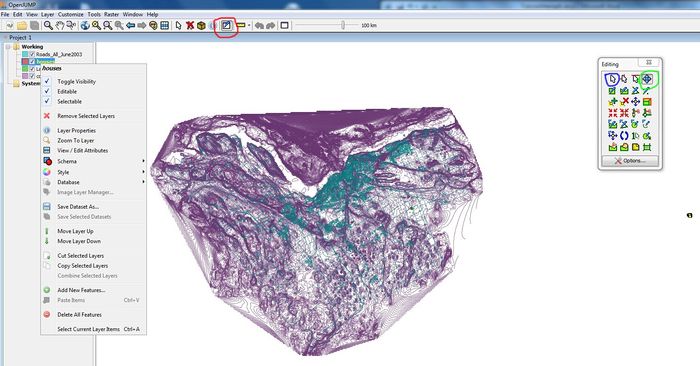
• First, right click the shapefile that you want to adjust in the table of contents and make sure that “Toggle Visibility”, “Editable” and “Selectable” are all checked (as shown in Figure 1.4).
• Second, open the “Editing Toolbox” which is the ![]() icon circled in red on Figure 1.4 and select the “Select Features Tool” (the
icon circled in red on Figure 1.4 and select the “Select Features Tool” (the ![]() icon circled in blue in Figure 1.4) and use it to select the shape that you are editing.
icon circled in blue in Figure 1.4) and use it to select the shape that you are editing.
• Third, select the “Move Selected Items” tool (the ![]() icon circled in green on Figure 1.4) and use your mouse to drag the shape to wherever it should be.
icon circled in green on Figure 1.4) and use your mouse to drag the shape to wherever it should be.
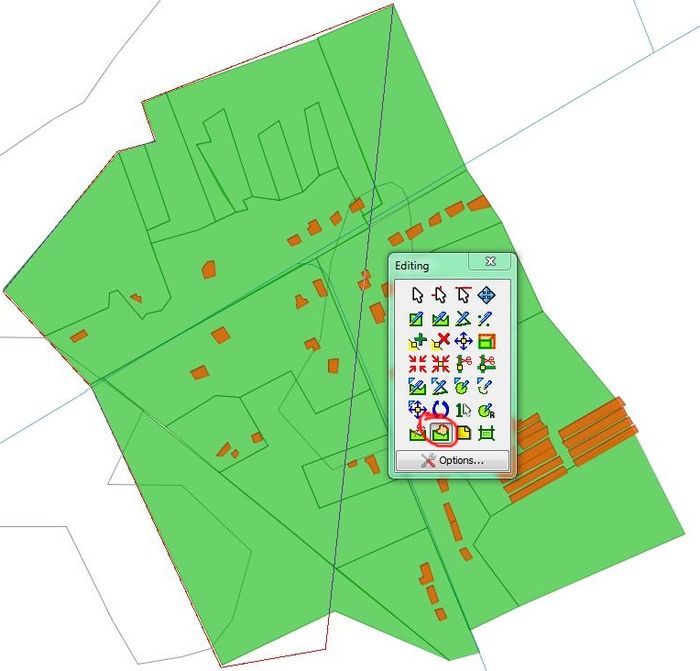
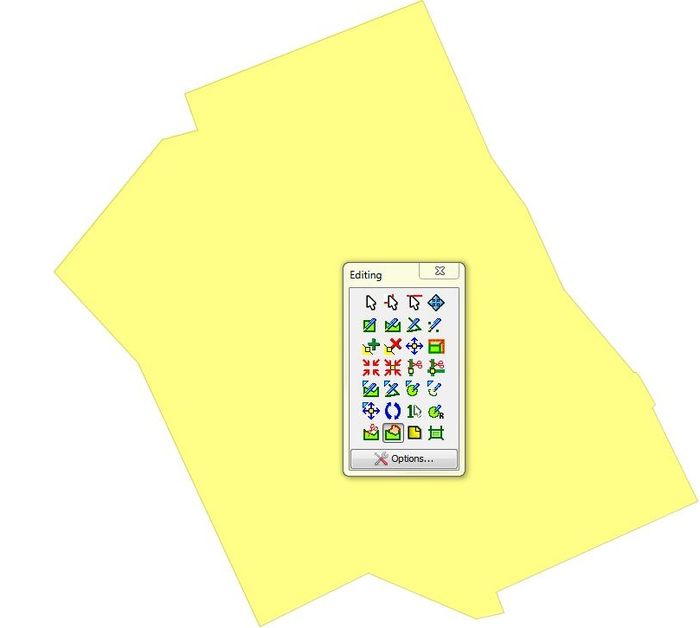
For many maps it will be necessary to clip input files so that they are all within the study area. The first step for this is to design an area of interest mask polygon. The polygon is built using the “Auto Complete Polygon” tool (the ![]() icon in the toolbar circled in red in Figure 1.5). A user can then select vertices of the polygon (as shown in Figure 1.5) and double click to let the polygon finish as shown in Figure 1.6.Note: If a layer is still "Selectable" when right clicked on, the polygon will be joined with it.
icon in the toolbar circled in red in Figure 1.5). A user can then select vertices of the polygon (as shown in Figure 1.5) and double click to let the polygon finish as shown in Figure 1.6.Note: If a layer is still "Selectable" when right clicked on, the polygon will be joined with it.
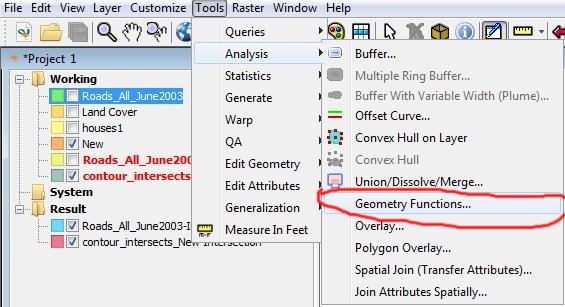
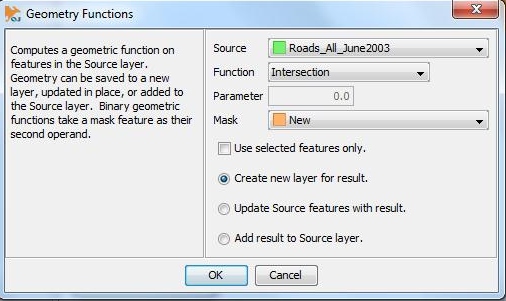
Using one polygon to cut another requires the “Geometry Functions” tool highlighted in red in Figure 1.7. This tool changes the geometry of a shapefile based on the function field. In the case of the example the “Source” layer is where the roads layer is used, the “Funtion” is “Intersection” to find out where the roads and mask intersect spatially and the “Mask” field is where the Area of Interest (AOI) polygon can be added. It is not necessary to change the defaults on the other input fields. The tool and the input are shown in Figure 1.8. Once roads are clipped, any other lines can do through the same process (in the example this includes contours).
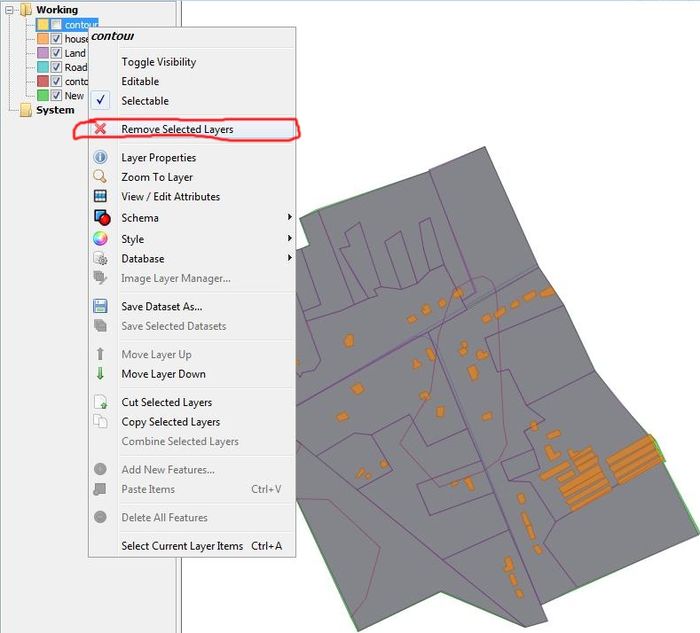
With the new layers formed the original layers can be removed by right clicking on them and selecting “Remove Selected Layers” as shown with the output of the tool in Figure 1.9.
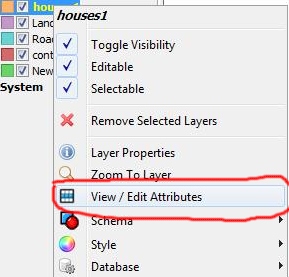
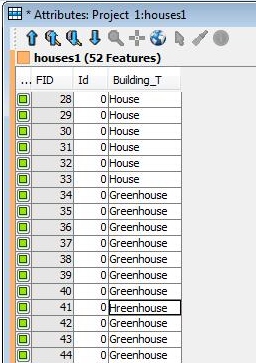
At this point all of the shape files are in place and it is a good opportunity to edit attributes. Do this by right clicking the layer in table of contents and selecting “View / Edit Layer Attributes” (as shown in Figure 1.10). In the case of the example “Greenhouse” is spelt incorrectly in the attribute table. By making the layer editable and entering the attribute table all attributes are manually editable.
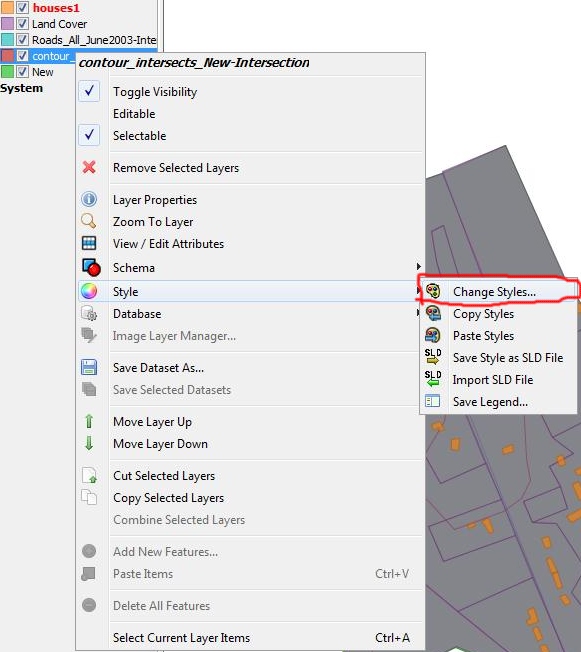
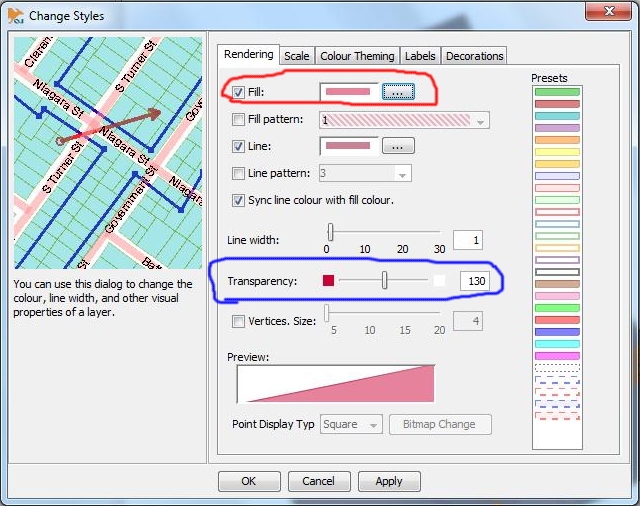
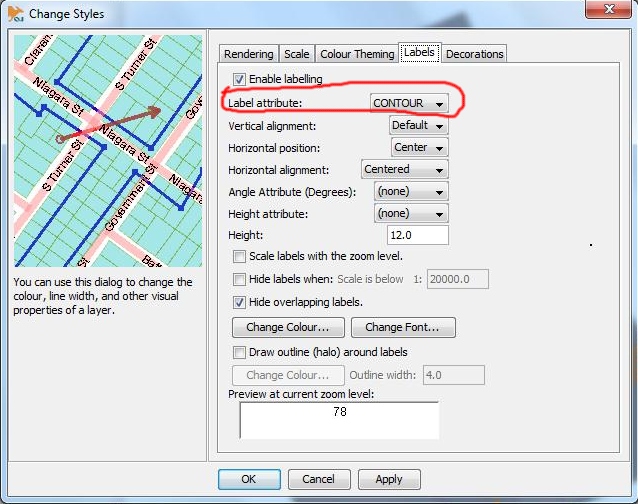
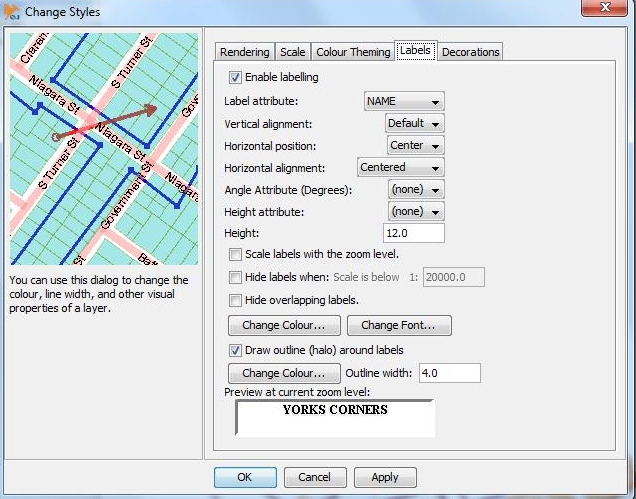
With the files all manipulated correctly it is now time to use OpenJUMP’s stylizing functionality. The first shapefiles to be modified are the lines (contours and roads). Right click the contours file in the table of contents and navigate to “Change Style” ( circled in red in Figure 2.1). From the Change Stlyes interface there are many options. In the case of contour lines on a map they commonly are a light, semi-transparent colour. Note how this is reflected in 2.2 by selecting a light pink colour as the fill (circled in red) and setting the transparency to 130 out of 255 (circled in blue). In Figure 2.3 the “Labels” tab has been opened. It is common for maps with contour lines to label them based on the elevation they represent. Note that the “Label Attribute” (circled in red) has been set to “CONTOUR” (elevation value) and everything else is left as a default. Feel free to mess around with labelling styles but for now the elevation just appearing besides the contour line looks nice.
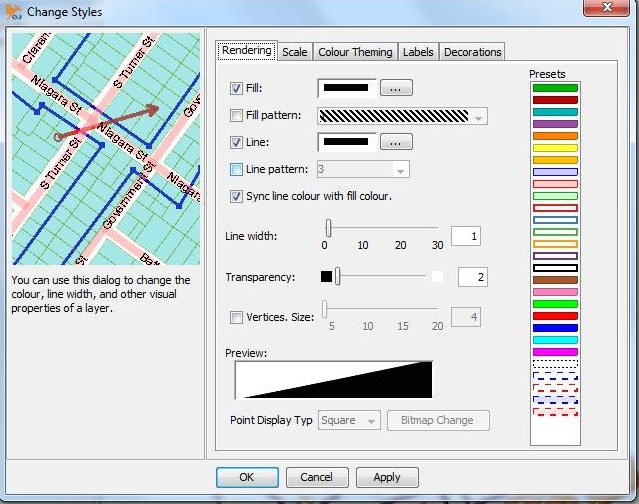
Since roads are also in the form of lines the steps to stylize them are the same. In the case of the example they are given a black fill with no transparency (configuration shown in Figure 2.4). The labels for the street names have been changed to bold Times New Roman font with a halo outline that makes features, that would normally make the names more difficult to read, slightly transparent (configuration shown in Figure 2.5).
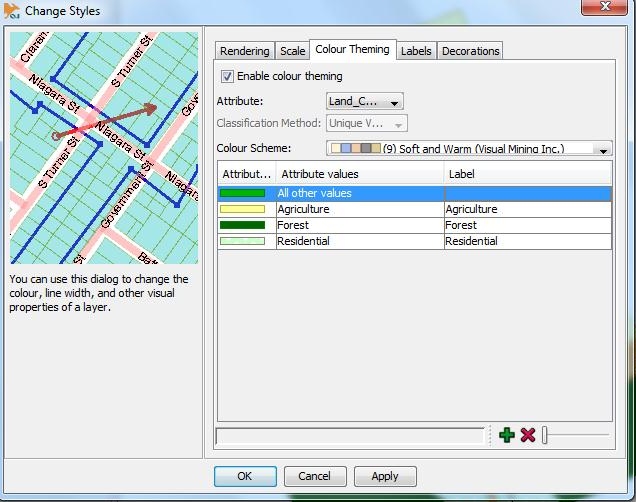
The polygon shapefiles (land use and houses) will implement colour theming to make them easier to interpret visually. Figure 2.6 shows how this is done through the “Colour Theming” tab. The “Attribute” drop-down menu can be used to select the field that will be used to separate the different colours in the map. The “Colour Scheme” drop-down menu contains many options for which colour the layer will be represented by. The table that is influenced by these changes can also be edited manually. In Figure 2.6 the colours being used have all been added manually. The colours used for both land use and houses are all personal preference and are done the same way.
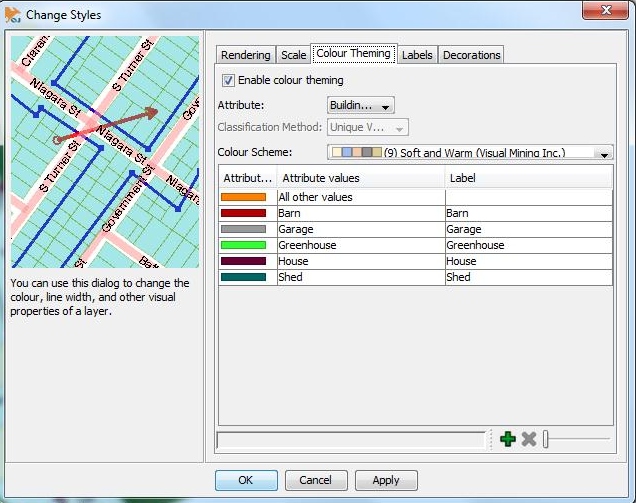
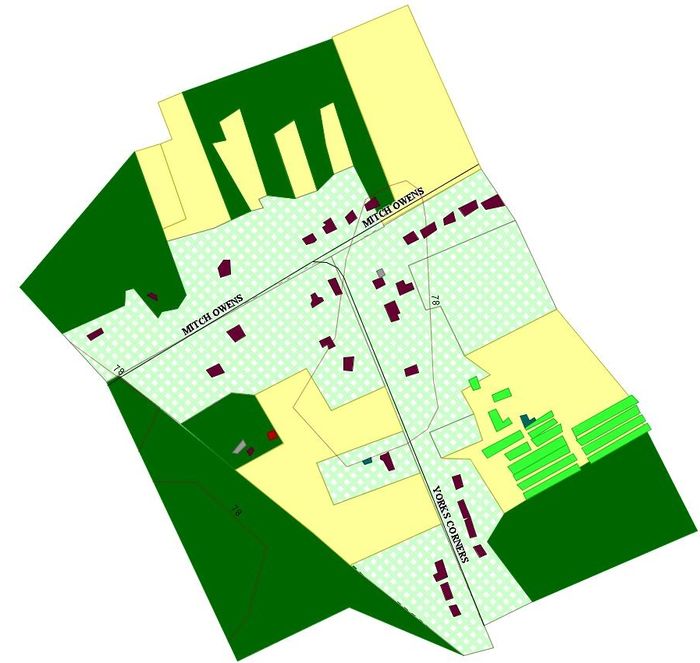
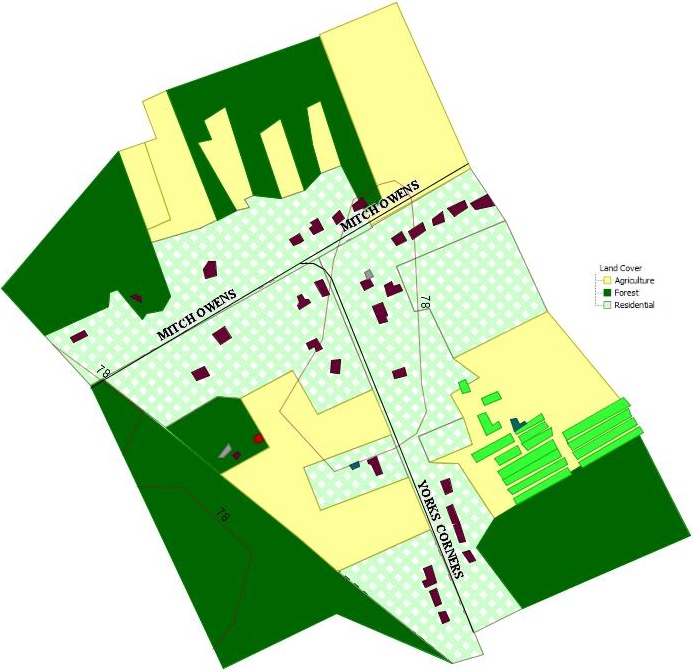
Once the colour theming is complete the output will be a final map product like Figure 2.8. This final map product makes it easy to interpret what is on the map in addition to being visually appealing.
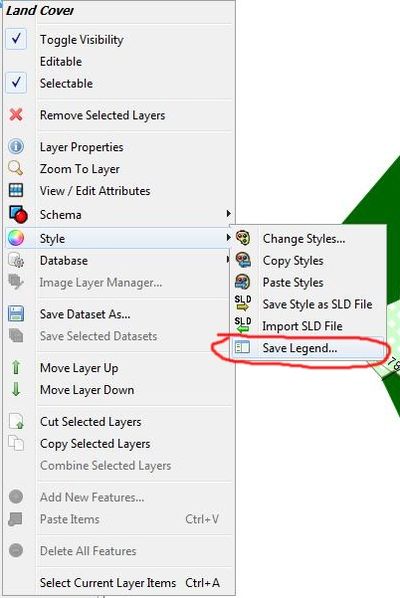
At this point adding a legend will help with interpreting the map. Right click the layer that would benefit from a legend (in the case of this project it will be for land use). Select Styles -> Save Legend (as shown in Figure 2.9). Save the legend somewhere memorable and then use the Add Files icon from Figure 1.2 to load in the Legend image. The image may end up far away from the map itself so use the method shown in Figure 1.4 to move it to the desired location. Once in place the end result should look like Figure 2.10 below.
Styled Layer Descriptor
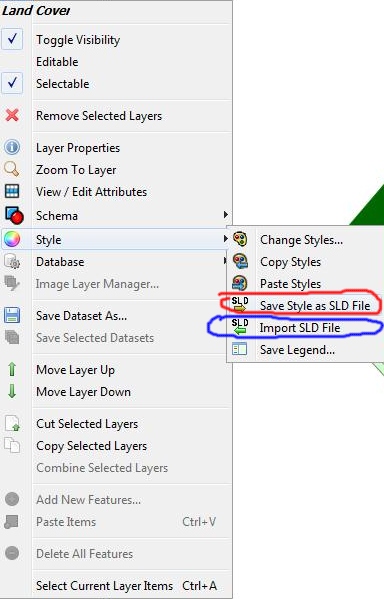
Since shapefiles in general will not store visual styles as soon as the mapping program is closed and reopened all of that work styling is wasted. Styled Layer Descriptors (SLD) retain style information for layer and can be built, imported and exported using OpenJUMP. These files are not only useful for maintaining style in OpenJUMP but since they are written in Extensible Markup Language (XML) they are universally useful for styling webmaps. To build an SLD simply right click on the layer in the table of contents and select Style->Save Style as SLD File (red circle in Figure 3.1). From there the SLD file is stored and can be imported for a layer at any point using the Style->Import SLD File option from the same menu (blue circle in Figure 3.1).
Conclusion
You now have a final map product and SLD files for styling. Try different styles as OpenJUMP has a really great variety.
