Difference between revisions of "Fire Risk Analysis using QGIS"
| Line 16: | Line 16: | ||
[[File:FRA_StudyArea.png]] |
[[File:FRA_StudyArea.png]] |
||
| + | |||
''Figure 1:'' The study area for this tutorial is shown here as a pink grid feature, from just south of Telegraph Cover to Victoria. |
''Figure 1:'' The study area for this tutorial is shown here as a pink grid feature, from just south of Telegraph Cover to Victoria. |
||
Revision as of 10:11, 15 December 2015
NOTE: This is a work in progress, and subject to change.
Purpose
This tutorial will demonstrate how to use multiple tools within QGIS in order to run a fire risk analysis, manipulating vector and raster data, along with the final output of maps. This tutorial uses tools from QGIS' advanced interface, which include QGIS, GRASS GIS, and plugins that you will need internet connection for in order to download them into QGIS. Major tools that will be used in this tutorial include:
Build Virtual Raster Catalog - QGIS, Clipper - QGIS, Merge Vector Layers - QGIS, Raster Calculator - QGIS,
Aspect and Slope - GRASS GIS, Reclass - GRASS GIS,
Heatmap - Plugin, along with other tools.
It is recommended that you have some knowledge of a GIS before attempting this analysis, this is an advanced tutorial.
Introduction
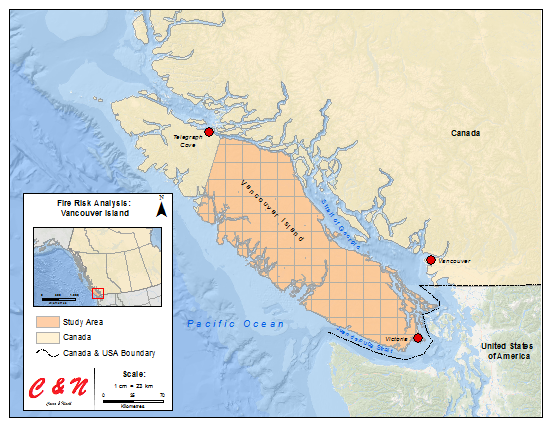
For the purpose of this tutorial, the study area that will be used to demonstrate a Fire Risk Analysis will be approximately 75% of Vancouver Island from just South of Telegraph Cove to Victoria (Figure 1).
Figure 1: The study area for this tutorial is shown here as a pink grid feature, from just south of Telegraph Cover to Victoria.
