Generating Data for Small Operations in QGIS
Contents
Introduction and purpose
The purpose of this tutorial is to guide the layman through a basic QGIS process to generate a map product created using entirely free data and software. Moreover, the tutorial introduces QField as a tool for QGIS to help in collecting data. This tutorial assumes no prior familiarity with the software but does assume average computer literacy. For this tutorial you must know how to find and download software/data from the internet and be able to navigate file folders. The scenario used to facilitate this tutorial is that of a small farm with geospatial needs. The farm in this case is located far from any urban center, in northern Ontario, near the small village of Earlton, ON. The challenges to this farm in generating their own geospatial products are numerous but by using freely available data and software we can generate some basic map products that meet those needs.
The challenges that the small farm or business must overcome:
- Software: traditional GIS software is expensive, thankfully open source software has many of the same capabilities and can generate comparable products for free.
- Knowledge: taking the time to learn a whole new skill set in order to produce a basic map is not necessarily within the time or interest of the small business and hiring someone with that knowledge is expensive.
- Data: for rural locations there is often very little freely available data that is fine scale enough to be viable at the single acre resolution. Commissioning these data is expensive. Generating that data from your own GPS or Aerial images is a viable alternative.
Software and GPS
QGIS 3.8.3
Available for free at https://www.qgis.org/en/site/forusers/download.html select the latest version from the standalone installer. QGIS is free open source GIS mapping software. It will allow us to import all our data and generate our map.
QField
Available for free at https://play.google.com/store/apps/details?id=ch.opengis.qfield&hl=en for Android mobiles or tablets.
GPS
If choose not to use QField, or you plan on only using QField for collecting images and digitizing and you own a GPS device you can go out a get specific coordinates for some of your points. GPS devices come in a wide price range, with the low end units being about 200$. If you do decide to import your own GPS points this tutorial will show you what tools in QGIS are needed but will not go over GPS functionality. A GPS can be a great asset in locating points and features that do not appear on an aerial image. When using a GPS you should also be aware of the accuracy of your unit. Many lower end GPS units have a +/- 3 meter error on single points. Familiarize yourself with your unit and know how well you can trust the points your generate.
Data sources
The data we will be using will be data we generate ourselves from the aerial images or from GPS coordinates we have gathered ourselves. In some cases you may be lucky enough to find open data from other sources such as the governments open data portal (https://open.canada.ca/en/open-maps). For the purposes of this tutorial we will be generating our own data since many of the data available through open sources is not high resolution enough for the small plot of land we are working with. We will also be utilising Google earth satellite imagery.
Tutorial
1. Starting a project in QGIS
In this step we explore how to start a new project in QGIS, where you should save your data and projects, and any settings you need to adjust prior to starting.
- Before you start you project it is a good idea to create a folder in which you will save your projects and any other QGIS related files. What ever you decide to name your files make sure you stay consistent in the naming convention you choose. GIS projects have a tendency to generate a lot of files and it will be much easier to parse through these if you adopt a clear and consistent naming convention for your files and data.
- Start QGIS
- Once started you will have a blank project to work with. If this is a later visit you can select any one of your project to work with. When you start a new project you will click on the small white page icon “New Project”, then “Save As”, navigate to the folder you created for your qgis projects and make sure you save your project as a QGZ file.
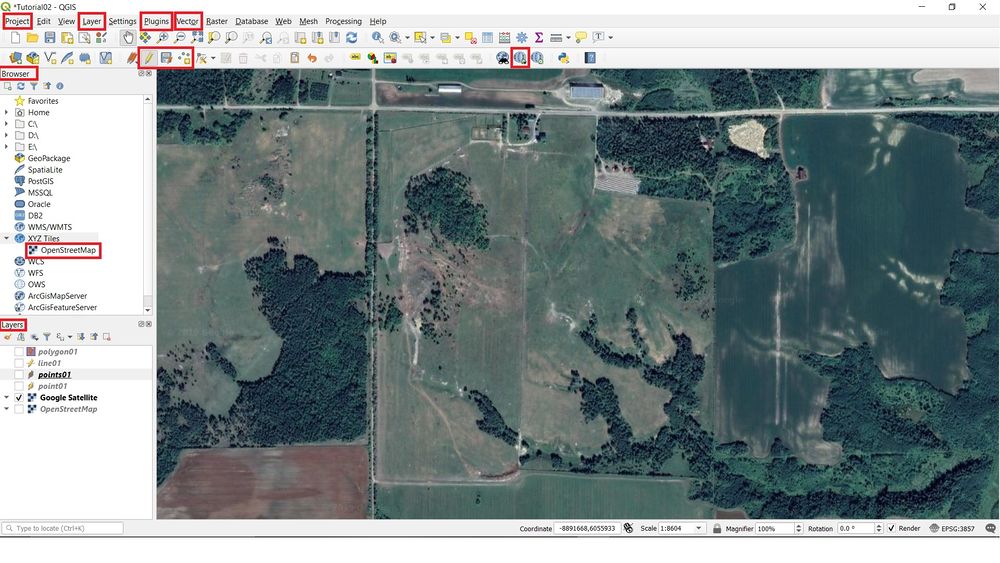
- Click on “Projects” and go to “Properties”. Here we will find all the information about our project.
- You can see where it is saved in the “project file”
- “Save paths” as relative
- Under “Measurements” note and/or change the units of measurement
- Under “Coordinates Display” note and/or change “Display coordinates using” to the coordinate system you prefer. It might be useful to change it to match your GPS coordinate system if you are using one. If not select the one you are most familiar with, likely Degree, minutes, seconds.
- In the left hand menu the CRS will let you select the Coordinate reference system for your region. For our purposes the default will do.
- At the bottom of the properties box click “Apply” and “OK”.
- We now need a base map that we can reference. This needs to be an aerial image. In this case we will be using the Google maps satellite imagery basemap. This can be accessed from QGIS.
- In the tool bar at the top of the screen click “Plugins” and “Manage and install Plugins”. Plugins are an important part of QGIS and allow you to access additional free functionality in QGIS. If you want to do something else in QGIS that is not included in the base version you will likely have to use a plugin.
- In the search bar type “QuickMapServices”, select the plugin that comes up and Install it. Make sure it is check on.
- In your tool bar a new icon should have appeared in the shape of a globe. Hover over it and it should say QuickMapServices. Click it and select “settings” at the bottom, then “more services” in the pop up menu tabs. Click “get contributed packs” and “save”.
- Now when you click on the QuickMapServices icon you should have a long list of basemaps to choose from. Select “Google” > “Google Satellite”. You should now have a satellite image of the world. To find the location of your farm or business you will need another basemap layer to help. You can either select another base map from the Quick map services or follow the next step.
- To the Left in the “Browser” menu click “XYZ Tiles” and “OpenStreetMap”. This opens and street map basemap.
- Use the street map to navigate by zooming into the location of your farm. You can click and drag your way around the map and use the “Zoom In” tool to zoom in. To stop zooming select the “Pan Map” tool (little hand).
- Once you’ve found your property go in the left hand side of the screen “Layers” menu and deselect the OpenStreetMap layer. You should now have a satellite image of your property.
Figure 1. QGIS project, important tools
2. Importing data into QGIS
Here we will be discussing importing data into QGIS. While we are generating our own data in QGIS it is important to know how to import data for future projects and when dealing with data that you do not generate yourself. This is also especially useful if you plan on importing GPS data. Note: We will focus on vector data. Vector data is any sort of spatial data that consists of a single point, line, or shape (polygon). If your data are in a pixel grid format then it is likely raster data.
- To import data you need to know what the data format is. If you data format is unsupported by base QGIS then you may need to use a plugin.
- To import your data go to the “Layer” tab at the top of the screen and select add layer.
- For normal vector data select “Add Vector Layer” and in the source navigate to the data location in your folders. Open it and it will appear in your layers.
- For data in an excel sheet (xml, csv, etc), select “Add Delimited Text Layer”, in the “file name” browse for your excel file, then select the format in “File format”, in Geometry Definitions select which column represents your x and y coordinate values. “add”
- Note that for excel data it must be stored in excel in a clean manner. This means that the first row must only contain the column headers, all subsequent rows must only contain your data. Avoid special characters and make sure all the data is consistent. For example when using words make sure the same word is used consistently i.e. “tree” and not “tree”, Tree”, “maple”, etc. If the data is numerical then do not include any letters or special characters. Only a single value per box.
- Once your data is imported it will be in the left “layers” menu. You can click and drag it to organize it (put it in front or behind other layers).
- If you import data from open sources you may notice that at the scale we are working at the data is very low resolution and does not provide good insight. When you download data from an open source portal take the time to read the metadata and information on the file you are downloading.
3. Creating vector polygons, lines, and points
We explore the three main types of vector geometries.
i. Points
ii. Lines
iii. Polygons
- To create your data go to “Layer” and the “Create Layer”>”New Shapefile Layer”
- In the menu:
- Next to “File name” go browse where you want to store this layer and what you want to name it.
- “Geometry type” lets you select what type of geometry you want to make point, line, polygon.
- In “New Field” you can create the attribute table column headers that you will be using and what type of data will be stored there. Don’t worry about creating all the fields you will need now since we can create new ones later as needed but it is useful to create one or two at this stage to identify the geometries you will be creating.
- The name is the column header and should describe what is stored there. Make it short, 1-2word max.
- Type is where you select the type of data, this is very important. If you plan on storing numbers make sure you select whole numbers or decimal numbers. If you don’t do this you will not be able to do calculations with the data you enter in that column.
- The length is how many characters are allowed for a single point
- “Add to field list” to add it
- When you are done click “OK”
Note: As you create new fields and generate you own data it is critically important that you stay consistent in your naming and data entry convention. If entering numbers make sure your field is set for numbers, when entering text such as descriptors stick to short preselected categories that are all written and spelled the same way. You can create comment field to take notes if you want and need it but searching through this field will be more difficult. You are preparing this data for all future uses. Getting it right now will save you head aches later.
- Now that you’ve created your layer(s) you will notice that they’ve appeared in the “Layers” menu on the left but your map is still blank. We now need to create our features.
- In the toolbar click the pencil icon “Toggle Editing” and then to the right of it the “Add point/line/polygon Feature”. The edit session stays active until you click the “Save layer edits” icon.
- Points:
- As you create you points you will be prompted to fill in the fields you created earlier.
- Lines
- To create a line click on the starting point, every subsequent click will be a new bend in the line. With this method you can create a line that runs a winding road or the edge of a field. Once you’re done creating a single line right click and you will end that line and be prompted to fill in your fields.
- Polygons
- Creating a polygon is similar to creating a line. Every click will be a new corner in the closed shape you create. When you are done right click and fill in your fields.
- Points:
- Once you’ve created your features save you edits. Any time you want to edit a layer you will need to toggle the edits on again.
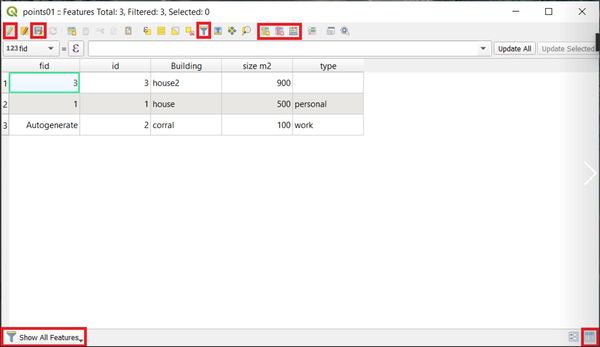
- To check your work and modify the attribute tables right click on the layer and click “open attribute table”
- If you plan on adding or modifying the table you need to toggle edits on.
- When creating new fields we can use the power of QGIS to generate fields with measurements such as perimeter length, length, area, etc. This means you don’t nee to measure length manually.
- For example if you want to calculate an area field for your polygons in the tool bar click the “Open field calculator” icon.
- Name you new field, select the field type, in the scrolling menu go to “geometry” and double click “$area”. Any operation with “$” in front will be calculated for all rows. Note that there are $length, $perimeter, etc options. Explore these as you need them. Note that any geometry you calculate will be in the units you specified at the very beginning when you created your project. Once you’re done click “OK”.
- If you need the specific coordinate of you points the operator names are “$x” and “$y”.
- “new field” and “delete field” allow you to create and delete field.
- If you have a lot of points and you want to select a few you can use the “Select/filter features using form” icon. This will open a menu that allows you to specify what features in your list to return. This is a particularly useful tool when you have a large dataset and you only need a few points.
- Note that if ever you need to return to the table view in the attribute table there is a small icon in the lower right hand side “switch to table view”.
- Once we are done with all our edits and creating new fields we have to export the layer we created so that we can use it in other projects.
- In the layers right click the layer you are exporting, go to “Export” and “Save feature as”. Leave the format as geopackage, in the filename browse to the folder where you want to store your data, name it something clear and consistent with other similar data you’ve generated and name the layer. Click “OK”. You will notice that a new layer has been added with the name you gave it. Delete the old layer you were using.
- Congratulations you can now use the data you generated in any other project by finding it in the folder where you saved it.
- You can also create new features from a feature you created. If you make a specific selection in the attribute table you can export only your selected rows that you need. For example if you’ve been creating points for trees and you want a layer with only maple trees you can select the maple only and export that as a feature. To do this go to “Export” again but this time “Save selected feature as”. You now have a feature with only your selection.
Figure 2. Attribute table
4. Other tools and features
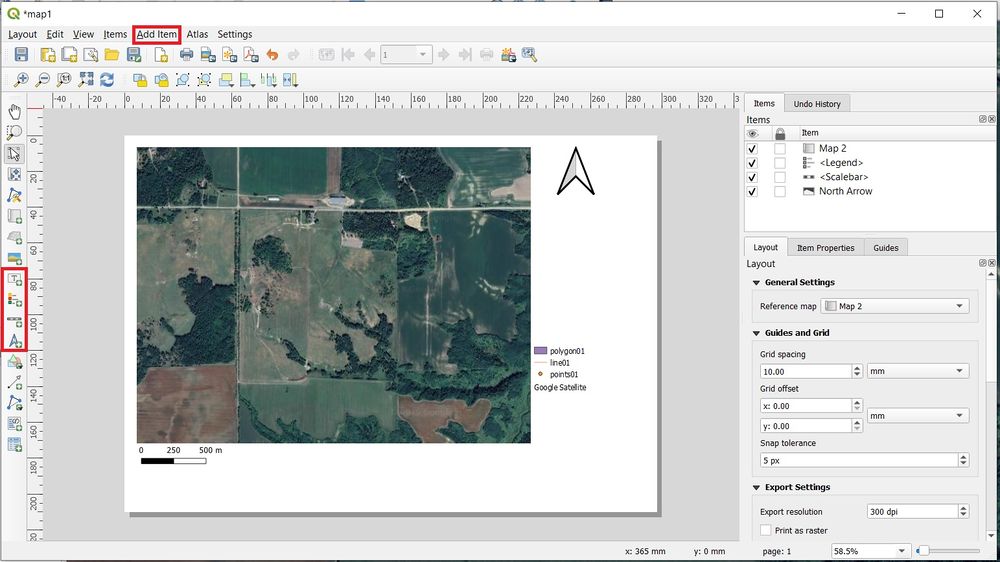
QGIS is a powerful platform that can let you use view and analyse your data in many different ways. For the data you create you should familiarize yourself with the “Vector” tab at the top of the screen. The tools here let you analyse your data beyond simple geometry and may help you plan out projects, merge data sets, calculate statistics, etc. These tools are numerous and it is best you explore them on your own or research them as you need them. Remember that if you run into a challenge there is likely someone who has already solved it and has an easy answer for you. 5. Creating a map layout - To create a printable map layout go to the “Project” tab, and “New print layout”. This will prompt you to name your map layout and then open a black map layout. - To add your map do to “Add item” and then “Add map”. Click and drag the map window on the blank layout. - To add features the left hand tool bar has a number of features to add such as scale bars, north arrows, legends, etc. - If you want to modify these you right click on the feature on your map and go to “Item properties”. - Save this map layout with you project. - The map layout tool is also very powerful and lets you make some custom map designs. Explore the tools available to create the maps you need.
Figure 3. Map layout
5. The use of QField
QField is based on QGIS and provides a simple touch-optimized user interface for collecting and editing geospatial data using mobile devices. You can find more information about QField on its documentation site https://qfield.org/docs/index.html.
1- Start by installing QField onto a mobile device (phone or tablet) running an Android system. You can install QField from the Google Play Store.
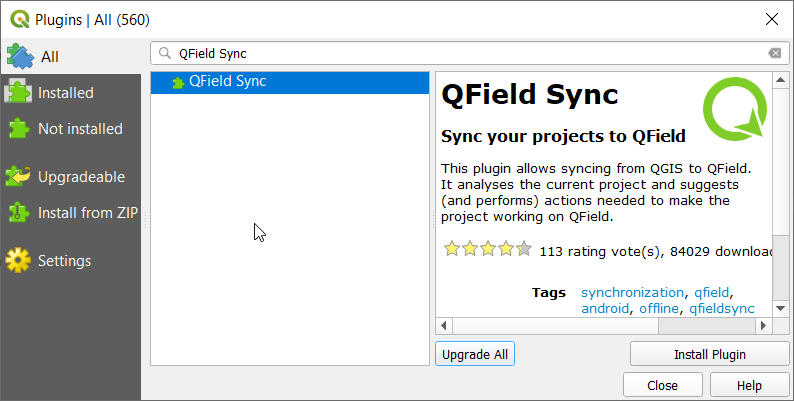
2- In QGIS go to the plugin library and search for QField Sync.
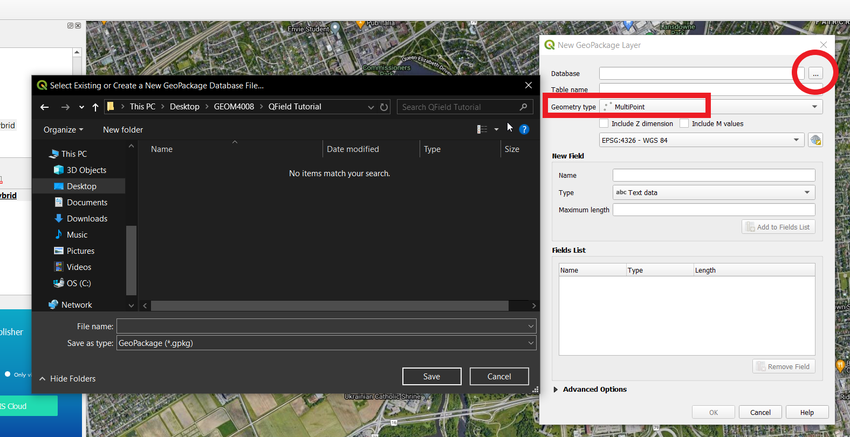
3- The first step in creating a QGIS project that can be opened in QField is to create a geospatial dataset which we add data to using forms in QField. Hence, we create a GeoPackage dataset
4- Once the new GeoPackage Layer options pop-up, next to data base, click the ... on the top right hand side and choose a file to save the layer and to give it a name, make sure to select the layer type. In our case we will be collecting multiple points, se we select a Geometry type MultiPoint and the name for our scenario is Carleton University Buildings.
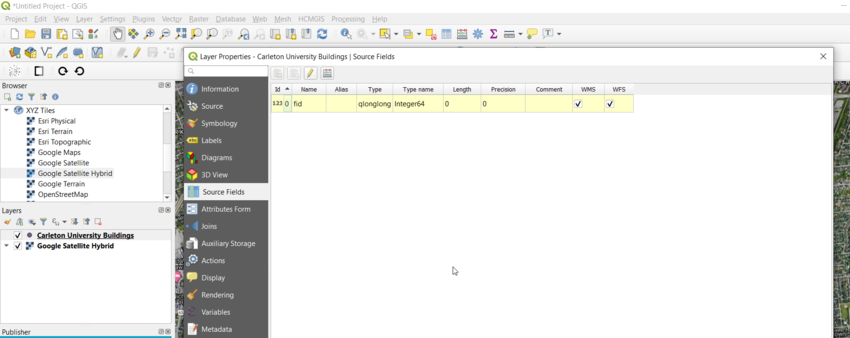
5- Go to layers and double click on the layer we just created, layer properties pops up.
Figure 7. Layer Properties
6- In the layer properties, enable editing and then add a new field.
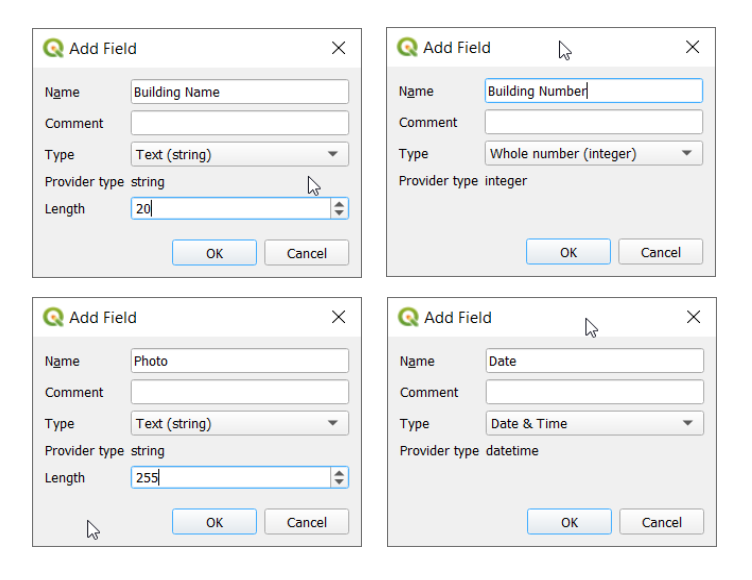
7- In this scenario, we want to collect information about Carleton university building, we create a field to add:
* Building Name [ gets a Text (string) type ]
* Building Number [ gets an Integer type ]
* Photo [ gets Text (string) type ]
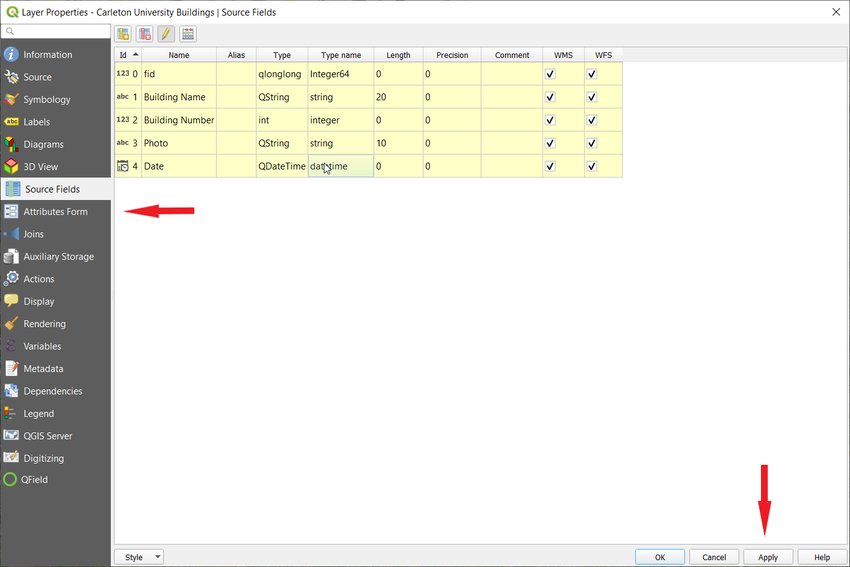
* Date [ gets a Date & Time type ]
8- Click Apply, then Go to Attributes Form
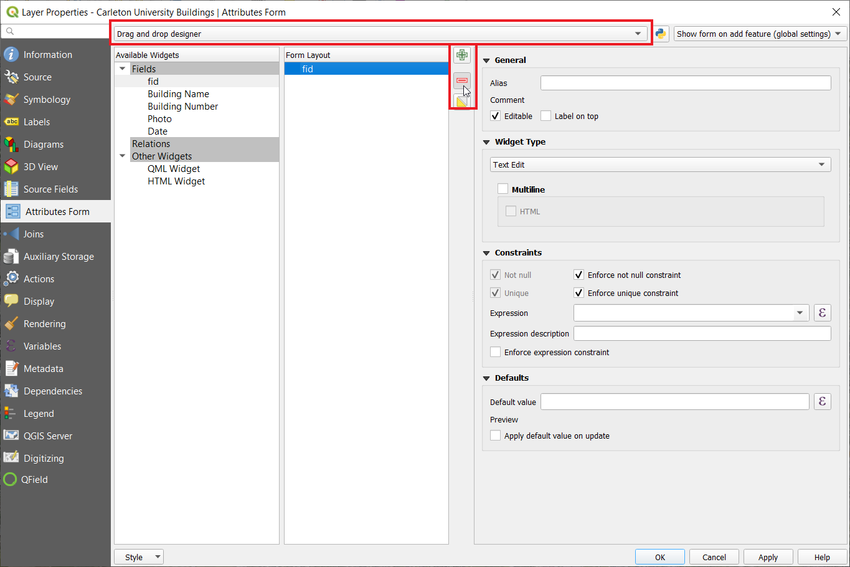
9- From the top menu, choose Drag and drop designer, then delete fid from Form Layout using ( - ) icon
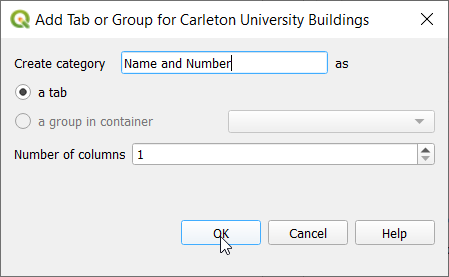
11- Click the ( + ) icon to add a category, this will allow the user to have neat data entry categories. In this example, “Name and Number” and “Photo and Date” categories are created.
Important note: Make sure to drag and drop on the category name, otherwise QGIS and QField will not show fields for data entry. Alternatively, if the user chooses not to categorize data, the software will allow for data entry with no issues.
12- Repeat step 11 to add another category for "Photo and Date"
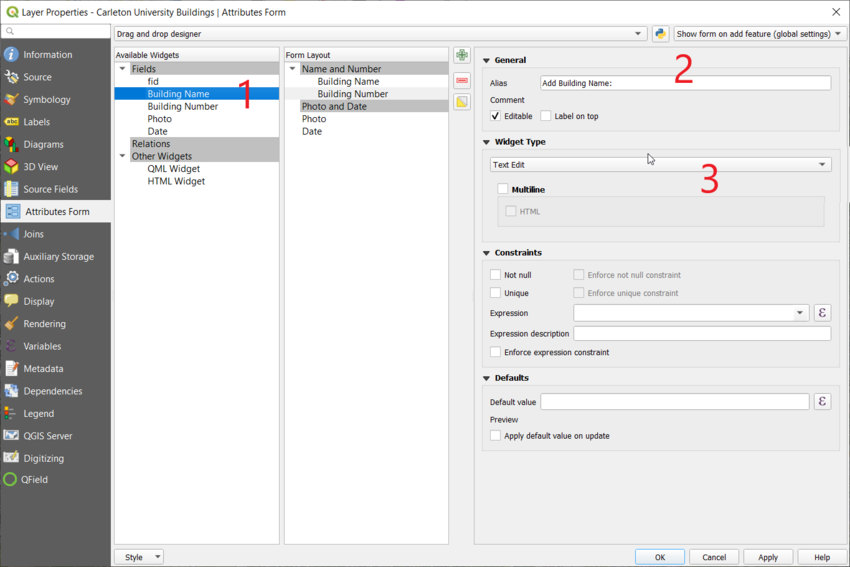
13- Select a field so it is highlighted under Available Widgets then select its widget type from the drop-down list under Widget Type as shown by #1 on Figure 14. You can also give the field an Alias which will appear on the form instead of the field name; this could be a request such as “Add Building Name:” as shown by #2 on Figure 14
14- Change the widget type of Building Name to Text Edit as shown by #3 on Figure 14
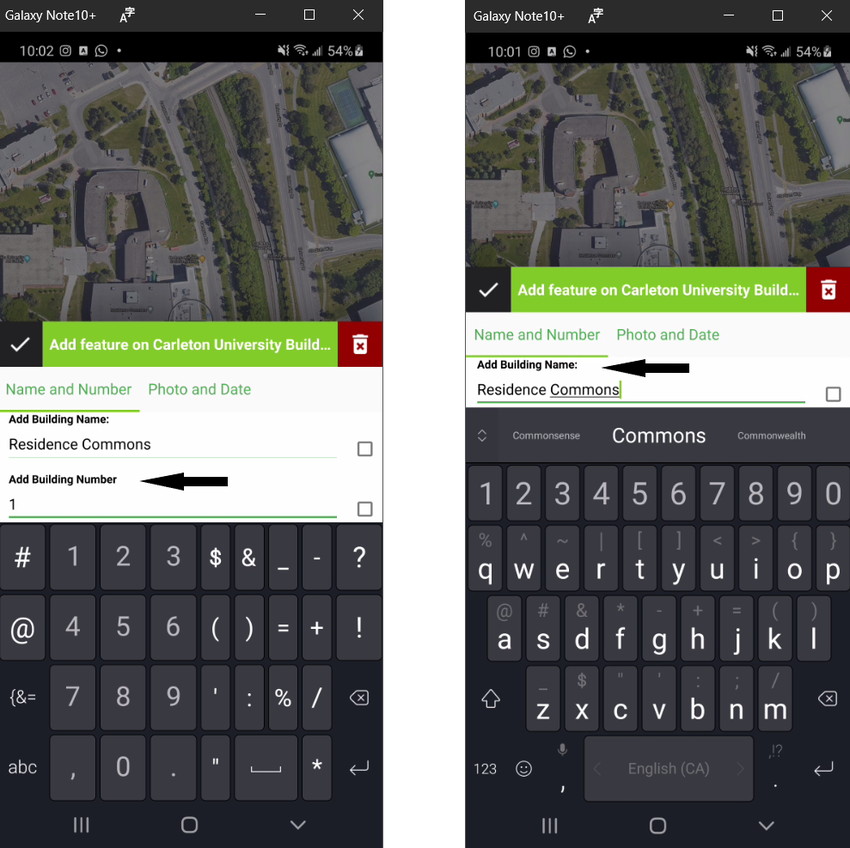
15- Repeat step 13, change the widget type of Building Number to Text Edit, this will allow QField to use the Android device Keyboard only showing the number pad since Building Number is an integer.
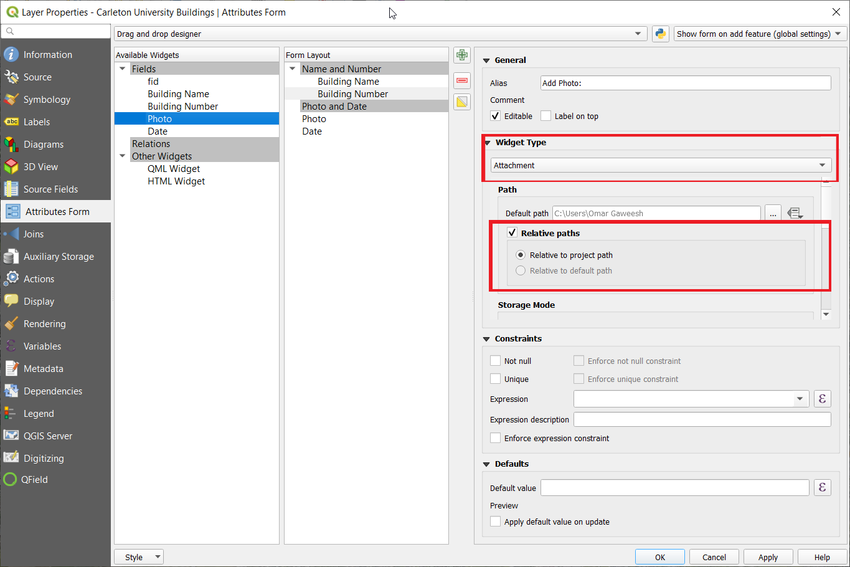
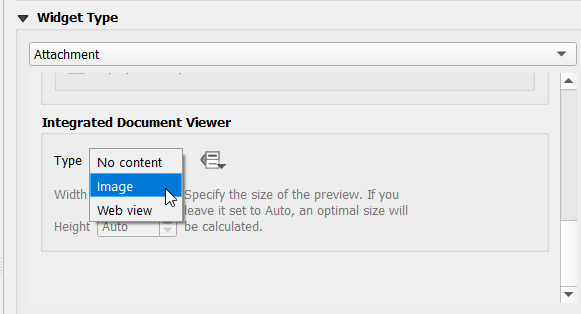
16- Repeat step 13, change the widget type of Photo to Attachment, make sure to check Relative paths, scroll down and change the type under Integrated Document Viewer to Image
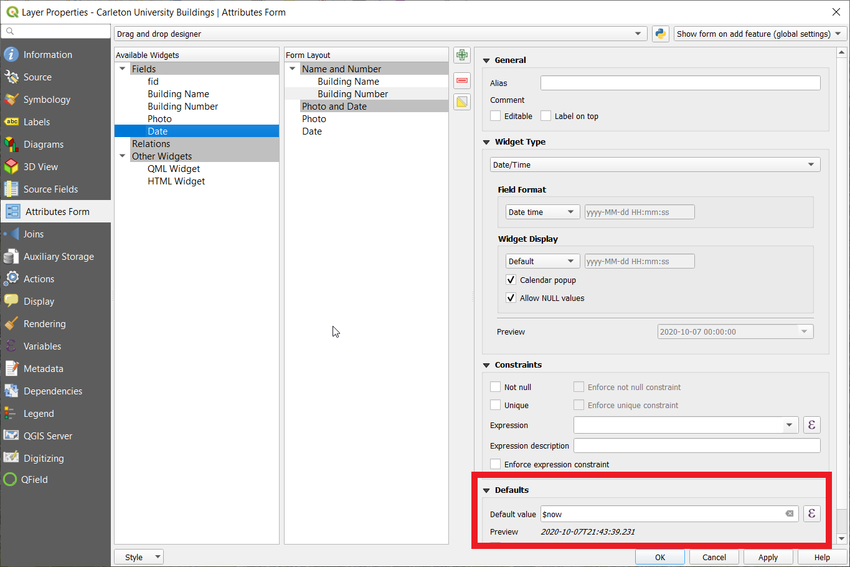
17- Repeat step 13, change the widget type of Date to Date/Time, uncheck Editable and change the Default Value to $now in order to acquire the real time of the device at the time of adding the data.
18- Click Apply, then Ok
Now that we have our input fields ready to go, we use the plugin QField Sync to prepare our project to be used on our Android device
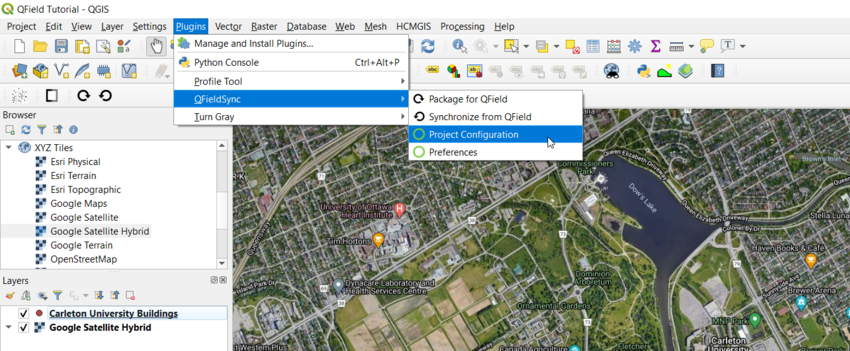
19- From the dropdown menu Plugins, hover over QFieldSync and click Project Configuration
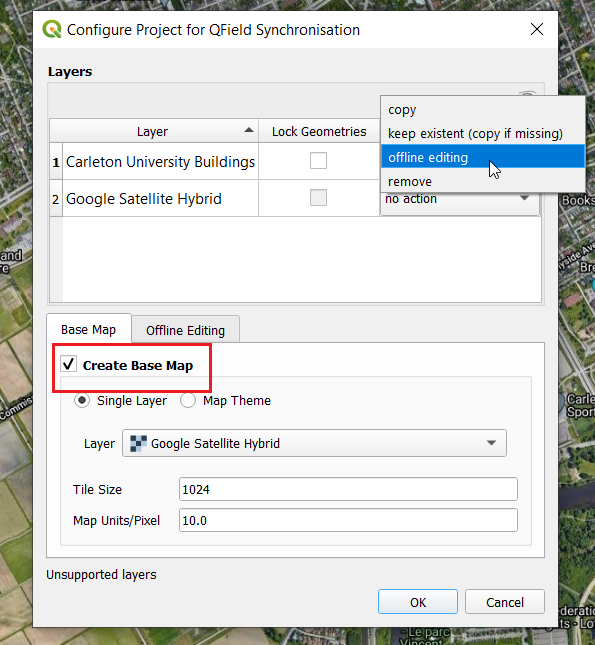
20- Change Actions to offline editing for the layer we created and no action for the base map, make sure Create Base Map is on to aid us with digitizing then click Ok
QFieldSync Project Configuration
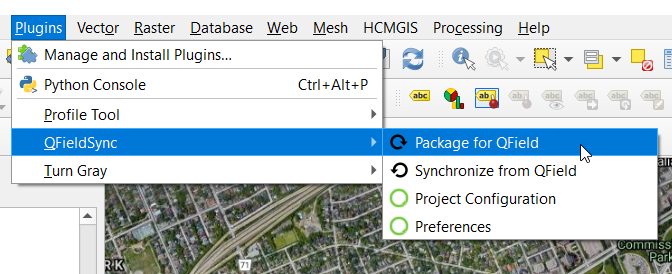
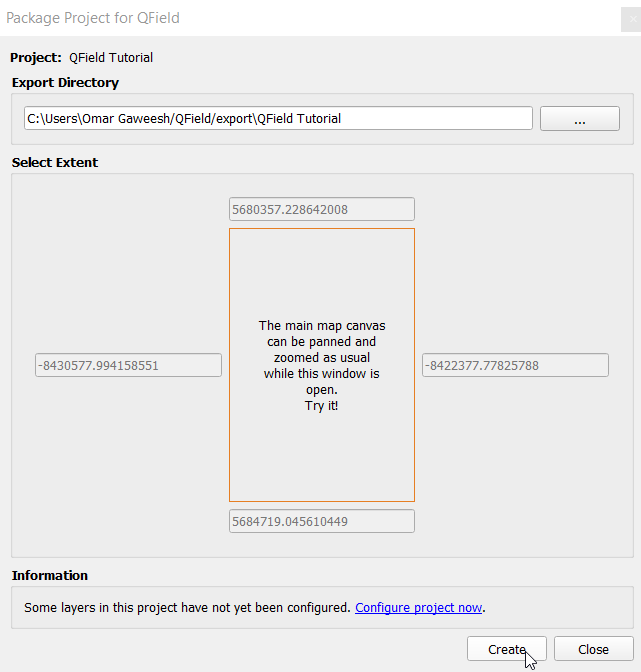
21- Now that our project is configured for our Android device, we go back to the dropdown menu Plugins, hover over QFieldSync and click Package for QField, select and exporting directory then click create.
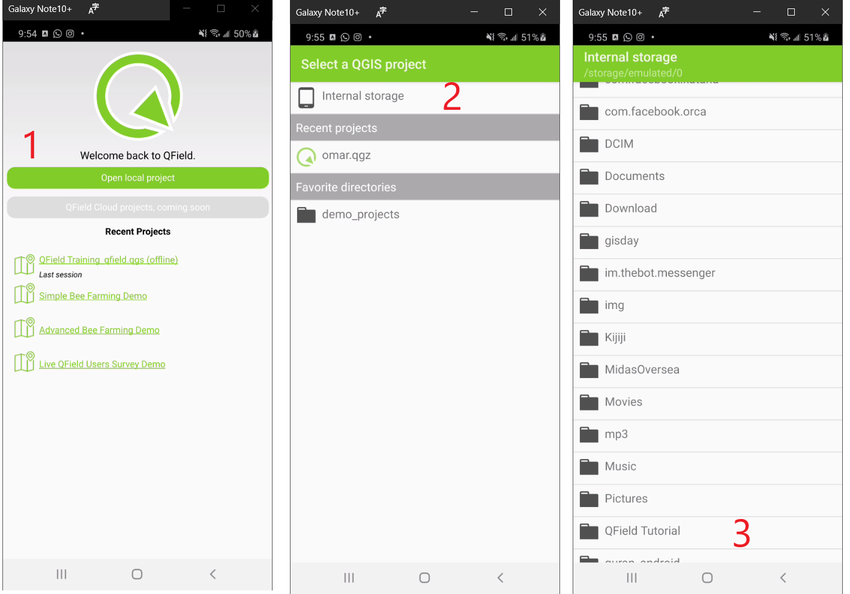
22- Move the exported file to your android device internal storage or SD card and open the app.
23- In QField, Open Local Project > Internal storage (or SD card if available) > Open the folder and select the file with the extension (.qgz)
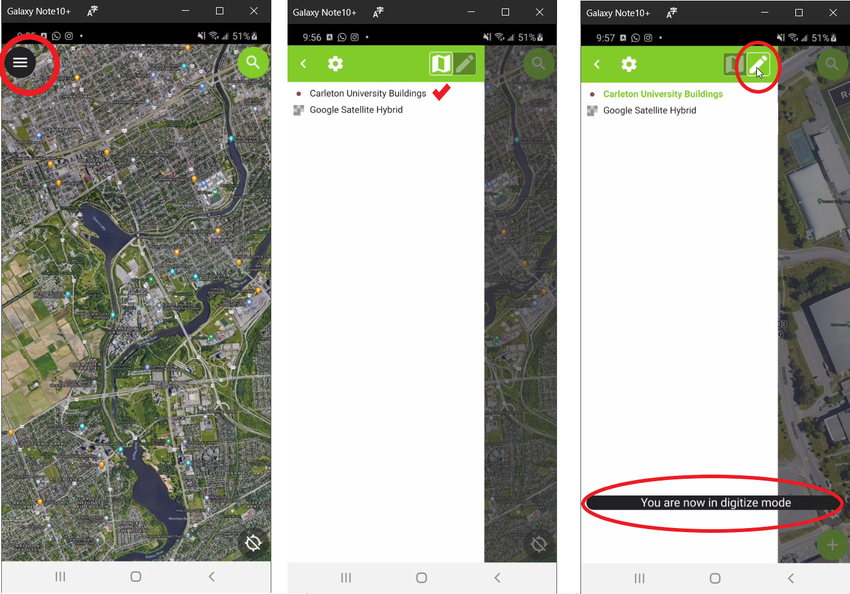
24- From top left corner, open the menu, choose the layer we created earlier and click on the pen icon to start digitizing
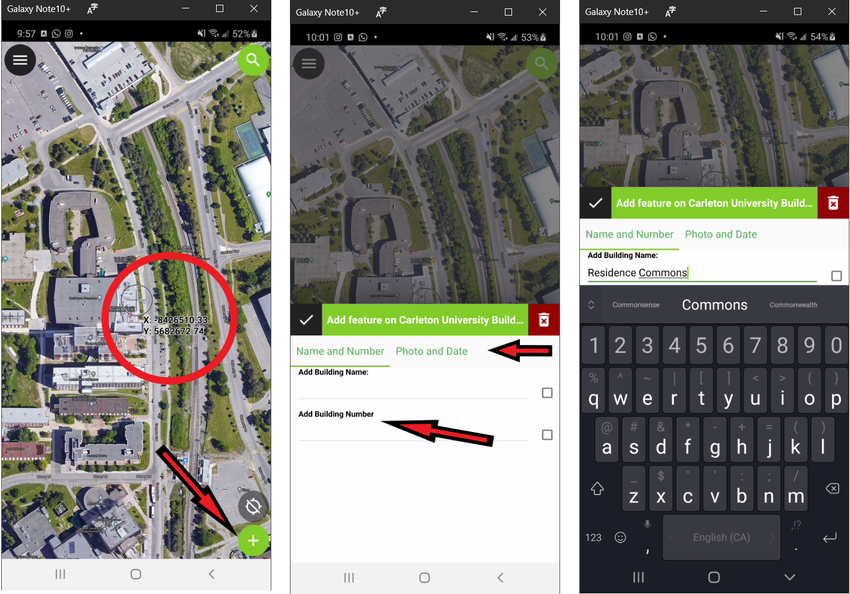
25- Start adding point by clicking the green (+) icon in the bottom right corner of the screen, adding a point will open up a dialogue where we can enter the info/attributes into the fields we created earlier in QGIS, for our tutorial, we will add Carleton University Residence Commons as our point.
Note 1: the categories and Aliases we created earlier. Moreover, QField is able to extract the coordinates of the point we add using the base map, in our case, the base map is Google Earth Hybrid using the following coordinate system: EPSG:3857 - WGS 84 / Pseudo-Mercator - Projected
Note 2: when inputting information, selecting Building Name opens the Alphabet in the keyboard while selecting Building Number opens the Number pad of the keyboard, see step 15 for explanation
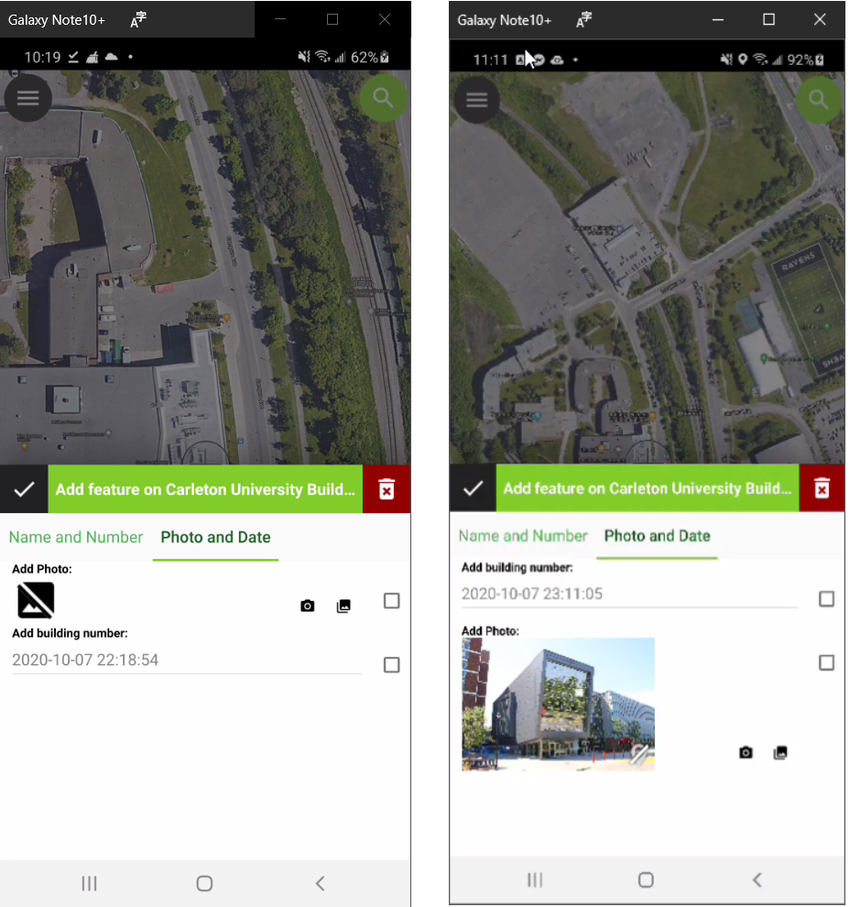
26- Add a photo to the the point, notice you can use the device camera or attach an image from the storage of device, for the sake of this tutorial we do the latter.
Notice: the device date and time is different, this is due to 2 separate times as the point was added, deleted then added again some time later. That highlights how the device captures the time instantly.
27- When done adding the points, stop digitizing, that will save changes. Import the project back into your computer.
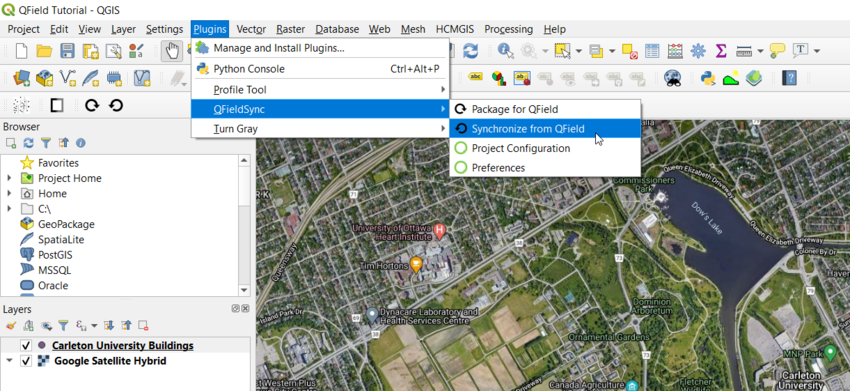
28- In QGIS we go back to the dropdown menu Plugins, hover over QFieldSync and click Synchronize from QField, that will take our new inputs we added in QField and sync it with our project we created earlier.
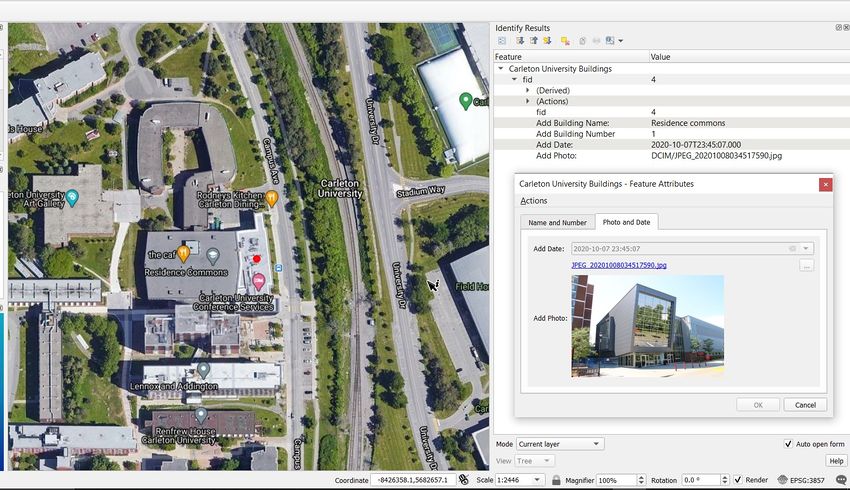
29- Open in QGIS, and use identifier features, this shows the results of what we added.
Conclusion
Using the steps outlined here should allow you to start using QGIS for basic geospatial tasks. The tasks outlined here are very basic and QGIS is a powerful tool especially when you start tapping into the open source community for support and plugins. If ever you run into a new problem not outlined in this tutorial it's as easy as a google search to find the answer you are looking for.
