Exploring Hydrological Analyses using SAGA GIS
Contents
Introduction to SAGA GIS
SAGA GIS stands for System for Automated Geoscienific Analyses. It is a Geographic Information System software program designed to easily and effectively implement spatial algorithms, for real world situations and education. This geospatial software offers a continuously growing comprehensive set of geoscientific tools/methods. The program has an accessible graphical user interface with various visualization options to help users easily operate the various analysis tools. SAGA is capable of running on both Windows and Linux operating systems. SAGA GIS also comes at no cost for the user because it is a Free Open Source Software for Geospatial analysis (FOSS4G). Being a FOSS4G program allows a high degree of freedom for the user; it allows the user to run the program for any geoscientific purpose, to modify the program, to redistribute copies of it, and to improve the program while sharing those improvements with the public. More information about this program is available at SAGA GIS's Website.
Hydrology Crash Course
Purpose of Tutorial
Introduction
Data
In order to conduct this tutorial and appropriately follow the procedures you will first need to download data that is hydrologically correct and has elevation values for the entire study region. For the hydrological analyses you will essentially need to download a fully processed digital elevation model (DEM) for the region you are interested in. One important thing to note when retrieving DEMs is to make sure that if the elevation data for your area of interest is in separate tiles and requires that they be merged, you must insure that the DEMs were developed at the same resolution, cell size and during the same project. If these ideas are not followed it is possible that the tiles have cliffs within the DEM where the merging has occurred. In specific to this tutorial the study area will be the Okanagan Lake region for which a processed DEM has been acquired from the Natural Resources Canada Geospatial Data Extraction Tool. This data extraction website is great for getting good processed elevation data for much of Canada and also contains other data files for many projects.
| Data | Data Format | Data Source |
|---|---|---|
| Toponyms for Okanagan Region | Vector Points | Geogratis Layer: Dissemination Blocks - Cartographic Boundary File (DB-CBF), 2011 Census / Producer: Natural Resources Canada |
| Transportation Network | Vector Polyline | Geogratis Layer: Minor Water Regions (MNWTR) / Producer: Natural Resources Canada |
| Hydrography | Vector Polygon | Geogratis Layer: Parks and Recreation - Region / Producer: Natural Resources Canada |
| Digital Elevation Model (DEM) | Raster | Geogratis Layer: Canadian Digital Elevation Model Data / Producer: Natural Resources Canada |
| Okanagan Region Aspect Map | Raster | Created Data |
| DEM with Filled Sinks | Raster | Created Data |
| Catchment Area | Raster | Created Data |
| Topographic Wetness | Raster | Created Data |
Methods Conducted in SAGA GIS for Hydrological Analysis
SAGA GIS Basic Setup
Before you start setting up SAGA GIS for use it is recommended that you acquire the data which you plan to use for your project; be aware of where your data is located in a folder and make sure all of the data you are using is located in that folder.
Opening SAGA GIS
To run your hydrological analyses ensure that SAGA GIS is properly installed onto your computer and functional. If you do not have SAGA GIS you can download it at SAGA GIS homepage.
- If installed and functional, one simply has to locate and click the SAGA GIS icon
this will open the initial SAGA GIS window.
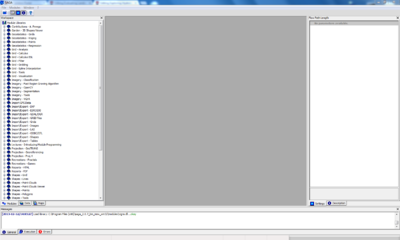
- Once SAGA GIS has been opened your user interface will be shown as below.
Figure 1. Screenshot of what the SAGA GIS graphical user interface looks like at start up

