Comparison of QGIS to ArcMap
Contents
Introduction
ESRI's ArcMap is a useful piece of software that can be used to create maps and perform various types of analysis. Unfortunately, it is an extremely expensive piece of software that not everyone can realistically afford; making it inaccessible.
As an alternative to ArcMap, many turn to Free Open Source Software (FOSS) in order to complete mapping and analysis. Through the use of FOSS, there are huge savings in costs and similar -- if not the same functions are still able to be used. There are many options for substitution of ArcMap to FOSS, all with varying effectiveness and suitability.
A few examples include:
For the purpose of this tutorial, QGIS will be the example used to compare directly to ESRI's ArcMap.
< ArcMap version 10.7 will be used >
<QGIS version 3.10 will be used>
(Please note: this tutorial will be running on the assumption that one or both of the software packages have already been downloaded prior to the tutorial. For information on how to download QGIS please visit QGIS.org. For information on how to purchase and download ArcMap please visit ESRI.com
Purpose
The purpose of this tutorial is to demonstrate how knowledge of ArcMap can be transferred to QGIS. This tutorial will compare vector based tools as well as raster based tools between ArcMap and QGIS.
Methods
For this tutorial, a comparison will be shown, with the ArcMap button/action on the left side and QGIS on the right, and will be displayed like so: ArcMap = QGIS
The data that was used for the tutorial example was sourced through Carleton University MacOdrum Library's Geospatial Database GIS @ MacOdrum Library -- specifically using data on Gatineau Park, QC. Below is a list of layers that were used for the tutorial.
 Layers included:
  -25m Contours of Gatineau Park
  -Gatineau Park Roads
  -Gatineau Park Streams
  -Gatineau Park Boundary
  -10m DEM of Gatineau Park
Adding Shapefiles
To add/upload data in ArcMap click on the 'Add Data' icon (Figure 1.) and add all the files from the methods section.
To add files in QGIS click on the 'Add vector data' icon (Figure 1.) and add all the files from the methods section.
Figure 1. Add Data Icon in ArcMap (left) and Add vector data/Add raster data in QGIS (right)
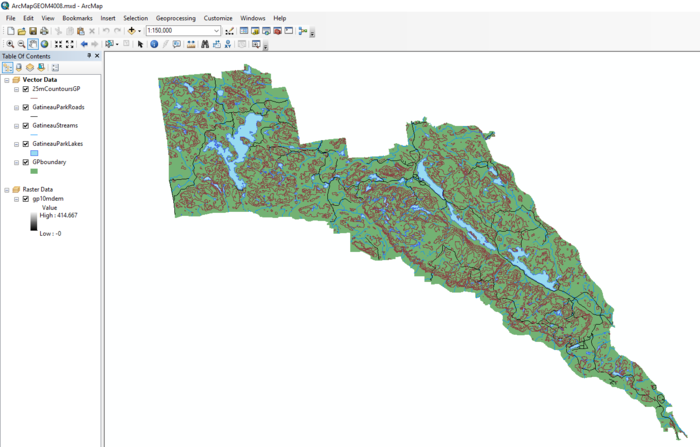
Figure 2. Data layers (provided in the methods section) visualized in ArcMap.
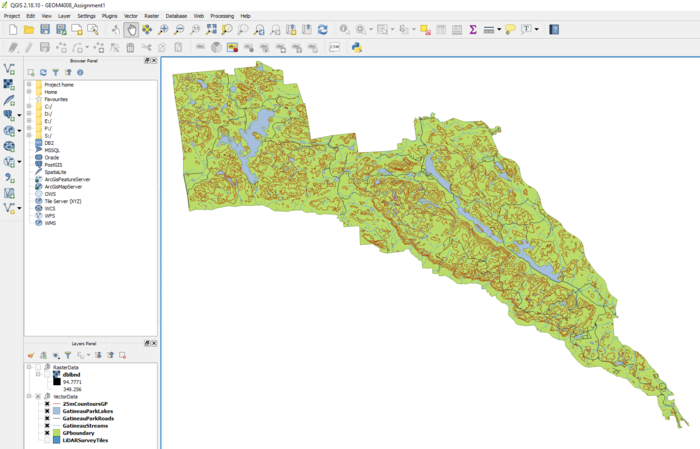
Figure 3. Data layers (provided in the methods section) visualized in QGIS.
Tools
The main concern when switching or opting for QGIS (or other FOSSs) over ArcMap is that the tool availability won't be the same, or comparable. And while QGIS doesn't have the same number of tools built into the program, there are many plugins and extensions that can be added that can run a variety of different processes.
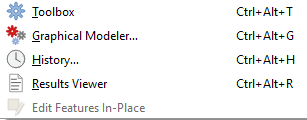
QGIS’ toolbox can be accessed by clicking processing then toolbox in the top menu bar. The toolbox will be located on the right side of the screen.
Figure 4. In QGIS showing the drop-down menu for where the toolbox is located.
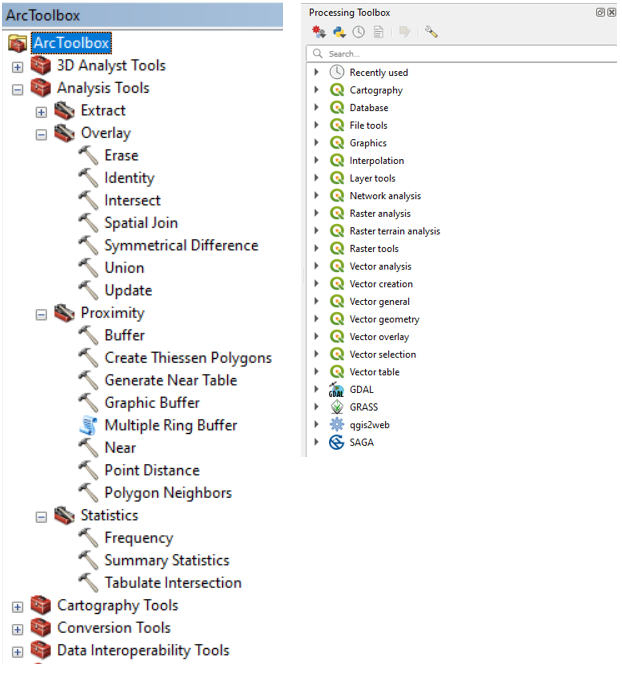
When clicking on the toolbox button, tools for various programs will popup with the number of tools that can be accessed. For QGIS, there are 79 tools that can be used.
Figure 5. Showing ArcMap toolbox (left) and the QGIS toolbox (right).
While ArcMap has more built-in tool availability, essential tools are included in QGIS with the opportunity to activate extra plugins and extensions.
Digitizing
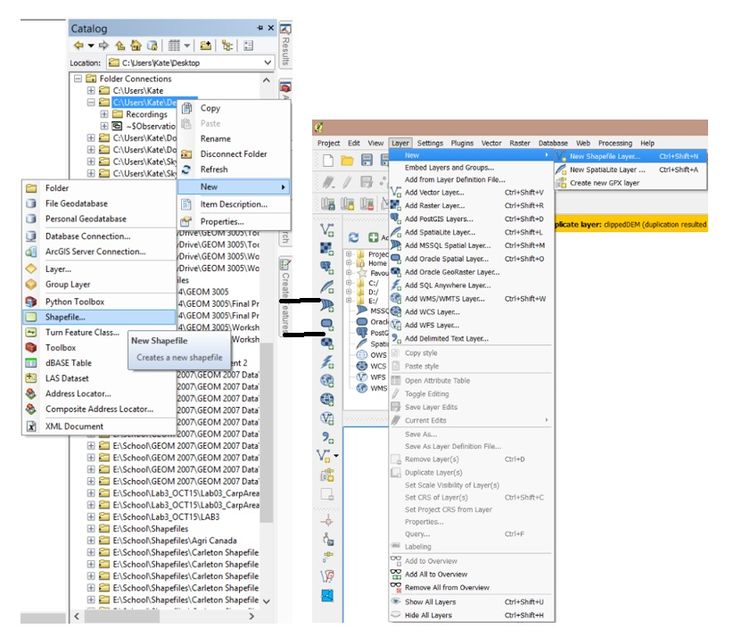
If you were looking into digitizing your own data in ArcMap or QGIS, below is a step by step guide on how to create new shape files.
Figure 6. Create a shapefile in ArcMap (left) through Arc Catalog feature. Create a shapefile using QGIS(right) by going to the 'Layers' dropdown menu > New > New Shapefile Layer
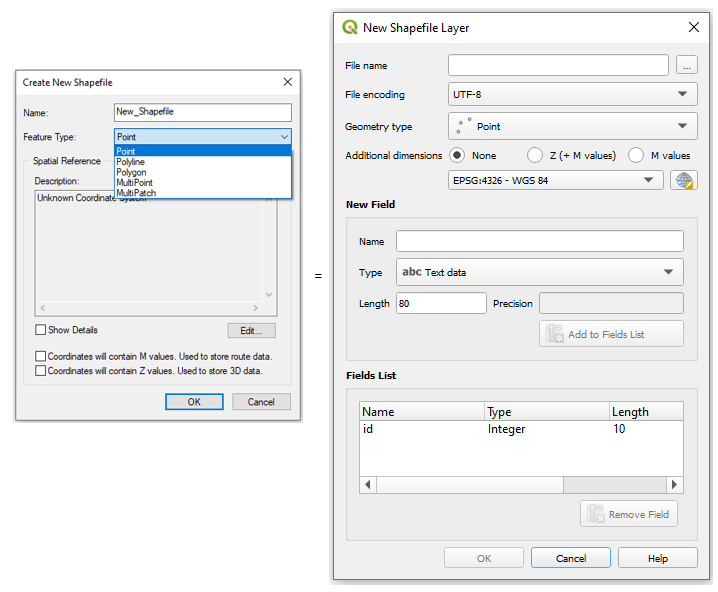
In both software, one location can create polygon, polyline and points, and a coordinate system is to be chosen.
Figure 7. Showing the control panel for creating a 'New Shapefile' in ArcMap (left) and a 'New Vector Layer' in QGIS (right)
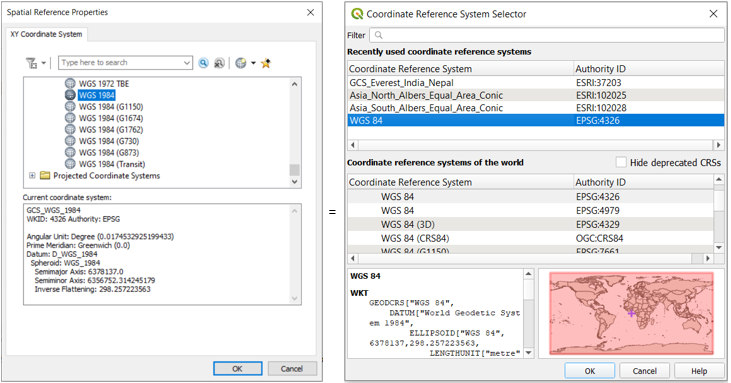
The next step is to set the coordinate system of your new layer.
Figure 8. ArcMap (left) categorizes the coordinate systems by projection and geographic, while QGIS(right) offers shows the user geographic location of projection .
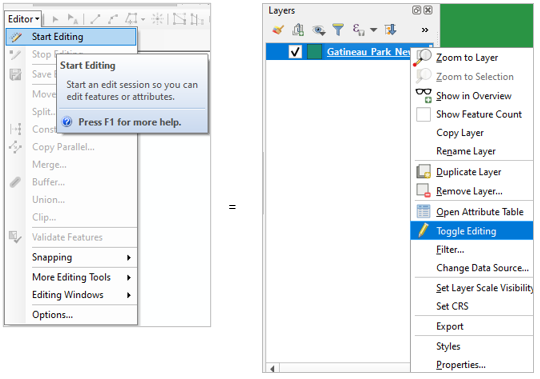
From there, the shapefiles have been created. Now, we can edit the shapefiles. In Arcmap, you are to go through the editor, while in QGIS, right clicking on the layer will bring up a drop down box, in which toggle editing is to be selected.
Figure 9. How to start editing in ArcMap (left) and in QGIS (right).
To begin digitizing, in ArcMap you are to create features, and then create the polygon/line/point. In QGIS, once right clicking and selecting toggle editing, select add feature: ![]() and the polygon/line/point can be digitized on screen. To do so, move your curser to the desired location and either trace, or create the shapes desired.
and the polygon/line/point can be digitized on screen. To do so, move your curser to the desired location and either trace, or create the shapes desired.
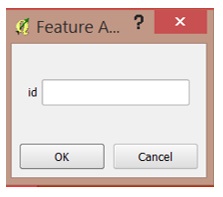
To complete the polygon, right click, and the following box will come up:
Figure 10. In QGIS, a prompt will come up, give your polygon its own Id number and the polygon will then be complete and on your screen.
Plugins
Plugins are developed by independent organizations and developers, QGIS plugins add free additional functionality and useful features to the QGIS application. Plugins are found under "plugins" on the main ribbon
Symbology
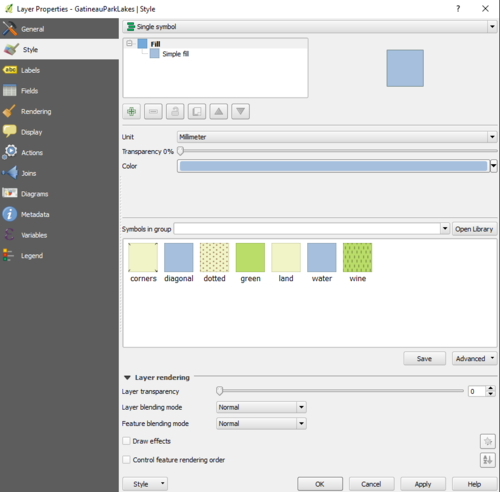
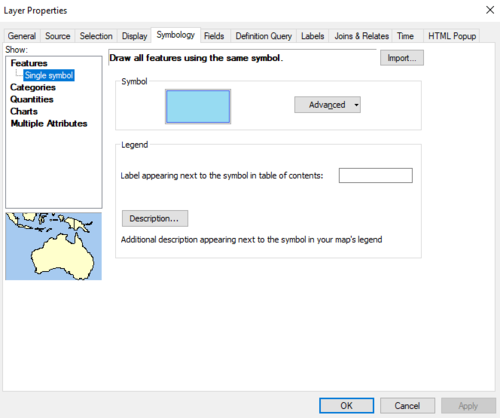
ArcMap and QGIS are two software programs that are able to produce high quality maps in terms of symbology that is available for use. The way each program approaches symbology; however, is different.
Figure 11. The symbology interface in QGIS.
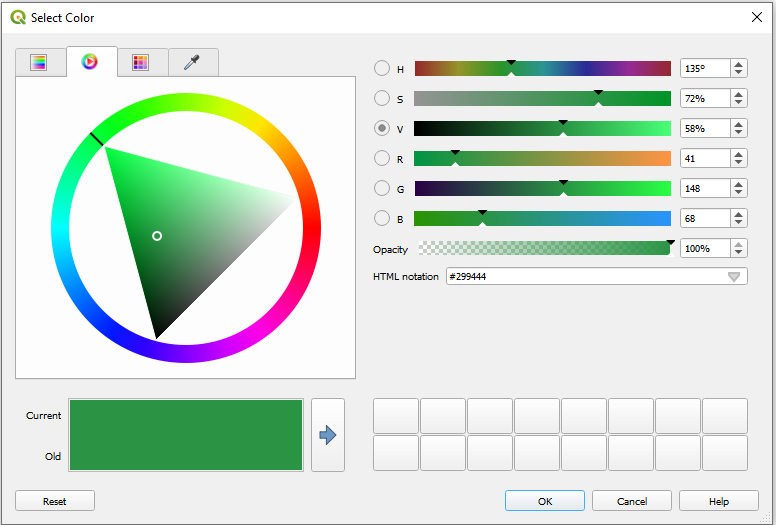
QGIS allows deeper colour customization for symbology using a colour wheel and colour gradient.
Figure 12. Colour Wheel In QGIS.
Figure 13. The symbology interface of ArcMap.
Both software programs have very similar capabilities for symbology possibilities and the tools surrounding symbology. The QGIS symbology interface can be more intuitive and user friendly - resembling to the likes of Photoshop; but ArcMap offers the very same features that are in QGIS, just presented in a different fashion.
Conclusion
Both software packages offer ample opportunity to create interesting and dynamic maps. While ArcMap is widely known and used as a standard in the field of GIS, it is important to consider other options -- particularly FOSS's like QGIS. Affordable mapping is possible, and hopefully this tutorial offered a basis of understanding to bridge the gap between the two software programs!
Happy Mapping!!!
