Data Extraction and Analysis Using Free and Available Software
Introduction and Purpose
The use and manipulation of raster data is an integral part of GIS, and can play an important role within urban planning. This tutorial will demonstrate how to extract and utilize available raster data for all areas where data may not already be available (eg: rural towns). This is particularly important if you are working on a project where the information has not yet been created, or you want to double check questionable data. The tutorial will demonstrate the capabilities of open source software, and the many possibilities from the perspective of a GIS contractor, who may not have access to expensive subscriptions such as ESRI software.
Software
The links and descriptions for the software used for this tutorial are as follows:
- QGIS
- Version 3.4.2 'Madeira'
- QGIS is a free and open source GIS. This means that is a powerful tool that allows for the manipulation and analysis of spatial data, and can be downloaded by everyone.
- Download available here.
- Ensure that version 3.4.3, 64bit is downloaded.
- Google Earth Pro
- Software by Google that allows geospatial data to be extracted and manipulated.
- Available for download here.
- Google Sheets or Microsoft Excel
- Both Google and Microsoft have excellent software for spreadsheets. While Google Sheets is free, the majority of people have access to Microsoft Excel, and as such was used for this tutorial. Instructions in this tutorial apply for both Sheets and Excel.
- 1. Google Sheets is available here. Google account is required (free), and there is no download necessary.
- 2. Microsoft Office is available here. Must be a student at Carleton University to qualify. If you do not have access this is not a problem, as Sheets functions very similarly.
- TCX Converter
- Free conversion software that allows for the rendering of altitude data from Google Earth data (.kml). This allows us to create a point cloud within QGIS.
- Download TCX converter here.
Getting Started
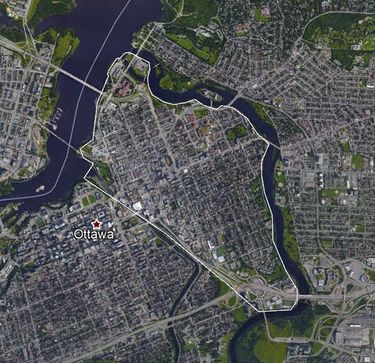
To begin, you must ensure that all software is downloaded and functional. Try running everything at least once before continuing. Once this is done, open up Google Earth Pro and locate Ottawa, or the area you would like to work with. The tutorial will be completed in the Lowertown/Sandy Hill neighbourhoods of Ottawa, found at the coordinates: 45°25'45.88"N, 75°41'7.40"W. This can be copied and pasted into the Google Earth search bar, and will put you between the two neighborhoods. Your extent should be similar to what is pictured below.
Once your study area has been located (again, it does not have to be the same as below) we will begin to use the tools within Google Earth Pro to create our study area. You'll want to navigate to Add Path in the Google Earth toolbar, pictured below.
At this point you will see the window for Add Path. You can provide a name to the layer, but this is not necessary. Begin to create a thatch pattern of points across the study area by holding down the left-mouse button, similar to what you see below. The closer you get the more precise the interpolation will be (to be completed at a later step). This step takes some time, but provides the necessary data for the creation of a raster layer in QGIS. When all your points have been laid out, navigate to Altitude, and ensure Clamped to Ground is selected. When this is done, hit Ok.


