An Introduction to Image Sharpening Tools in SAGA GIS
Purpose
The purpose of this tutorial is to introduce the concepts behind image sharpening of remotely sensed imagery and provide step-by step instructions for applying four methods using SAGA GIS software. In addition, this tutorial will aim to expand on the basic information and techniques presented.
This tutorial assumes the user has some basic understanding of the field of remote sensing, but with minor understanding of image processing.
Introduction
SAGA GIS
SAGA is free and open source GIS software, featuring an extensive suite of tools covering vector data, raster data (called Grid data within SAGA) and operations, imagery processing, vector processing as well as ecological and geomorphological simulations.
More information can be found at the SAGA homepage, and the latest version of the software can be downloaded from SourceForge. This tutorial uses SAGA v6.4.0.
To browse other CUOSG tutorials that have used SAGA GIS, click here
Remote Sensing Image Sharpening
What is image sharpening?
Image sharpening, also known as pan-sharpening and image fusion, is a method that has developed out of one of the balancing acts inherent to remotely sensed imagery: the trade-off between spectral resolution and spatial resolution.
Multispectral imagery sensors record detailed information in several spectral bands (red, green , blue, near-infrared, etc.), but at the cost of reduced spatial resolution. For example, the Landsat-series of satellites provide multispectral channels with a spatial resolution of 30 metres. In comparison, panchromatic imagery sensors record spectral information across a broader band (a wider range of wavelengths), allowing them to collect more spatial details (increased spatial resolution) at the cost of spectral information (e.g.: within the visible wavelengths, panchromatic imagery is greyscale, not colour). For example, the Orbview3 satellite collects panchromatic images at a 4 metre spatial resolution.
Image sharpening is designed to combine the best of both worlds: multispectral imagery with high spectral resolution (colour, near-infrared, etc.) but lower spatial resolution, and panchromatic imagery with low spectral resolution (greyscale) but higher spectral resolution, into one image with both high spectral and spatial resolution.
Applications
Image sharpening is especially beneficial where the spectral information is already useful or required and is benefitted by increased spatial information.
Remotely sensed images are commonly used as the basis for land classification studies, and image sharpening can often improve results. Since each pixel is an average of the surface features below it, reducing the amount of averaged data, especially where transitions occur, can lead to more accurate classifications.
Image sharpening can be valuable for archeological studies, where often both shape and colour can be important indicators for areas of interest. The combination of the best attributes of two different images can help identify sites and help by focusing effort at sites rather than searching for sites.
Considerations
Image sharpening techniques create a single result based on the combination of two images from different sources. In some cases, the two sources are fairly similar in origin, such as from two different sensors on the same satellite (e.g.: the Landsat-series), but more commonly, the two images come two different sources.
The most important consideration in image sharpening is the difference between the spatial resolution of the two images. The best results are usually obtained with high-resolution imagery that is no more than 4 times smaller than the multispectral imagery. For example, given 40m resolution multispectral data, the best resolution spatial data would be no smaller than 10m panchromatic data.
It is also best to use high-resolution imagery that is a whole fraction of the low-resolution image (ex: 20m and 5m, 9m and 3m, 2.4m and 0.6m, etc.), in order to reduce the change in spectral resolution due to resampling.
While spatial resolution is a critical component, there are other factors that must be taken into consideration, as often the images are taken at different view angles, under different atmospheric conditions, and are taken at different times, all of which can affect the final product.
Image Sharpening tools in SAGA
SAGA GIS has four built-in imagery sharpening tools that represent some of the most common methods used. These tools are:
- Colour normalized Brovey sharpening
- Colour normalized spectral sharpening
- IHS sharpening
- Principal Components-based sharpening
Explaining all the details of each technique is beyond the scope of this tutorial, however a brief overview of the theory behind the tools used in this tutorial is given below.
In general, image sharpening techniques use the high-resolution panchromatic image as being related to the intensity of the colour measured by the sensor; a brighter area in the panchromatic image likely reflects more of any given colour than a darker area. This works by resampling the low-resolution image to have the same cell-size as the high-resolution image, then multiply (or otherwise combine) the resampled colour layer by the panchromatic image brightness. Colour corrections and other normalization and standardization procedures can be applied, then the results are output.
Principal components (PC)-based image sharpening works quite differently, as it is an analytical black-box process. In short, each principal component (the result of the analysis) explains as much of the variance within a dataset as possible, with the majority of the variance explained by the first few components. In image sharpening, the assumption is that the first three components roughly correspond to some combination of red, green and blue, which is not often the case.
For more detailed information on how each tool operates, the papers listed in the tool information are a good pace to begin. For principal component sharpening, this tutorial on the basics of principal component analysis functions is recommended.
Methods
Acquiring Data
The data that will be used for this analysis come from the USGS open data portal, EarthExplorer. Datasets can be searched and viewed by anyone, but a free account is required to download.
The datasets are best searched by a combination of date range and place; here, the imagery used was taken over the Ottawa, Ontario region. These two datasets were selected because they were already in the same projected coordinate system, UTM18N.
The multispectral data set used is from Landsat-8 OLI/TIRS Level 1 imagery, taken on June 29th, 2018 (Path 16, Row 28), and has a spatial resolution of 30 metres.
The panchromatic dataset is from Orbview3 Level 1 GST imagery, taken on September 10th, 2004 and has a spatial resolution of 4 metres.
Importing images as grids
Once you have downloaded and extracted the files to a selected location, they are ready to be imported into SAGA.
Open SAGA GIS and start with an Empty startup project.
To import the images, go to “File >> Grid >> Load” and navigate to where you extracted your image.
For the Landsat scenes, we will only need three of the images provided: they will have filenames ending in _B2, _B3, and _B4, which correspond to the blue, green and red bands respectively. Hold the “Ctrl” key and select the three images, then click “Open”.
Repeat the process for the Orbview3 image; there should only be one to select this time.
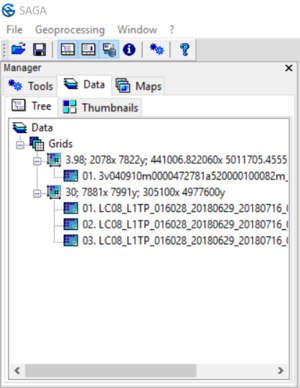
The “Data” tab of the Manager pane should look similar to the picture below. The grid system beginning in “3.98; …” is the Orbview3 panchromatic data, and the grid system beginning in “30; …” is the Landsat-8 multispectral data.
Note how no images have appeared in the right-hand pane. Before we add images to a map to view them, we will rename them in the SAGA UI to facilitate our tasks later on.
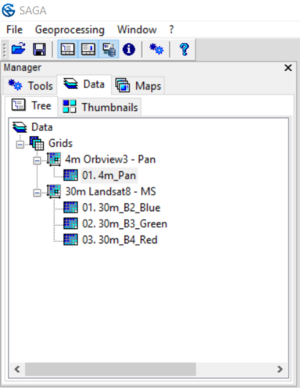
To do so, go to the “Window” tab on the menu bar at the top of the window, and make sure the “Show Object Properties” option is checked. Next, navigate to the “Data” tab in the Manager pane on the left-hand side. To rename the grid system, click on the grid system first, then click on the textbox to the right of the “Name” Entry, enter the name, and click “Apply”. The grids themselves can be renamed using the same method.
Rename the grids and grid systems to look like the following.
Now we can add our data to the map.
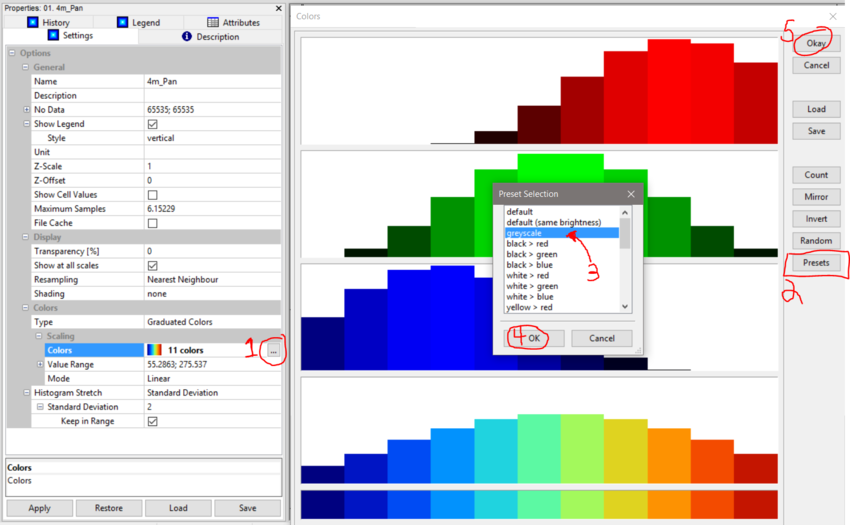
Begin by adding the panchromatic imagery by double clicking on the “01. 4m_Pan” grid. The default colour scheme assigned by SAGA is not what would be typically chosen to view a panchromatic image.
To change the colours, click on the label that says “11 colors” next to a little rainbow. Click on the 3 dots on the right to open up the “Colors” menu. In this new window, click on the “Presets” button, change to “greysclae” and click “OK” on the presets, then “Okay” in the “Colors” menu. Finally, press “Apply” in the bottom of the “Properties” pane.
You now have a greyscale image of Ottawa that you can explore.
Next we will add the Landsat-8 multispectral imagery, and view it as a true-colour RGB image.
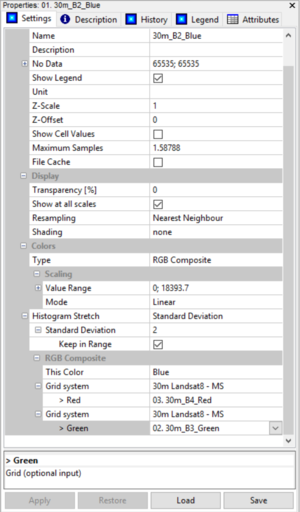
First, double click on the “01. 30m_B2_Blue” grid, and add it to the “01. 4m_Pan” map. It will again show up using the strange SAGA default colour. Second, click on the “Type” entry, which should say “Graduated Colors”. From the drop-down menu select “RGB Composite”; note how some of the option below have changed. Next we will select the band that make up our true-colour composite. Use the menus and match the bands to the colours until they look like the image below, then click “Apply” when finished.
To view, compare and explore the difference between the two images, go to the “Maps” tab in the Manager pane. Drag the “01. 03m_B2_Blue” layer below the “01. 4m_Pan” layer, so both layers are visible at once. To toggle a layer on or off, simply double click on the name of the grid.
Using the Image Sharpening tools
Now that we have imported both our images and inspected them visually, we can begin the analysis. The tools can be found under “Geoprocessing” tab at the top of the window, under “Geoprocessing >> Imagery >> Image Sharpening”.
The four tools all have very similar, straight-forward inputs with fields to enter the high resolution panchromatic grid (and grid system), and low-resolution multispectral grid system and grids.
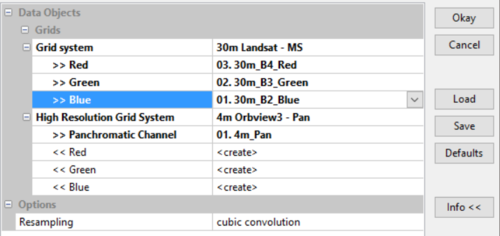
The Colour Normalized Brovey Sharpening and IHS Sharpening tools have the same inputs (see below); the first grid system and grid input is for the Landsat 30m grid system, the second grid system input is for the high-resolution grid system, and only the panchromatic grid needs to be entered as input as can be seen in the figure below, with fields filled in.
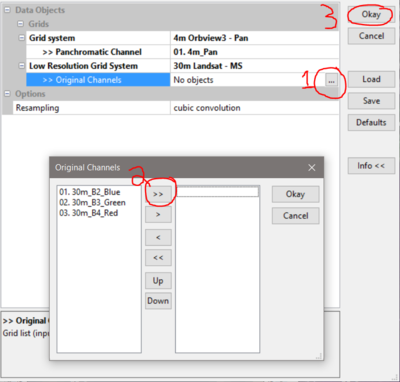
The other two tools have slightly different inputs (the Colour Normalized Spectral sharpening and Principal Components based sharpening): these two tools allow for the selection of additional bands above just the RGB. To add the channels, click on the field to the right of the “Original Channels” field, which will open up a new window. Next, click on the “>>” arrows button, the “Okay” to add all three grids as inputs. Finally click on “Okay” in the tool window to run the tool.
All four tools will output their results in the same way: the sharpened grids will be named the same as their inputs, however they will show up in the grid system of the high-resolution panchromatic channel (“4m Orbview3 - Pan” in this case).
To view the images in RGB colour, double click on one of the sharpened layers to add to a new map, then follow the procedure to create an RGB Composite as was described in the “Importing Images as Grids” section above.
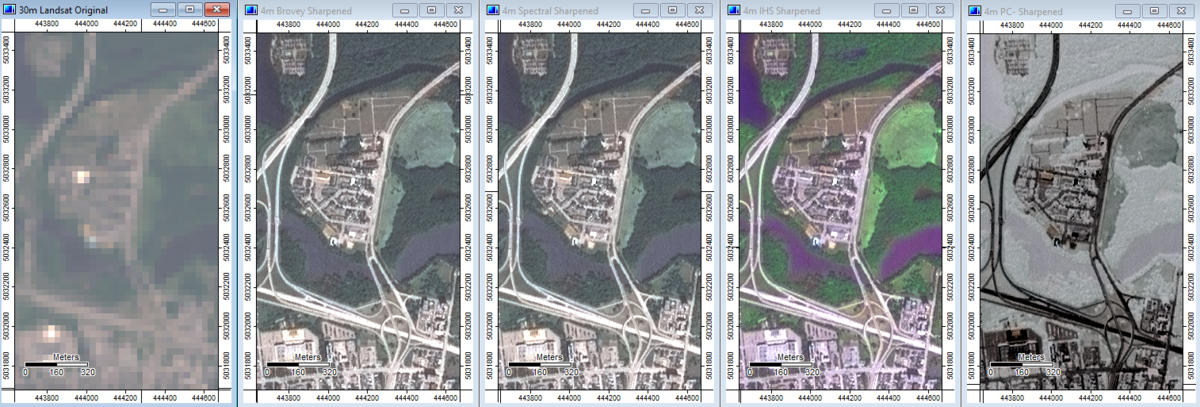
The image below shows a comparison of the four image sharpening methods over and area just north of Ottawa.
(From left to right: Original 30m Landsat-8 RGB image, 4m Brovey Sharpened image, 4m Spectral Sharpened image, 4m IHS Sharpened image, 4m PC-based Sharpened image.)
Comparing Image Sharpening Tools
As the figure above shows, not all of the tools gave the same result.
The Colour Normalized Brovey and Spectral Sharpening yielded similar results which best reflected the original data. The IHS sharpened data returned appropriate colours for different surfaces, but they were generally off in levels of intensity and brightness. The principal component-based sharpening fared the worst of all methods, as the three first components weren’t representative of colour.
The Brovey and Spectral sharpened data would best be suited to classification studies, as well as anything that required spectral information that is more true to life. In comparison, the exaggerated colours of the IHS sharpened data can be useful for visual analyses as a way of identifying anomalies or other interesting areas.
The choice of method used for image sharpening varies greatly based on the application and use of the results. In all cases, there will always be some mild modification of the original spectral information. Some applications require the most accurate spectral information possible; in others the relative spectral information and the added benefit of spatial information is more valuable. It thus falls to the user to best identify the data and methods for their application.
Conclusion
By the end of this tutorial, the hope is that the user has the knowledge to use image sharpening tools in SAGA GIS in addition to gaining some background knowledge in the world of remote sensing and image sharpening.
References
USGS Landsat Program Band Designations https://landsat.usgs.gov/what-are-band-designations-landsat-satellites
USGS EarthExplorer data portal https://earthexplorer.usgs.gov/
"Remote Sensing of the Environment: And Earth Science Perspective" Second Edition, by John R. Jensen (Pearson Prentice-Hall)
"A Tutorial on Principle Component Analysis" by Jonathan Shlens (2014) https://arxiv.org/abs/1404.1100
