Optimizing Ideal Locations to Implement Solar Panels in SAGA
Contents
General Context
The implementation of renewable energy sources for residential and commercial use has gained much interest over recent years. Although, many factors must be taken into account before moving on with such project, in this tutorial the focus will be towards establishing optimal locations to implement solar panels in Vancouver. An important aspect to take into account before installation is to measure the potential incoming solar radiation on rooftops. This can be done in SAGA GIS through the use of ‘Sky View Factor’ and ‘Potential Incoming Solar Radiation’ geoprocessing tools.
Explanation of used tools
The ‘Sky View Factor’ (SVF) tool computes the ratio between the radiation received/emitted by a surface and the theoretical total hemispheric radiating environment. Measured by a ratio of 0 to 1, pixels with higher SVFs signify that these surfaces emit more radiation and vice versa. The SVF output is a pre-requirement to be able to use the ‘Potential Incoming Solar Radiation’ tool.
The ‘Potential Incoming Solar Radiation’ tool computes the insolation, a measure of solar radiation energy received on a given surface in a given time. The settings for this tool allows adjusting according to location and time period. In this case, the insolation is measured over a period of a year, at every 5 hours of a day with a 5 day time step. The solar radiation is measured in kWh/m2 (kilowatt-hours per square meter), where irradiance below 900 kWh will be dismissed since it is considered to be too low for solar production.
Data
The first data source utilized for this project consists of a Vancouver Digital Surface Model (DSM) tile of 1m resolution that is projected at the UTM Zone 10N NAD83 (CSRS) coordinate system. It is provided by Natural Resources Canada (Government of Canada) and is part of their High Resolution Digital Elevation Model (HRDEM). The second data source is a building footprints shapefile provided by the City of Vancouver.
The DSM can be retrieved from this link
- Under 'Resources', click on the 'DSM derived data (download directory)' Access Link. In the directory, press on '1m/' -> 'VILLE_VANCOUVER/' -> 'VILLE_VANCOUVER/' -> 'utm10/' -> 'dsm_1m_utm10_w_1_145..>'.
The building footprints shapefile can be downloaded from this link
Vancouver building footprints shapefile
- At the end of the page, select 'Building footprints 2009 (SHP)'.
SAGA GIS
The following tutorial is completed through the latest version of SAGA GIS (7.40). This software is open source, meaning that it is free and accessible to the public.
SAGA GIS can be downloaded through this link: SAGA GIS (version 7.40)
- Press on the large green button "Download Latest Version saga-7.4.0.tar.gz (5.0 MB)"
Geoprocessing
Starting up SAGA GIS & Importing the data
- After opening up SAGA GIS, the first step is to import the DSM layer tile and the building footprints shapefile.
- DSM: File -> Grid -> Load -> Select all files (change file format to All Files) -> Folder where DSM is saved
- Shapefile: File -> Shapes -> Load -> Folder where shapefile is saved
Figure 1. DSM tile grid shown in map
Generating the Sky View Factor
- Geoprocessing -> Terrain Analysis -> Lighting -> Sky View Factor
- Input grids & options setting:
- Grid System: 1; 20000x 30000y; 480000.5x 5440000.5y
- Elevation: 'DSM' (grid dsm_1m_utm10_w_1_145)
- Visible Sky: <create>
- Sky View Factor: <create>
- Note this process can be quite long...
- Input grids & options setting:
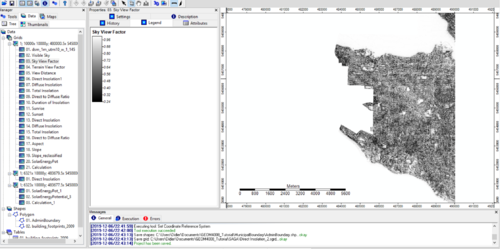
- Leave the remaining parameters to default. Once completed, two output grids will be created (Sky View Factor & Visible Sky). The 'Sky View Factor' will be required as an input for the following step.
Figure 2. Sky View Factor output grid shown in map
Generating the Potential Incoming Solar Radiation
- Geoprocessing -> Terrain Analysis -> Lighting -> Potential Incoming Solar Radiation
- Input grids & options setting:
- Grid System: 1; 20000x 30000y; 480000.5x 5440000.5y
- Elevation: 01. 'DSM' grid (dsm_1m_utm10_w_1_145)
- Sky View Factor: 'Sky View Factor' grid
- Direct Insolation: <create>
- Diffuse Insolation: <create>
- Shadow: slim
- Latitude: Degree: 49; Minute: 24; Second: 60
- Time Period: range of days
- Day: 04/01/2019
- Last Day: 04/12/2019
- Resolution [d]: 5 (days)
- Time Span [h]: 0; 24
- Minimum: 0
- Maximum: 24
- Resolution [h]: 0.5
- Note this process can take several hours
- Input grids & options setting:
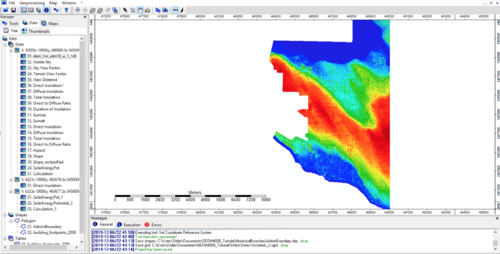
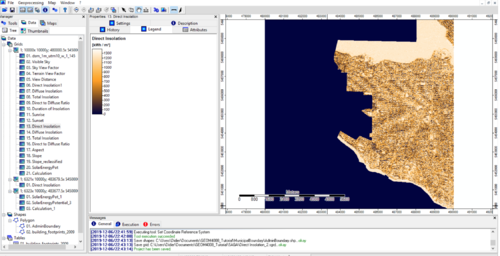
- Leave the remaining parameters as default. Once complete, two new grids will be generated (Direct Insolation & Diffuse Insolation). By viewing them on a map, the shape is the same as the initial DSM tile, although the pixels now represent either direct or diffuse insolation in kWh/m^2. Darker pixels show lower insolation values, while brighter ones show higher insolation values.
Figure 3. Direct insolation output grid shown in map
Clipping 'Direct Insolation' Grid with 'Building footprints' shapefile
- Geoprocessing -> Shapes -> Grid -> Spatial Extent -> Clip Grid with Polygon
- Input grids & options setting:
- Grid system: 1; 10000x; 10000y; 480000.5x 5450000.5y
- Input: 'Direct Insolation' grid
- Polygons: 'Building footprints' polygon
- Input grids & options setting:
- The resulting output will now show the direct insolation pixels over the building shape polygons.
Changing the 'Direct Insolation' grid properties
- Double-click on 'Direct Insolation' grid in the 'Manager (Data)' tab
- In the 'Properties' tab, go to 'Settings;
- Change 'No Data': Maximum to 899 (No Data range should be -99999; 899)
- Change 'Value Range': 900; 1388.98
- In the 'Properties' tab, go to 'Settings;
- This step is based on the fact that irradiance below 900 kWh should be dismissed since values smaller than this are considered to be too low for solar production(1). By doing so, values below 900 are considered as 'No-Data' and the new value range is from 900 to the maximum value.
Figure 4. Clipped direct insolation output grid shown in map (with insolation values equal or above 900 kWh)
Change the spatial reference of the newly clipped direct insolation grid
- This new grid does not have a spatial reference, which is why it must be defined before moving on to the next step.
- Copy projection from original 'Direct Insolation' grid, in 'Properties' tab (Description)
- Geoprocessing -> Projection -> Set Coordinate Reference System
- Proj4 Parameters: Paste the copied projection parameters in square brackets (example: [+proj=utm +zone=10 +ellps=GRS80 +towgs84=0.0.0.0.0.0.0 +units=m +no_defs ]
- Doing so will ensure that this grid has the same spatial coordinates as the previous grids, but most importantly, a base map can now be added underneath.
Finalizing the map
- The previously created clipped grid shows direct insolation values on building outlines. The background remains empty since no-data values were created, which is why a base map can be used to fill the void.
- Map -> Add Base Map
- Server: Open Street Map
- Transparency (%): 35
- Gray Scale Image: Check
- Map -> Add Base Map
Results
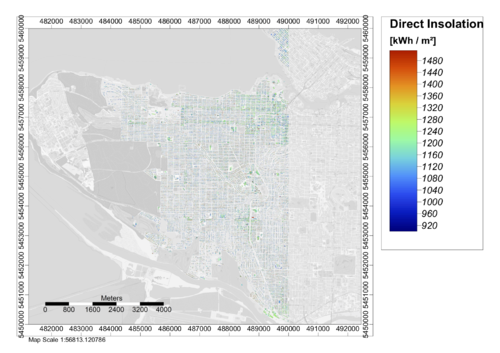
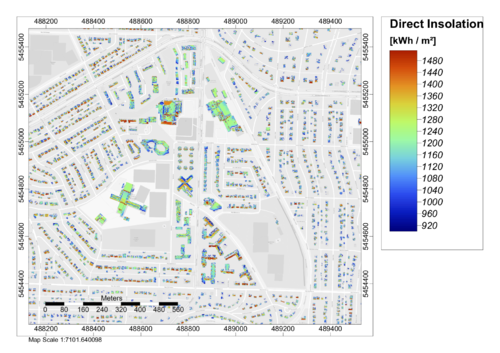
Final maps showing direct insolation (above 900 kWh) on Vancouver's buildings. As displayed, insolation varies between every pixel, representing that each building's roof tends to receive a different amount of exposure to light. Various factors can influence direct insolation such as building orientation, height, roof structure and slope, shading, etc. Areas coloured with warmer colours (yellow, orange, red) receive more direct insolation (~>1300 kWh), meaning that these locations would be optimal to install solar panels.
