Path Analysis with Vector Data Using QGIS
Contents
Introduction
QGIS is an application that is used for GIS (Geographic Information Systems) purposes that is Free and Open Source Software (FOSS). This software is user friendly. It runs on Linux, Unix, Windows, Mac OSX and Android. QGIS supports a variety of raster, vector and database formats and functions. It provides a continuous growing number of capabilities. It is provided by core functions and plugins. With QGIS, the user can manage, edit, conduct data analysis, visualize and create maps.
Figure 1. The latest release is QGIS 3.10.
This tutorial will guide the user through the process of downloading data, adding it to QGIS and conducting the analysis to find sections on a trail that connect to other path networks. In this tutorial, we will combine a variety of path networks and will find ways to access the main trail through these networks. The goal is to find ways to access the main trail from different areas within the city. This type of analysis can be used for any type of path analysis. We will use the Rideau Trail as the main path that we are analyzing. The other paths that we will be using to access the Rideau Trail are city roads, cycling routes, paths and parks. The data that is used here are all open sourced data.
Objective
We will be conducting an analysis of vector data. To access the main trail, we will need to find which lines intersect with the main trail. This process will allow us to find which paths or roads within Ottawa intersect with the main trail. These intersections will show how we can access the main path from different sections of the city.
The Rideau Trail is a hiking trail that links Ottawa to Kingston, it is 387 km long. The Rideau Trail Association maintains the trail so others can use it. They also provide information so others can use the trail. Once we have conducted our analysis, we will cross reference our information with maps provided by the Rideau Trail Association. The map keys will help us identify which maps we will need; to view the area in more detail.
Data
The type of data that we will be using are Keyhole Markup Language (KML) and shapefiles. We will be using vector data for this analysis. KML is a file format that is used to display geographic data. It is an international standard that is maintained by the Open Geospatial Consortium, Inc. (OGC).
Process
Please download the data from the references section before starting the project.
Open QGIS 3.10.
Figure 2. Open a new project and give it a name.
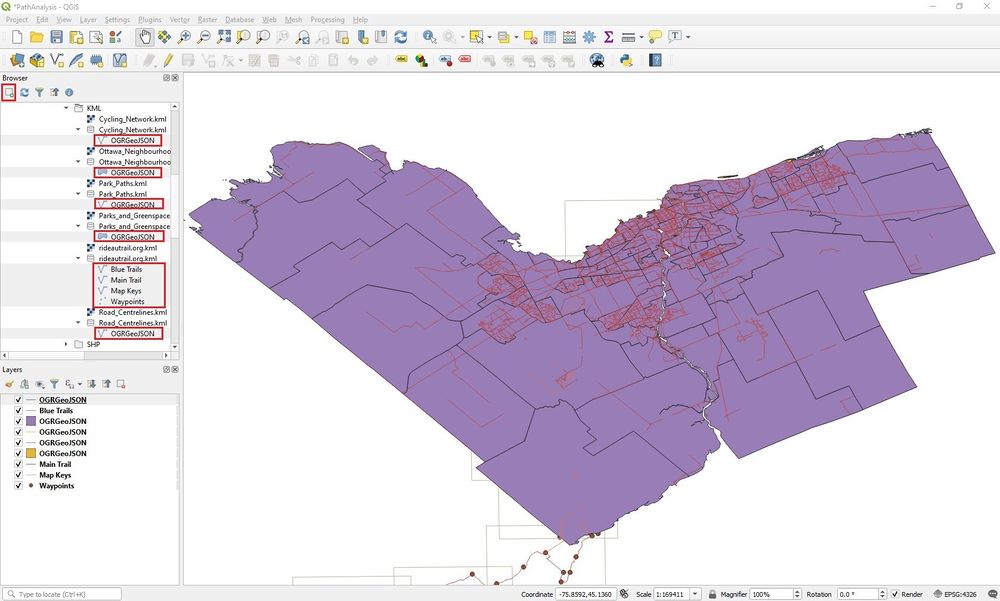
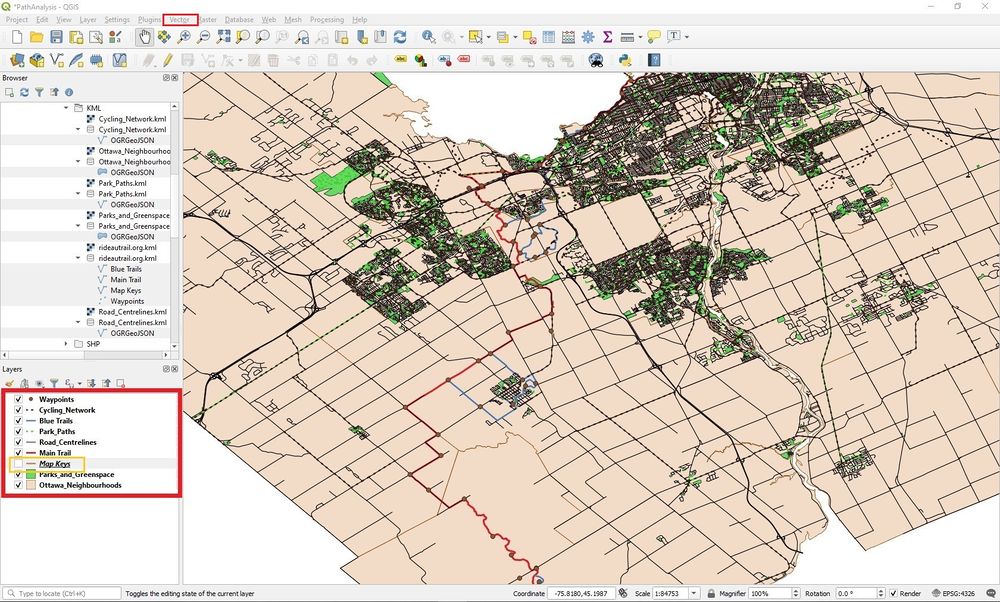
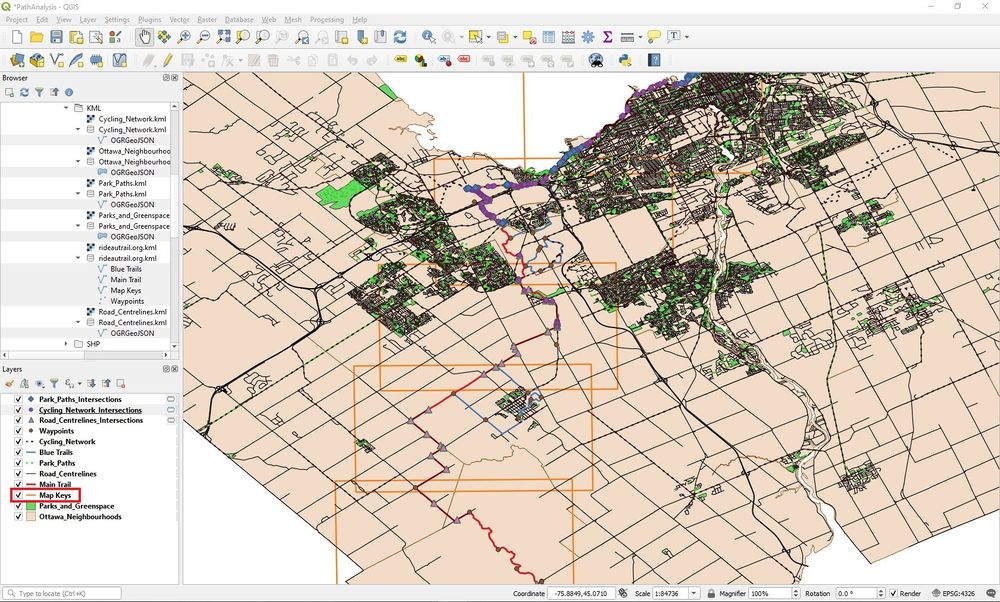
Add the data that will be used. It will be unorganized. You can turn off the map keys layer. It will be used for a later purpose, to cross-reference with other maps.
We will now conduct the path analysis of intersections to the main trail. Click the tab Vector/Analysis Tools/Line intersections...
Figure 3. Add the OGRGeoJson files to the map. GeoJSON supports a variety of geometry types, which includes Point, LineString, Polygon, MultiPoint, MultiLineString, and MultiPolygon. It is a format for encoding geographic data.
Figure 4. Once the data is added, it is recommended that you make changes to the layers, so it can be viewed more easily.
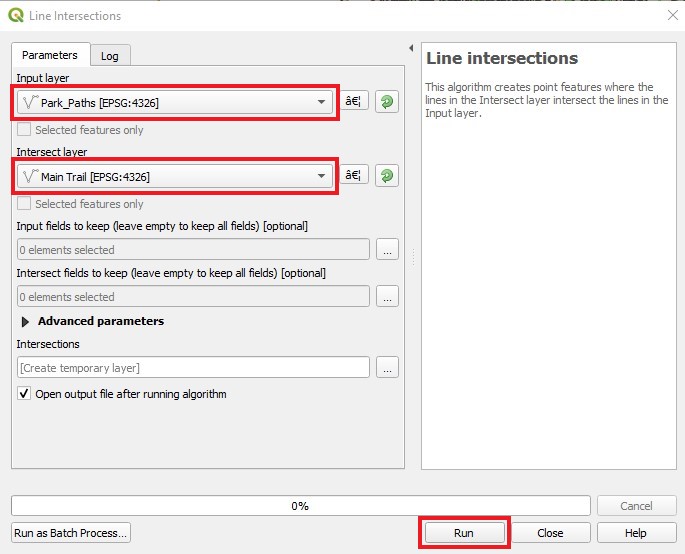
A window will open. Select the input layer accordingly. The intersect layer will be the main trail. This process will be repeated with the other line layers for the input layer. Click run.
Figure 5. Once you select run, the output will be displayed in the layers section, given that the input layer and intersect layer is selected accordingly.
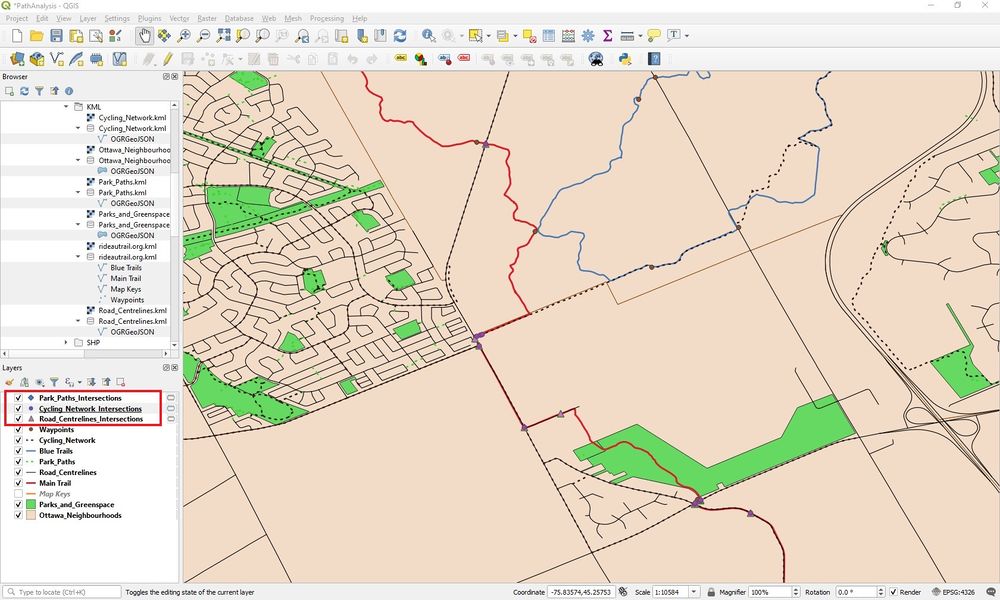
Once the multiple analyses are completed, change the symbols for easier viewing. you will now be able to see where various lines intersect with the main trail. The line intersections tool can be used to identify any paired combination of lines.
Figure 6. Results from using the line intersections tool.
Cross-Referencing With Other Maps
Please turn on the map keys layer and open the link Rideau Trail in the reference section. We will now cross-reference our information with maps provided by the Rideau Trail Association. Link to the maps are found in the reference section.
Figure 7. Map keys will be used for further viewing of the area.
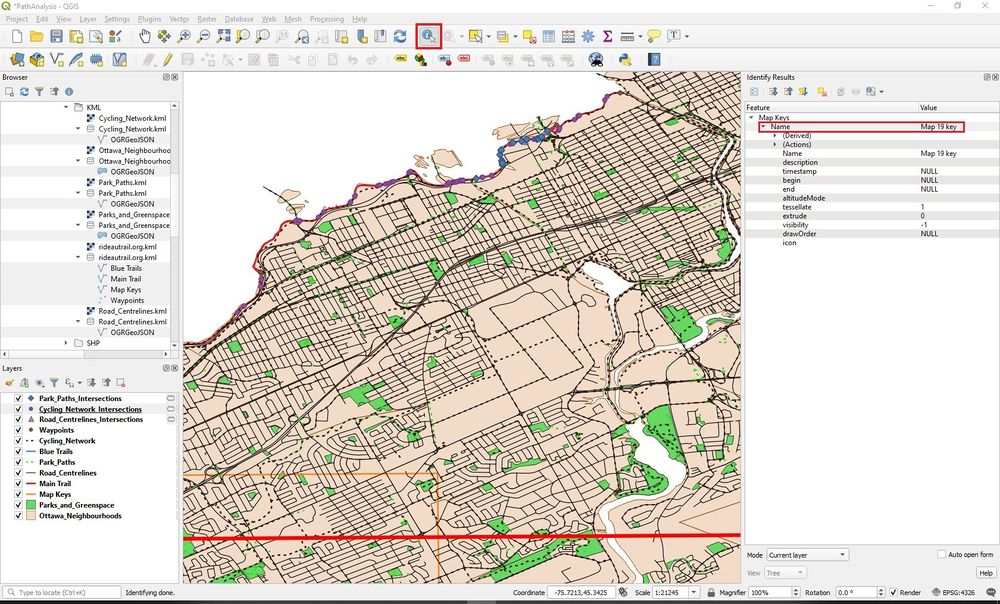
Select Identify Features. Go to an area of interest in which intersections have been identified. Select the map key on the map, it will identify the map key that will be required from the Rideau Trail Association website.
Figure 8. Identify the map key required the area of interest.
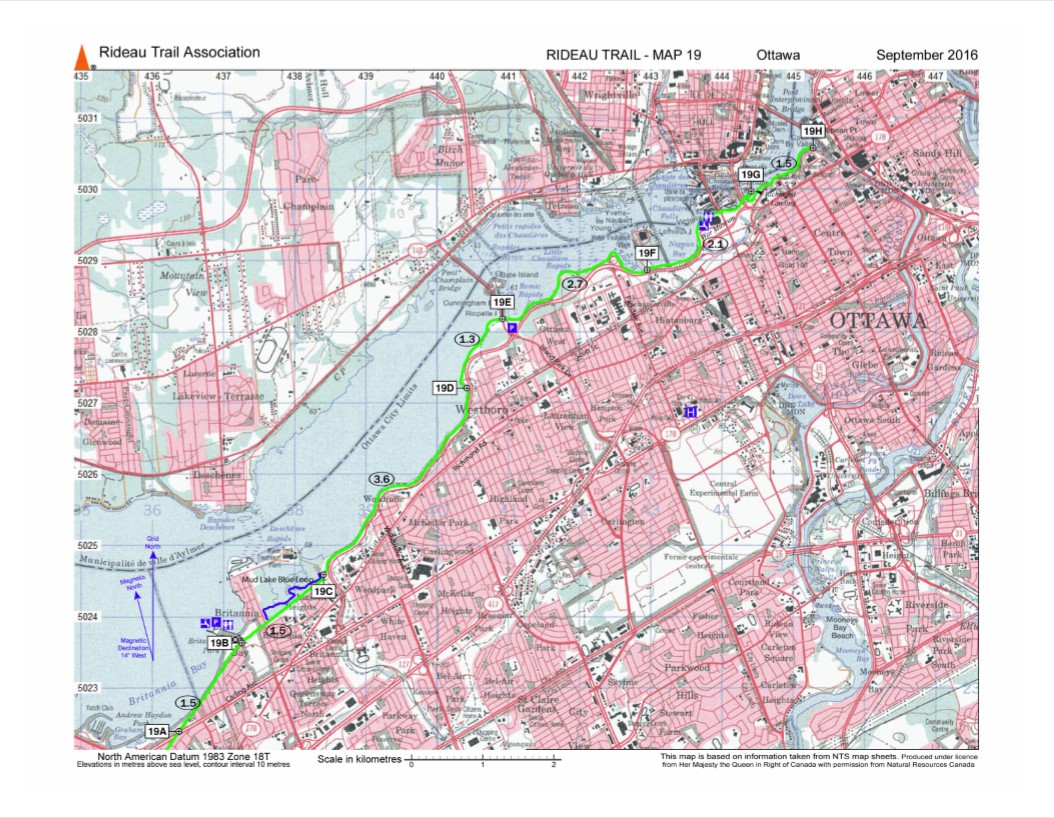
Select the required map from the Rideau Trail Association.
Figure 9. View the area in another type of map. It may provide more useful information for the area.
View in Google Earth Pro
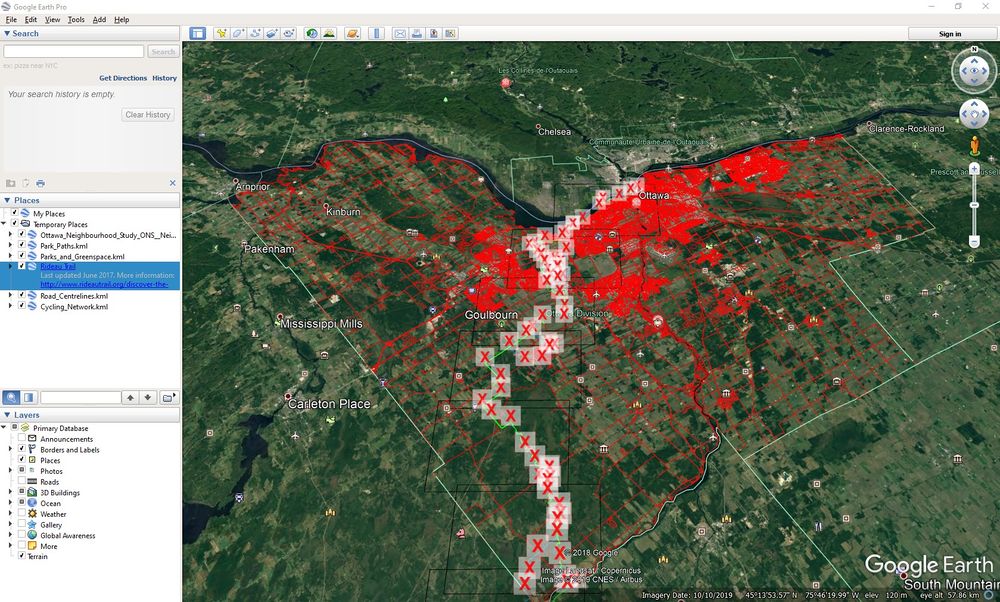
Since the data is KML, it can be viewed in Google Earth Pro.
Figure 10. The same data that was used in the previous analysis can be read in Google Earth Pro.
References
KML Data
Cycling Network: https://open.ottawa.ca/datasets/cycling-network
Park Paths: https://open.ottawa.ca/datasets/park-paths
Road_Centrelines: https://open.ottawa.ca/datasets/road-centrelines
Rideau Trail https://www.rideautrail.org/discover-the-trail/maps/
Shapefile of Ottawa
Ottawa Neighbourhood Study (ONS) - Neighbourhood Boundaries Gen 2: https://open.ottawa.ca/datasets/ottawa-neighbourhood-study-ons-neighbourhood-boundaries-gen-2
Google Developers. (2019). Keyhole Markup Language. Retrieved from https://developers.google.com/kml
GeoJson. (2019). GeoJson. Retrieved from https://geojson.org/


