A Web Mapping Tutorial for Beginners Using QGIS
Contents
Introduction
A decade ago the practice of GIS was centred on the Desktop GIS Model, where GIS software was installed on a computer and a GIS analyst worked with the software and data to make maps, develop reports and answer spatial questions. This paradigm is no longer, or unlikely to remain, the dominant mode of working with GIS. GIS based technologies and applications have gone mainstream and have therefore become simplified and specialized to specific end-user applications (e.g. direction routing in Google Maps). As such, the role of classical GIS analysts who “do GIS” is receding, and taking their place are end-users, developers, and perhaps, data scientists (Roberts & Robertson, 2016). Beginners in GIS typically aren’t web programmers and it presents a challenge when one needs to create a web map that is of the same quality as a map creating in a GIS. Fortunately, there are tools available to easily translate your work in QGIS to web maps. The QSGIS2Web plugin provides an easy way to distribute and visualize your QGIS work as a web map using, without you having to know, OpenLayers or LeafLet. In this tutorial, you will learn how to create an interactive web map that displays your geo-tagged pictures. No server-side software required.
Organize your data
First, we will see how to create a layer of points in Microsoft Excel containing geographic coordinates and links to "geotagged" photos.
Collect your images
Take 20-30 pictures using a digital camera, a tablet or a cellphone. Save them as .JPEG or .JPG. Copy your images into a directory. For example, with the Windows Photo Viewer, make sure the photos are oriented correctly and that they are size accordingly to your needs.
Create the attribute table
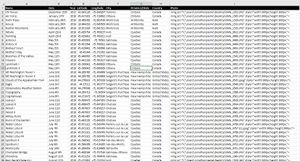
To import this data to QGIS, you will have to save it as a text file or a CSV file. Then, you will need at least 2 columns which contain the X and Y coordinates and a third one that contains the location of your images. We will call this third column Photos. As you will link the images to the created layer, it is therefore essential that the images are stored in a directory that you have administrative rights to if you want that your images are viewed directly with QGIS. Get the location of a picture by firstly opening Windows Explorer and finding the photo in question. Then, hold down the Shift key, then right-click the photo. In the context menu that appears, find and click Copy as path. This copies the file location to the clipboard. Fill in the Photo attribute for each feature by pasting the file path in its respective cell.
We will use the HTML images syntax to link our pictures in the attribute table.
In HTML, images are defined with the <img> tag.
The <img> tag is empty, it contains attributes only, and does not have a closing tag.
The src attribute specifies the URL (web address) of the image:
Example:
<img src="url">
The alt Attribute
The alt attribute provides an alternate text for an image, if the user for some reason cannot view it (because of slow connection, an error in the src attribute, or if the user uses a screen reader).
The value of the alt attribute should describe the image:
Example:
<img src="Your Image Path" alt="Image description">
If a browser cannot find an image, it will display the value of the alt attribute:
Image Size - Width and Height
You can use the style attribute to specify the width and height of an image.
Example:
<img src="Your Image Path" alt="Image Description" style="width:500px;height:600px;">
Alternatively, you can use the width and height attributes:
Example
<img src="Your Image Path" alt="Image Description" width="500" height="600">
The width and height attributes always define the width and height of the image in pixels.
Note: Always specify the width and height of an image. If width and height are not specified, the page might flicker while the image loads.======Image
Trouble Shooting Image Code
In the case that your image does not show you may have to correct your code. It is very important to make sure all spaces are in the proper location and all proper quotations are used. You may also need to change your photo folders name or photo name to ones without any spaces as this may be the reason your image will not show in your final map.
If this still does not correct your issue you can try pasting you image path into your browser with out any double quotes ("). If the image shows you will know that the image path is not the issue but else where in your code, as in incorrect format. If your photo does load you may also notice that the image path you pasted into your browser has been changed slightly. If it has, attempt using the changed path in place of the the image path you copied by holding shift and clicking on your photo.
Geo-tag your pictures
Geotagging consists of specifying the geographical coordinates of photographs by modifying their metadata. If you have a camera equiped with a GPS, geolocation data can be obtained automatically from the device. If you have an iPhone you can enable geolocation of photos (see how to activate it on this page[1])
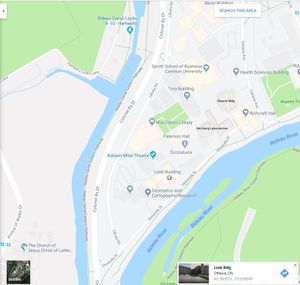
Or else, you can get GPS Coordinates from Google Maps.
- Open the Google Maps website in a computer browser.
- Go to a location for which you want the GPS coordinates.
- Right-click (control-click on a Mac) the location.
- Click What's here? ...
- Look at the bottom of the screen where you'll see the GPS coordinates.
Fill in the Latitude and Longitude columns for each feature. Once you have completed your spreadsheet, use Save As function in your program to save it as a Tab Delimited File or a Comma Separated Values (CSV) file. Once you have the data exported this way, you can open it in a text editor such as Notepad to view the contents. Examine your tabular data source.
Plot your points in your map
QGIS: Import Data
- Open QGIS. Click on Layers ‣ Add Delimited Text Layer.
- In the Create a Layer from a Delimited Text File dialog, click on Browse and specify the path to the text file you downloaded. In the File format section, if saved as a Tab Delimited File file select Custom delimiters and check Tab but if saved as Comma Separated Values (CSV) select CSV. The Geometry definition section will be auto-populated if it finds a suitable X and Y coordinate fields. In our case they are LONGITUDE and LATITUDE. You may change it if the import selects the wrong fields. Click OK.
Note: It is easy to confuse X and Y coordinates. Latitude specifies the north-south position of a point and hence it is a Y coordinate. Similarly Longitude specifies the east-west position of a point and it is a X coordinate.
- Next, a Coordinate Reference System Selector will ask you to select a coordinate reference system. Since the earthquake coordinates are in latitudes and longitudes, you should select WGS 84. Click OK.
OR If using QGIS 3.20 in the same window as previous step select WGS 84 in geometry CRS section instead.
- You will now see that the data will be imported and displayed in the QGIS canvas.
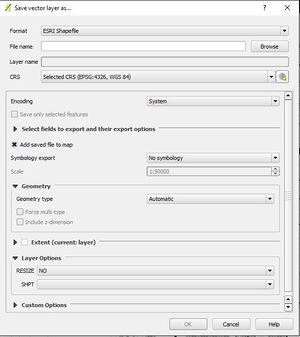
- you will need to save the layer as an ESRI Shapefile in order to be able to Edit the layer. To do this right click on the layer you just made and select export ‣ save feature as. In the Save Vector Layer As dialog select ESRI Shapefile for the format and name the file. Then check add saved file to map and select ok.
Edit widget
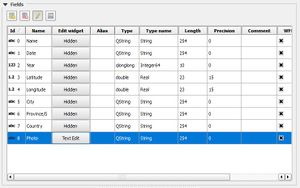
Creating new datasets can be a tedious task. To make things easier, QGIS enables users to customize the editing dialogue. Right click on the layer and select Properties -> Fields Tab, for every attribute feature there is a Edit Widget shown.
Hide the columns you don't want to appear in your popups by changing their Edit widget to Hidden. We will keep the attribute Photos and hide the others. If any of your fields contain image filenames, change their Edit widget to Text Edit to have the images appear in popups. This widget is an edit box that allow multiple input lines.
OR If using QGIS 3.20 right click on the layer and select Properties -> Attribute Form. Then under available widgets select the Fields and select the attribute feature you wish to change. Under Widget Type you can change the the columns you don't wish to appear to Hidden and to Text edit if you do wish for them to be in your popup.
Edit symbology
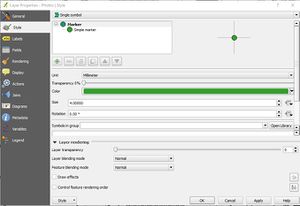
To change a layer’s symbology, open its Layer Properties. We will simply change the color of the Photos layer. Right-click on the layer you wish to edit in the Layers list. Select the menu item Properties in the menu that appears. In the Properties window: Select the Style OR in QGIS3.20 the Symbology tab at the extreme left. You can change the color, size and symbol as you wish. QGIS supports many types of symbology: Single symbol, Categorized, Graduated, 2.5D, More complex 2.5D styles are also possible, such as categorized. For instance, you could make a heatmap or add another dataset that would improve the map.
Add base map
Often, when you’re putting your own data onto a web map, you’ll want to put it on top of an existing basemap to provide context to the data. Making your own basemap is super interesting and fun, but is outside of the scope of this tutorial. To make this easy, we’ll use some pre-made tiles provided by Stamen Design. Stamen Design is a San Francisco-based research lab/development lab/design firm who have done some amazing things with web mapping (Stamen Design, 2018).
Download plugin
Core plugins are already part of the standard QGIS installation. To use these, you just need to enable them.
- Open QGIS.
- Click on Plugins ‣ Manage and Install Plugins.... to open the Plugin Manager dialog.
- Even if this is your first time using QGIS, you will see a lot of plugins listed under the Installed tab. This is because they are Core Plugins and were installed during QGIS installation.
External plugins are available in the QGIS Plugins Repository and need to be installed by the users before using them. An easy way to browse and install these plugins is by using the Plugin Manager tool.
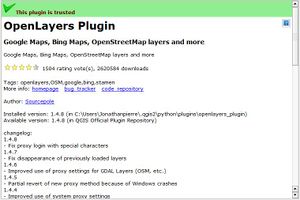
For this tutorial, you need to find and install a plugin called OpenLayers. As you start typing Open in the search box, you will see the search results below.
- Click on the OpenLayers and, click on Install plugin button to install it.
- Once the plugin is downloaded and installed, you will see a confirmation dialog.
- To add your basemap to the project Go to Web... OpenLayers plugin and select the basemap you wish to use for your map.
If this plugin is not available in the version of QGIS you are using find and install the plugin Quickmapservices
- Click on Quickmapservices and, click on install plugin to install it.
- Click on Web... Quickmapservices -> Settings. In settings select More Services and click get contributed pack. This will give you more basemap options.
- Still in the Settings menu under Visibility you will be able to select the groups you wish to see basemaps from. For this tutorial we are looking for stamen but feel free to explore the other options. Click save
- To add your basemap again go to Web... Quickmapservies -> Stamen and select the basemap you want to use.
Export map using QGIS2Web
Prepare your map as far as possible in QGIS, as you want it to appear in your webmap. If the map is ready, then it's time to build a web mapping application using qgis2web plugin.
Download plugin
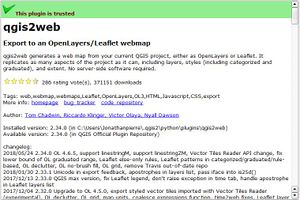
1. In the toolbar menu. Open Plugin > Manage and Install Plugins. 2. In the search toolbar, type QGIS2WEB. The plugin in will appear and then check it. Click Install Plugin at the right bottom of Plugins window.
How the plugin works
QGIS2WEB generates a web map from your current QGIS project, either as OpenLayers or Leaflet. It replicates as many aspects of the project as it can, including layers, styles (including categorized and graduated), and extent. The following section documents what can be done with each settings in the plugin window. You can play with them and don't forget to click Update Preview to see the result.
To use the plug in go to Web... qgis2web -> Create web map
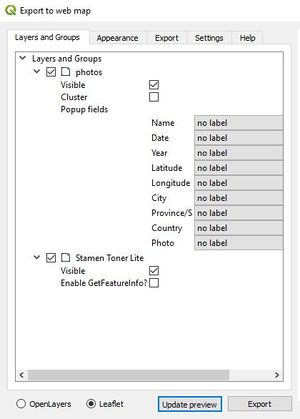
Overview of the layer options
It control how a layer will be displayed in the web map, including the pop up fields option. In this part we can also cluster a set points.
Popup fields Specify how each field will be labelled in popups
Visible
Select whether the layer will be visible on map load. This only determines visibility - the layer will be loaded regardless of this setting
Popups
This option may only be available on newer versions of this plug in. Make sure it is selected to make your popup photos visible once the map is complete.
Encode to JSON
If unchecked, WFS layers will remain remote WFS layers in the webmap. If checked, the layer will be written to a local GeoJSON file
Cluster Cluster point features
Overview of the general options
Data export
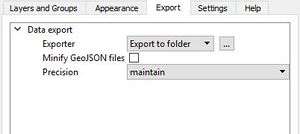
This part gives some options for exporting the map into a web map, such as: Location of exported web map files, mapping library location, minify GeoJSON file, etc. Export folder The folder where the webmap will be saved
Mapping library location Select whether to use a local copy of OL3/Leaflet, or whether to call the library from its CDN
Minify GeoJSON files Remove unnecessary whitespace from exported GeoJSON to reduce file size
Precision Simplify geometry to reduce file size
Appearance
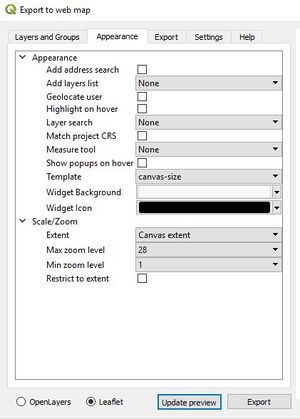
In this section we can add some tools to the web map such as: address searching, layer list, measure tool, pop up, user geolocation. Moreover we can set the extent of the web map in this part.
Add address search Add field to allow searching for locations (geocode)
Add layers list Include list of layers (with legend icons, where possible)
Add measure tool Include interactive measuring widget
Geolocate user Show user's location on map
Highlight on hover Highlight features on mouseover
Layer search Add option to search for values in layer field values
Match project CRS Create webmap in same projection as QGIS project, otherwise the webmap is projected in EPSG:3857
Show popups on hover Show popups when mouse hovers over features
Template Select HTML template for webmap - add your own templates to the /qgis2web/templates directory in your .qgis2 folder
Scale/Zoom
This section control the map extent including zoom setting.
Extent
Either match the current QGIS view or show all contents of all layers (only local GeoJSON and rasters, not WFS/WMS)
Max zoom level How far the webmap will zoom in
Min zoom level How far the webmap will zoom out
Restrict to extent Prevent panning or zooming beyond the selected extent
Exporting
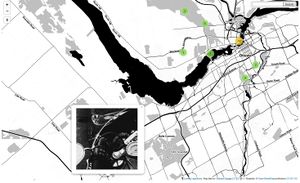
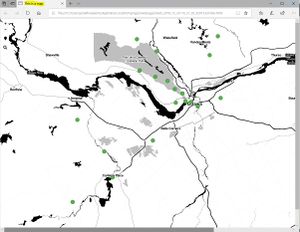
When you have made a choice of layers and symbology, and configured the settings and appearance as to your preferences, click Update Preview button one last time to see the results. If you are satisfied of your map and you confirmed the output folder, click Export. Once the export is complete, your browser will open directly and display your web map.
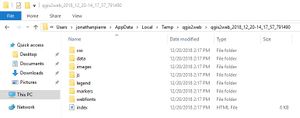
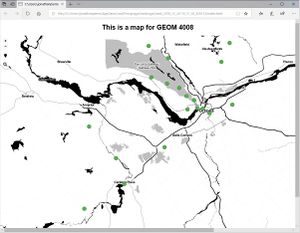
To highlight the fact that the output created from this process can be readily changed to suit your requirement, we will make a simple change to the web map to add a title. On your computer, go to the folder where the web map was exported.
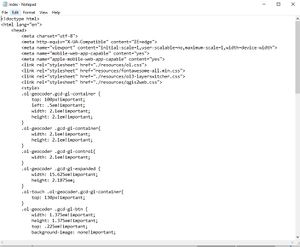
Open the index.html which contains the html code for your map. It would be preferable to open the file with an integrated development environment such as Spyder or Eclipse which have source code editing capabilities. However, if you do not have access to those softwares, Notepad will do the job for what want to do right now.
If you edit the index.html file that QGIS2WEB produces you'll see the title tags in the head section of the file. You will have to scroll down a little bit in order to find it. Read carefully.
Once you find the tags, insert your title between the tags. It should look like this: <title>This is an web map</title>
If you want a title on the map itself then you need to add some text in the body section of index.html
Summary
In this tutorial, you have learned how to use the QGIS2Web plugin to create a web map using OpenLayers or Leaflet libraries from your QGIS project. QGIS2Web is a QGIS Desktop plugin. This plugin allows you to export your local QGIS project to a classic HTML server. No special software is needed on the server. The map element will be LeafLet or OpenLayers code, optionally, contained in an HTML page. Your data will be included in a GeoJson data file. Just copy on your server the html page and the Json file to publish your map online. The big advantage is having nothing to do on the server side. The second is that this solution is an easy first step into the web mapping world. Indeed, the generation of OpenLayers or LeafLet code can serve as a basis for developing pages with much richer features. This tutorial is also an introduction to the benefits of Web GIS which will hopefully raise the awareness of the free online mapping options available to the user community.

