Mapping The Carleton University Campus With “Grass GIS”
Contents
Introduction
The aim of this tutorial is to show how to use some tools of the “Grass GIS” software to create thematic maps. More specifically, this tutorial will demonstrate how to add, manipulate, in short, use relevant spatial data to create thematic maps of the Carleton University campus. Finally, this tutorial is a basic introduction to thematic mapping using the vector analysis capabilities of the Grass GI software. Instead, the emphasis will be on the digitization of spatial data and the use of symbols to produce high-quality maps.
Software
Geographic Resources Analysis Support System, commonly called GRASS GIS, is a geographic information system (GIS) software suite used for geospatial data management and analysis, image processing, producing graphics and maps, spatial modelling, and visualizing. GRASS GIS is licensed and released as free and open-source software under the GNU General Public License (GPL). It runs on multiple operating systems, including Linux, Mac and Windows. Users can interface with the software features through a graphical user interface (GUI) or by plugging into GRASS via other software such as QGIS. The latest version of this software “GRASS GIS 7.6” is used in this tutorial.
Data
The scope of this tutorial and especially the availability of data were crucial in the identification/choice of data sources used for this tutorial. The Carleton University MacOdrum Library was primarily the source of the data used. The datasets included the thematic data of the Carleton University campus available on the Carleton University Library website (https://library.carleton.ca/find/gis/base-layers). In this tutorial, the shapefiles used from these datasets include roads, buildings and tunnels, railways, Carleton boundary, Train and bus stations, Rideau river, Rideau canal.
Download Data
Prior to the tutorial, the most recent GRASS GIS software (GRASS GIS 7.6) should be downloaded on the computer. GRASS GIS can be downloaded at the Grass GIS download page. Datasets were downloaded form the Carleton MacOdrum Library (https://library.carleton.ca/find/gis/base-layers).
Selection Grass GIS Database Directory and Location
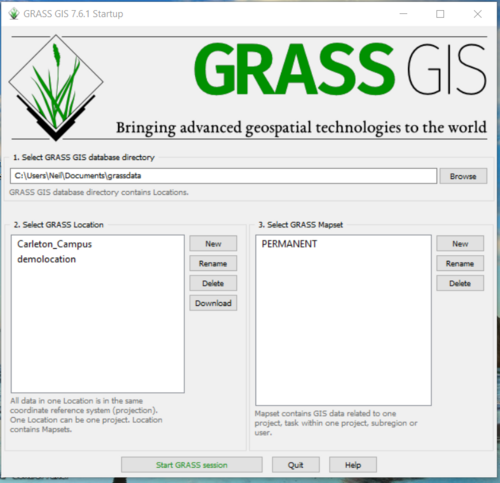
The first step, if you've never used GRASS before or no longer have other GRASS datasets is to set up a new folder that will be the directory storing all your GRASS databases. In that directory, other folders will be added for each study area, or "location" as GRASS terms them. It is recommended that the name of the location folder be linked to the project. Select PERMAMENT as the default mapset.
Figure 1: GRASS GIS start page – Selection of directory, location and mapset.
Projection Setting
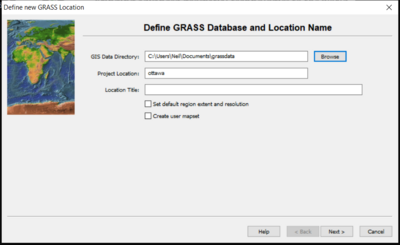
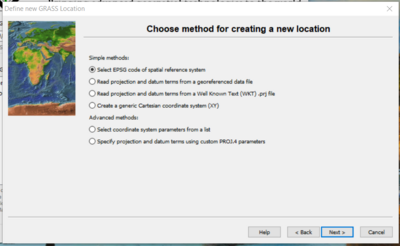
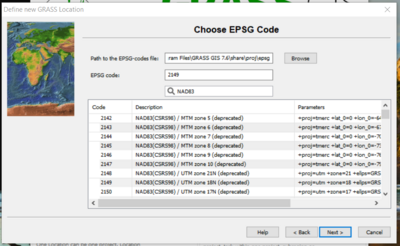
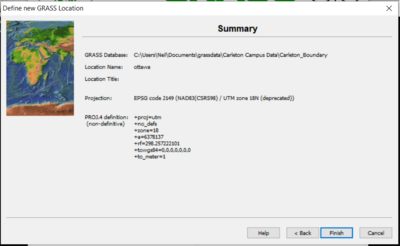
To display the data correctly, each data frame uses a coordinate system which should be first specified. Thus, it will determine the map projection for the map display in the data. Refer to Figure 1 and click on the “New” tab. Provide the project location which is Ottawa and click on Browser (Figure 2). Choose your folder and click on the next button. When Figure 3 pops out, select EPSG code of spatial reference system as the methods for creating a new location, and click next. Choose EPSG code 2149 and click next (Figure 4). The summary screen with the projection for the newly created location folder appears (Figure 5).
Figure 2: Define the Project Location Name
Figure 3: Methods for creating a new location
Figure 4: Choose EPSG Code
Figure 5: Projection for the newly created location folder
Adding Layers to Project
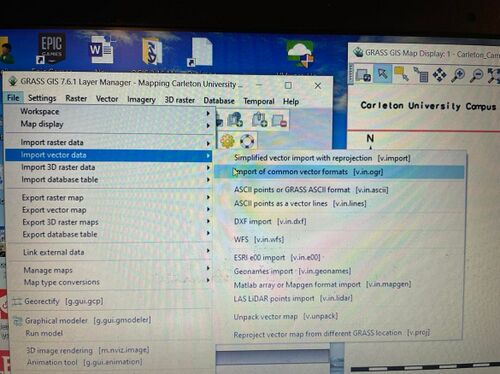
To add layers to the project, click first on the file tab and choose Import vector data. Then select Import of Common imports format (Figure 6).
Figure 6: Import vector data
The next step is to search for the layer’ shapefiles to be added to the project. Select the layer ’shapefile,
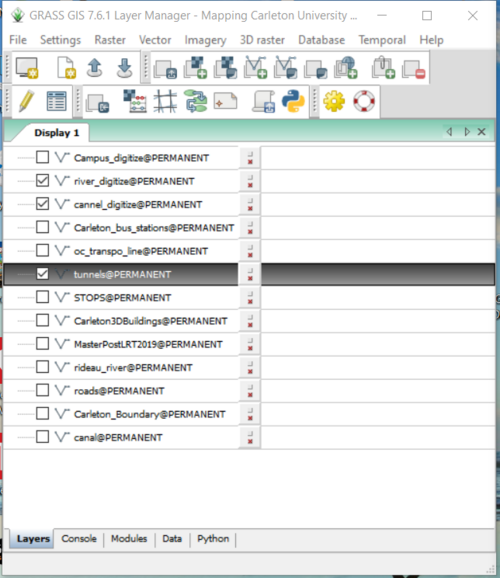
click on the run button. All selected layers will be listed as displayed on the Figure 7. You can now select
a layer to be added to the project.
Figure 7: Layers added to the project
Digitizing
Digitization is a process of converting raster data to vector layers. The following steps show how to proceed:
- On the layer management page (Figure 7), check the layer which raster data should be converted into vector layer.
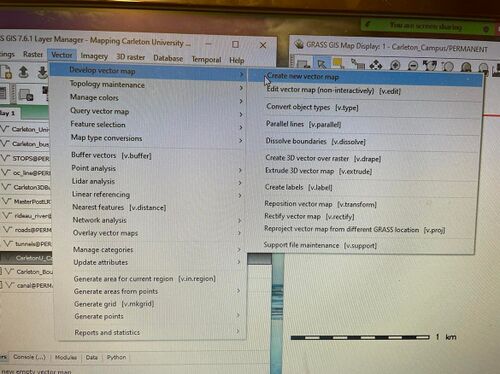
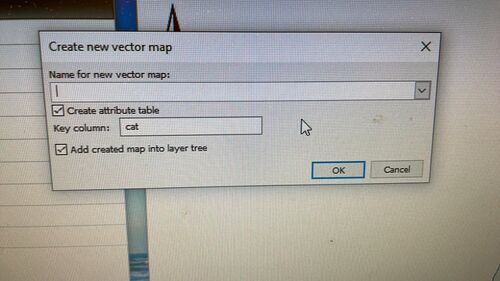
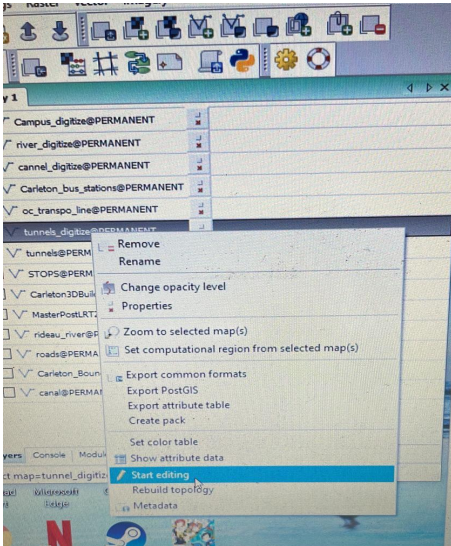
- Name the new created vector map and click on the OK button). Select the new created vector map, right click, and start editing (Figure 9).
- Depending on the shape, you can choose point, line, or polygon.
- Repeat these processes for all raster data. To leave the digitizing processes, click on the Quit button.
Figure 8a: Step to creating new vector map
Figure 8b: Creating new vector map
Figure 9: Selecting and editing a new created vector map
Creating the final Map
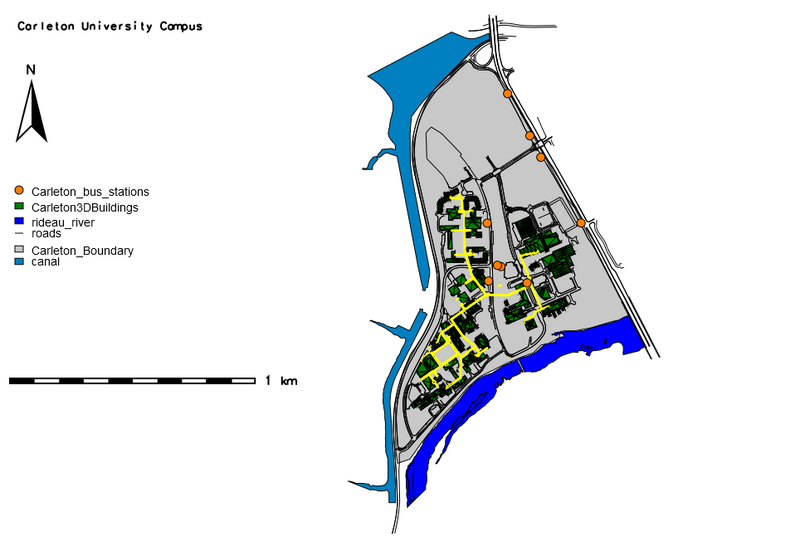
The final step is to add map features including the scale bar, the north arrow, the title of the map and the raster legend.
Figure 10: Carleton University Campus Map
Conclusion
GRASS GIS is an interesting software for creating maps. However, some software tools are sometimes very slow. This is what makes the software tend to crash. This experience shows that there is still development to be done to make the software more efficient. Hoping that this tutorial will guide in the use of some tools of the GRASS GIS software.
Resources
https://library.carleton.ca/find/gis/base-layers
