Mapping The Carleton University Campus With “Grass GIS”
Contents
Introduction
Welcome to this tutorial on mapping the Carleton University campus with “GRASS GIS”, a powerful computational engine for raster, vector, and geospatial processing. In this guide, we will explore how to leverage GRASS GIS to create a thematic map highlighting some features of the Carleton campus environment. Whether you’re a student, researcher, or simply interested in geographic analysis, this tutorial will provide step-by-step instructions to help you visualize a map. By the end, you’ll have the skills to create your maps and understand how you can manipulate layers to make descent maps on GRASS GIS. Let’s get started!
What Is GRASS GIS?
Geographic Resources Analysis Support System, commonly called GRASS GIS, is a geographic information system (GIS) software suite used for geospatial data management and analysis, image processing, producing graphics and maps, spatial modelling, and visualizing. GRASS GIS is licensed and released as free and open-source software under the GNU General Public License (GPL). It runs on multiple operating systems, including Linux, Mac and Windows. Users can interface with the software features through a graphical user interface (GUI) or by plugging into GRASS via other software such as QGIS.
Downloading GRASS GIS
To get started with GRASS GIS, you can easily download and install it from the official GRASS GIS website. Navigate to https://grass.osgeo.org/ and select the “Download” section. Here, you’ll find installation packages for various operating systems, including Windows, macOS, and Linux. For Windows users, the OSGeo4W installer is recommended, while macOS users can download a pre-built package. Linux users can often find GRASS GIS in their distribution’s package manager. Follow the installation instructions provided for your operating system, and once installed, you can launch GRASS GIS to begin exploring its powerful features. Here, in this tutorial, the latest version “GRASS GIS 8.4” is used.
Downloading Data
You can access the required data in two simple ways: The first is the MacOdrum Library (you may need a Carleton 360 account to access some layers). Go to https://library.carleton.ca/find/gis/base-layers and find the necessary data you need. The second is to obtain the layer package from OpenStreetMap Data Extracts (Geofabrik downloads). Go to https://download.geofabrik.de/ and choose your region to have the full package data of wherever you want (Be careful about data accuracy and precision in some cases!).
Running GRASS GIS
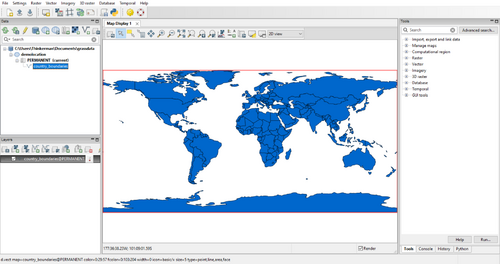
If you are running GRASS GIS for the first time, you will open a default project "world_latlog_wgs84" where you can find a map layer called "country_boundaries" showing a world map in the WGS84 coordinate system. The main component of the Data tab is the Data Catalog which shows the GRASS GIS hierarchical structure consisting of database, project, and mapset. For more info about data hierarchy, see https://grass.osgeo.org/grass84/manuals/grass_database.html
Fig 1. Default project world_latlog_wgs84
Primary Settings
Create a New Database
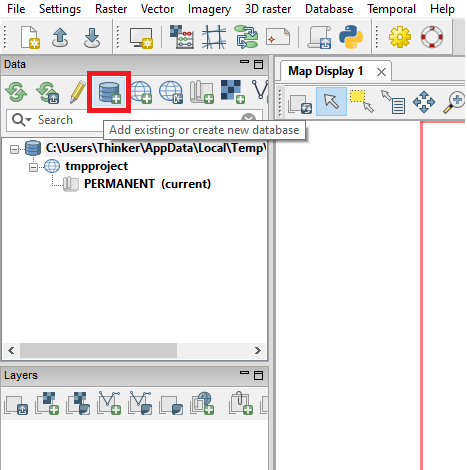
If you want to do the project in the desired direction, you must first create a new database. Otherwise, you can proceed in the default path where you installed Grass GIS. To create a new one, click on ![]() icon in the data panel.
icon in the data panel.
Fig 2. Create new database icon
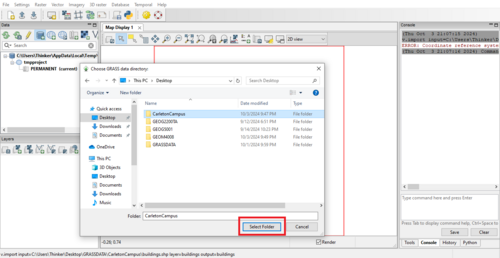
Fig 3. Define a path for database
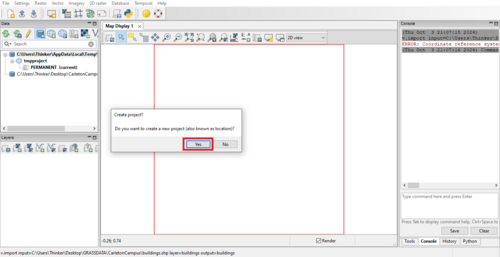
When you create a database for the first time, it is necessary to define projecting setting. Click on Yes, and follow the next steps.
Fig 4. Asking about if you want to create a new project
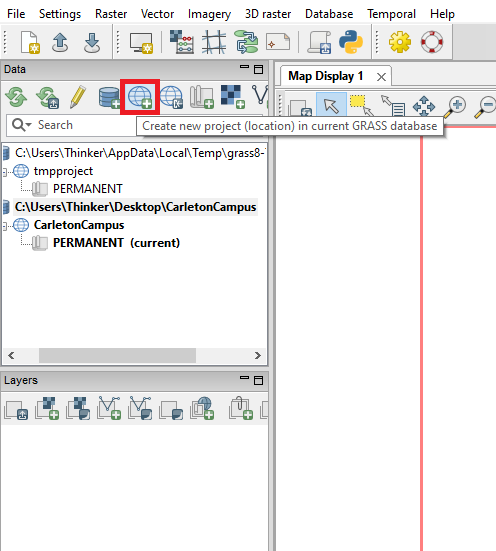
Note: If you mistakenly click on No, you can define projection by clicking on ![]() icon in the data panel.
icon in the data panel.
Fig 5. Creating new project
Projection Setting
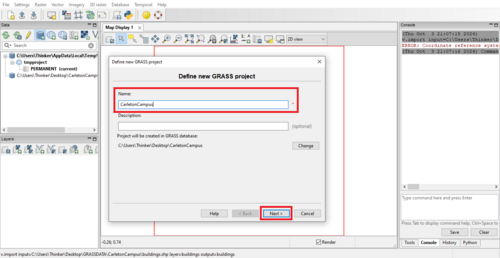
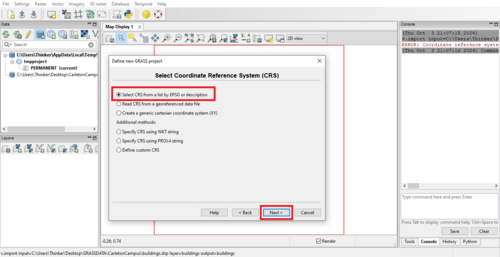
To work with your own data, you should start by creating a new project with a Coordinate Reference System (CRS) that is appropriate for your study area or matches the CRS of your data. To know more about CRS, see https://en.wikipedia.org/wiki/Spatial_reference_system
Fig 6. Defining new project
Fig 7. Selecting CRS
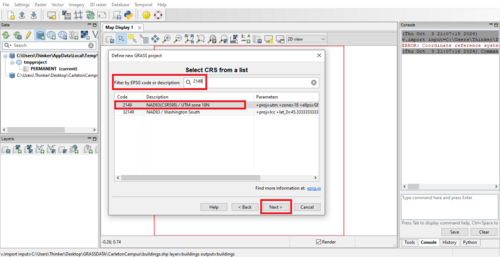
When you see the list, there are a lot of CRS that you can choose from according to your data location. You can also find in the list by their EPSG codes. See https://epsg.io/ In this case, Carleton University CRS is NAD83(CSRS98) / UTM zone 18N. You can also find it by writing 2149 (ESPG code) in the search box.
Fig 8. Selecting Carleton CRS
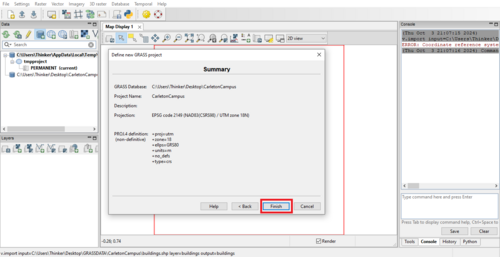
The last step before pressing the Finish button is to check the provided summary. If everything is ok, you can press Finish and go for the next steps.
Fig 9. Summary overview
Adding Layers to a Project
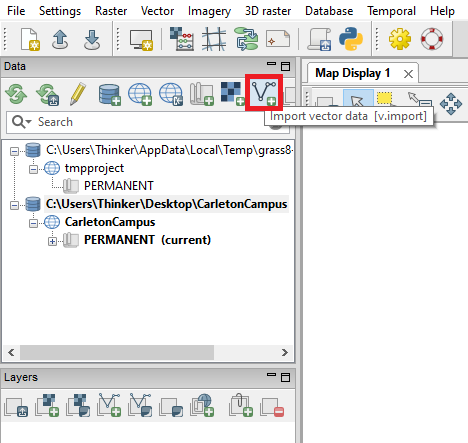
To add layers to the project, click on Import vector data icon ![]()
Fig 10. Import vector data icon
There are 2 ways you can add your layers. 1. One by one (File) 2. All together (Directory)
Adding layers one by one
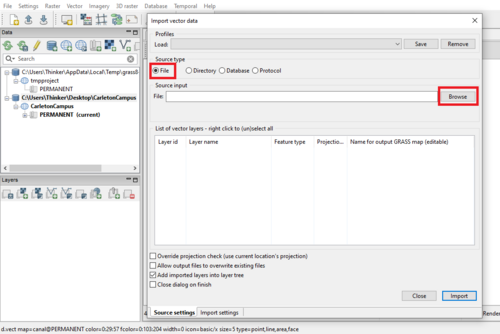
Click on Import vector data icon. In the Source type field, choose File. Then in the Source input, click on Browse. After that, windows will open through which you can navigate to the data storage location. Select the data file with the .shp extension.
Fig 11. Importing one layer – Step 1
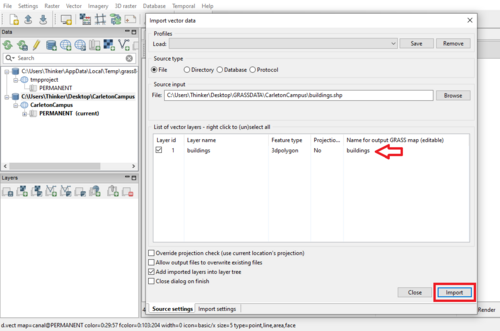
You can repeat this process to add all of the necessary layers.
Fig 12. Importing one layer – Step 2
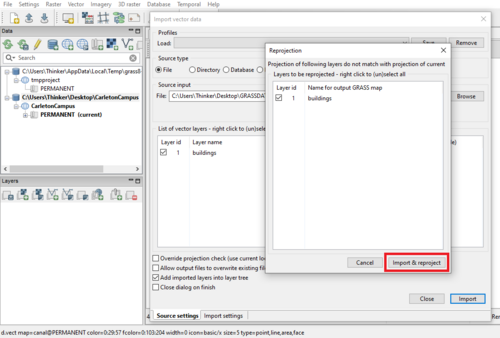
When all the layers add to the list, push Import button. Next, click on Import & reproject.
Fig 13. Importing one layer – Step 3
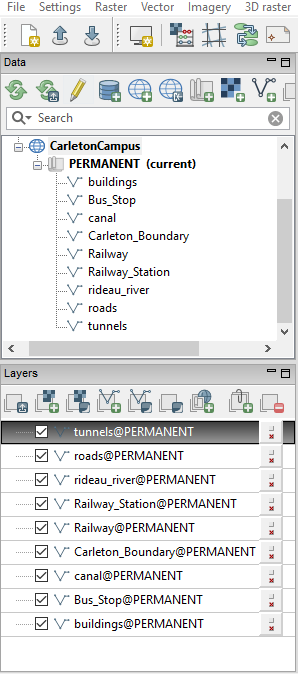
Finally, all the layers will be shown in the layers panel.
Fig 14. Layers in layer panel
Adding layers all together
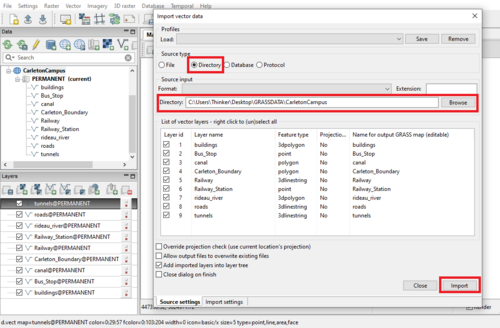
When you have more than one layer to add, it is easier and less time consuming to import them together. Firstly, place all the layers in one folder. It is similar to one by one method, but instead of choosing File in the Source type, select Directory. Then select the data folder, and continue the process like the previous method.
Fig 15. Adding layers together
Creating Final Map
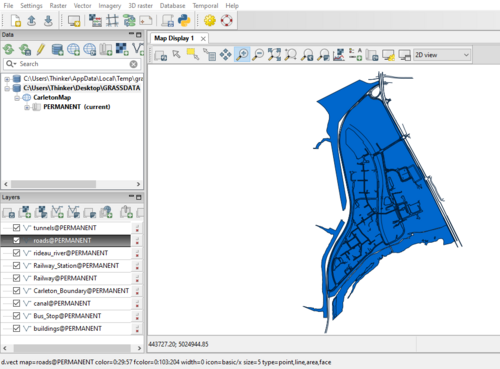
Now, all your layers are ready to be presented in an eye-catching way. As you can see, the default map is very simple and does not show any details about the Carleton campus.
Fig 16. Default map
For changing layer properties do this: Right click on layer -> Properties
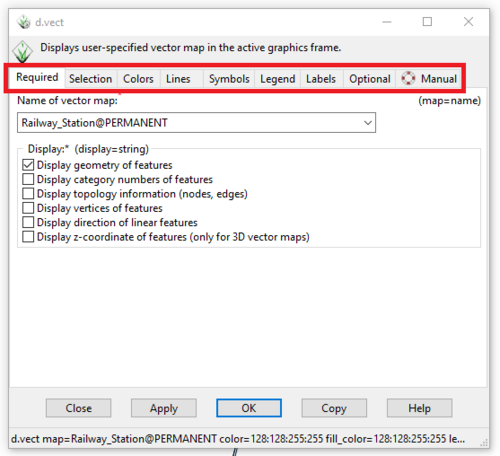
Fig 17. Tab properties
As you can see, there are some tabs that have different functions in map cartography. Each tab has options to make the map more beautiful, readable and informative. In the following, those that are most necessary for the cartography of this map are introduced.
Colors
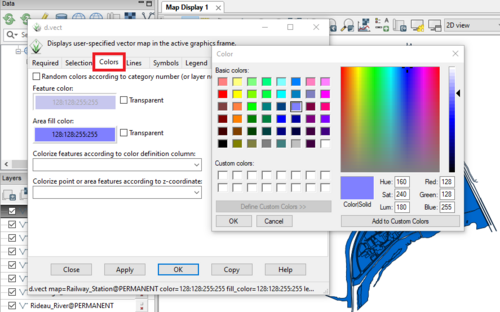
This tab gives you the ability to change outline and fill area colors of your layers. By clicking on each one, the color palette appears and you can choose any color according to your style.
Fig 18. Colors tab
Lines
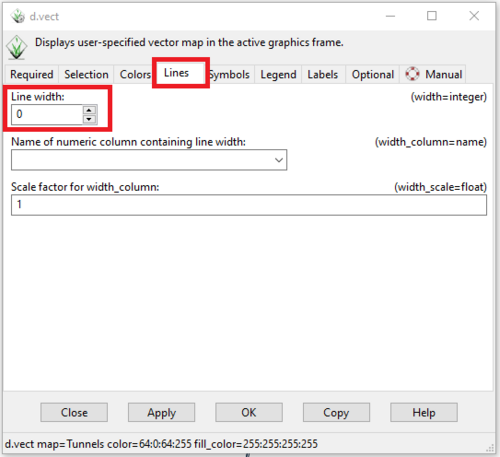
In this tab, you can customize your line properties. For example, you can make the lines thicker. Note that the default number is 0 and increasing it will make your lines appear thicker.
Fig 19. Lines tab
Symbols
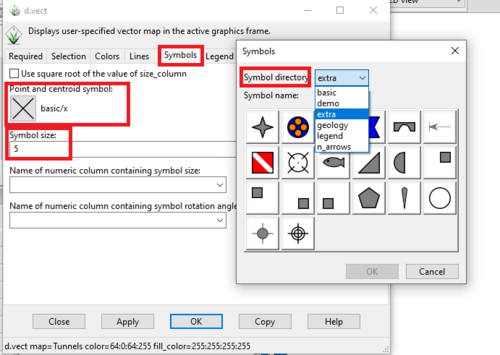
The symbols tab allows you to make changes in your point layers. The default symbol is x, but by clicking it, you can easily change it. The symbol directory provides you with a variety of different point symbols. It also enables you to alter the size of the symbol. If you want to change the color, go back to the color tab and select your desired color.
Fig 20. symbols tab
Legend
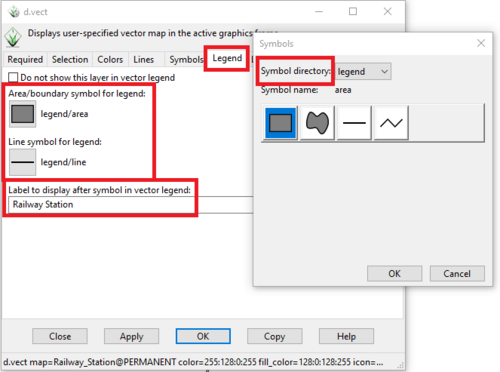
This tab allows you to determine how layers are displayed in the legend. If you don’t want to display a layer in the legend, you can do it just by a simple tick. In addition, you can change the name of layers without actually changing them. For this purpose, in the label display, write the name you want the layer to appear as in the legend.
Fig 21. Legend tab
Label
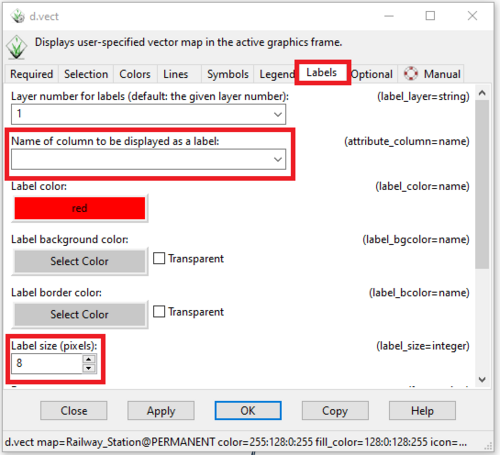
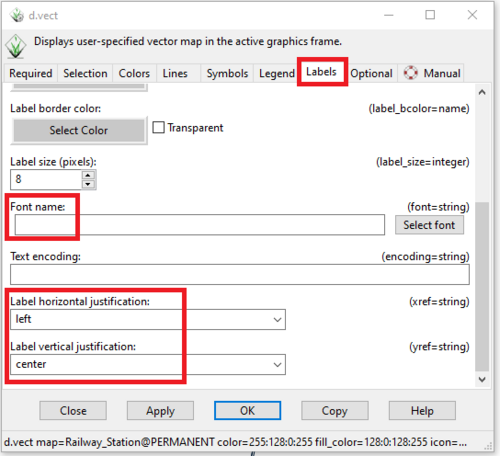
If you want to show properties such as name, number, etc. this is the tab you need. It allows you to pick a color, change size, select label font, and even horizontal or vertical justification. By placing labels on your maps, you make them more readable and instructive for users.
Fig 22. Label tab – Part 1
Fig 23. Label tab – Part 2
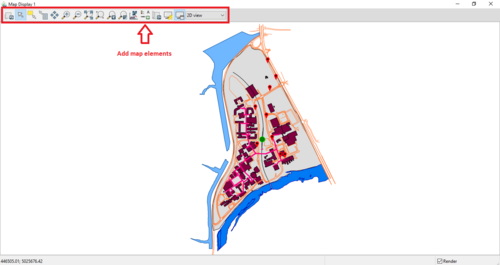
After customizing our map, it is time to add primary map elements like the legend, north arrow, map title, etc. From here on, we will continue to work in the map display environment. By un-docking it, we will have more space to display the map.
Fig 24. Map display
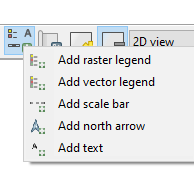
There are many icons in the map display which help us to create a better map. Zoom in and zoom out, pan, save, etc. but the most important icon is the “add map” elements. It allows us to add a legend, north arrow, scale bar, etc. You can easily manipulate them and by point icon
![]() move them to the suitable place in your map.
move them to the suitable place in your map.
Fig 25. Map elements
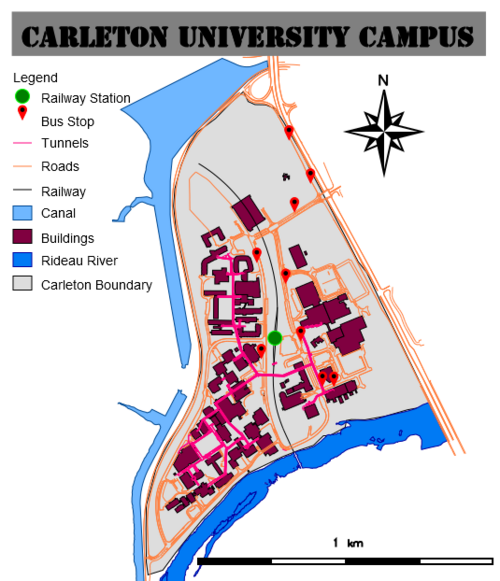
Finally, our map is ready!
Fig 26. Carleton University Campus Map
References:
1- https://grass.osgeo.org 2- https://grass.osgeo.org/learn/overview 3- https://grass.osgeo.org/grass84/manuals/helptext.html
