Difference between revisions of "Albedo Data and Surface Reflectance Data Visualizations in SNAP using MODIS Imagery"
SpenserZhang (talk | contribs) |
SpenserZhang (talk | contribs) |
||
| Line 111: | Line 111: | ||
[[File:Vis.PNG | 500 px]] |
[[File:Vis.PNG | 500 px]] |
||
| − | According to the pixel information above, we can calculate visible bands albedo [[File:Albedoresult.PNG | 320 px]]. For the study pixel, the calculated visible band albedo is 0.8212 and the provided visible band albedo is 0.8240. According to the user guide, the average error for visible bands is 4%, so the difference between calculated result and provided value is within an acceptable range. |
+ | According to the pixel information above, we can calculate visible bands albedo [[File:Albedoresult.PNG | 320 px]]. For the study pixel, the calculated visible band albedo is 0.8212 and the provided visible band albedo is 0.8240. According to the user guide, the '''average error''' for visible bands is 4%, so the difference between calculated result and provided value is within an acceptable range. |
There are two more formulas for NIR bands albedo calculation and shortwave bands albedo calculation. For NIR bands albedo calculation, the formula is [[File:NIRCALCULATION.PNG | 300 PX]]. For shortwave bands albedo calculation, the formula is [[File:SHORTCALCULATION.PNG | 300 px]]. |
There are two more formulas for NIR bands albedo calculation and shortwave bands albedo calculation. For NIR bands albedo calculation, the formula is [[File:NIRCALCULATION.PNG | 300 PX]]. For shortwave bands albedo calculation, the formula is [[File:SHORTCALCULATION.PNG | 300 px]]. |
||
Revision as of 00:04, 17 December 2019
Contents
Introduction
Software
We are going to use SNAP 7.0 to do visualization and data analysis.
Albedo
Albedo is the ratio of the amount of irradiance that is reflected by a surface to the total incoming irradiance. Albedo measured on a scale from 0 to 1. For example, a white-colored object reflects most of the incoming light and absorbs very little whereas, a black object will absorb most of the incoming light.
MODIS
MODIS is Moderate Resolution Imaging Spectroradiometer which aboard the Terra and Aqua satellite.
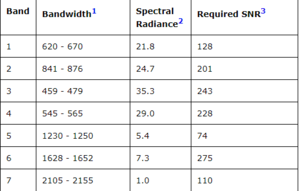
MODIS has 36 bands in total, but we are going to use band 1 to band 7 in this project. Band wavelength for all 1 to 7 are in nm.
According to the wavelength and colour spectrum, Band 1 represents Red, Band 2 represents NIR, Band 3 represents Blue and Band 4 represents Green. Band 6 represents SWIR.
Pros
Unlike Landsat or Sentinel product, MODIS provides daily satellite images. Daily images can help us to better understand what is occurring in the earth, or atmosphere. Also, MODIS is commonly using for detecting forest fires, floods or climate changes.
Saving more time. You don't have to do pre-processing like Sentinel 1 images.
Cons
Resolution is way lower than Sentinel images. Most MODIS products have 500m or 1km resolution.
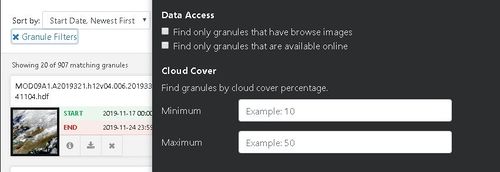
Cloud sensitive, which means MODIS cannot penetrate clouds. Fortunately, MODIS has built-in a cloud mask to remove clouds. Moreover. you can find MODIS image by cloud cover percentage through granule filters when you are downloading the product from NASA Earth data search.
Main Objective
1. Access and download MODIS imagery
2. Visualize MODIS imagery in SNAP
3. Compute NDSI band from MODIS imagery
4. Know some basic information about MODIS products
5. Getting started with MODIS products.
Data Acquisition
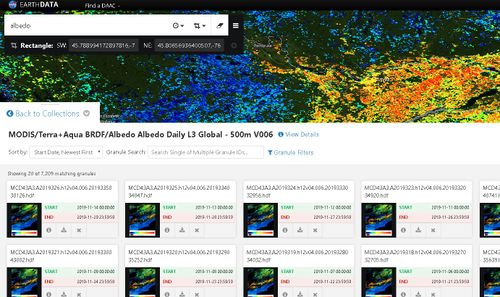
MODIS albedo and surface reflectance products can be download at NASA Earth Data Search. You have to register an Earthdata account before downloading the product.
MODIS related product are open to public and free to download.
MODIS provides daily satellite images from the year 2000 to the present.
In this tutorial, we are going to visualize one albedo product (MOD43A3) and one surface reflectance product (MOD09A1).
You can view the full description in the product selection page.
Visualization
Albedo Visualizations
Open the albedo product in SNAP and select Albedo_WSA_shortwave under the band selection. The MODIS albedo product provides three different types of albedo value, bidirectional, black sky albedo and white sky albedo. In this tutorial, we are going to visualize WSA (white sky albedo).
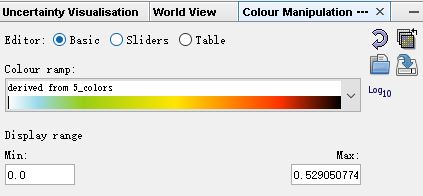
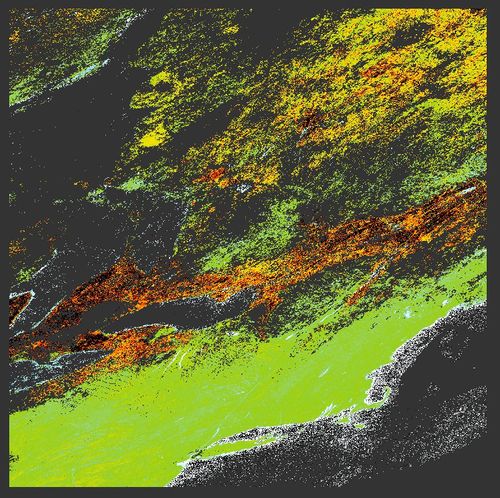
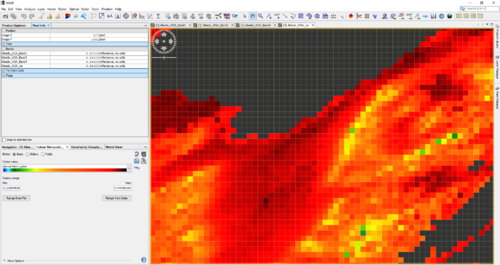
Go to Colour Manipulation, select "Basic" as editor type and choose a proper colour ramp. For albedo product, we usually choose light colour to represent small albedo area and dark red colour to represent high albedo area.
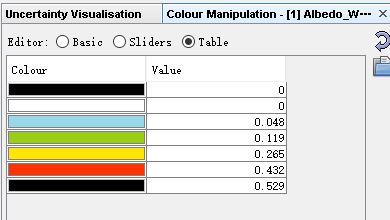
The output map with albedo value is shown below, and you can view each colour correspond to the relative albedo value under (Colour Manipulation - Table).
Mask out
What if you want to know the total area with an albedo value greater than 0.2.
You can go to Mask Manager - Creates a new mask based on a value range and input the value range.
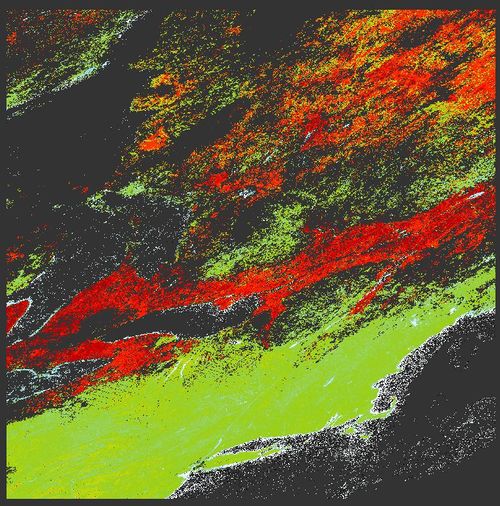
Then a new mask has been created and you can see the masked out area below. The right image is the original image, and the left image is the masked image. Red areas albedo are greater than 0.2.
Ice Albedo Visualization and Calculation
Snow and Ice cover land should have higher albedo than urban area. We are going to use albedo value in visible band as an example to demonstrate snow and ice cover land albedo.
Download an area with snow or ice cover area. For this tutorial, we are using the Ward Hunt ice shelf (Northern coast of Ellesmere Island, Nunavut, Canada) as a study area.
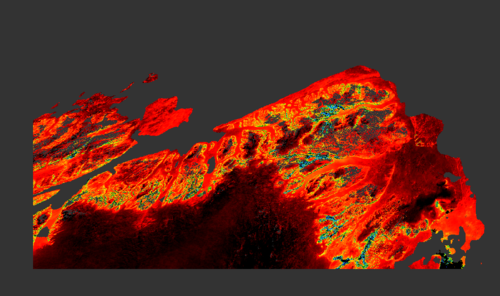
Open the download product in SNAP, and open Albedo_WSA_Band1, Albedo_WSA_Band3, Albedo_WSA_Band4, and Albedo_WSA_vis. Select Albedo_WSA_vis and go to Colour Manipulation - Basic - Colour ramp to change the albedo map from black&white to colours map. You should say some output map like below,
In the MOD43A3 product, they are also provided albedo in each different bands. For example, we have albedo from band 1 to band 7. The Albedo_WSA_vis are calculated by the formula 
You can view the each pixels albedo value from pixel info, and use the pixel information to calculate visible bands albedo value.
According to the pixel information above, we can calculate visible bands albedo . For the study pixel, the calculated visible band albedo is 0.8212 and the provided visible band albedo is 0.8240. According to the user guide, the average error for visible bands is 4%, so the difference between calculated result and provided value is within an acceptable range.
There are two more formulas for NIR bands albedo calculation and shortwave bands albedo calculation. For NIR bands albedo calculation, the formula is . For shortwave bands albedo calculation, the formula is
.
Surface Reflectance Visualization
There are lots of RGB band combinations to visualize surface reflectance product.
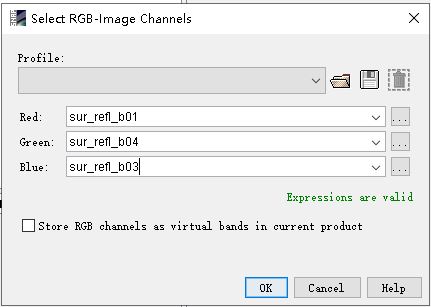
Open on MOD09A1 product in SNAP and select it. Go to Window - Open RGB image window to select RGB - image channels.
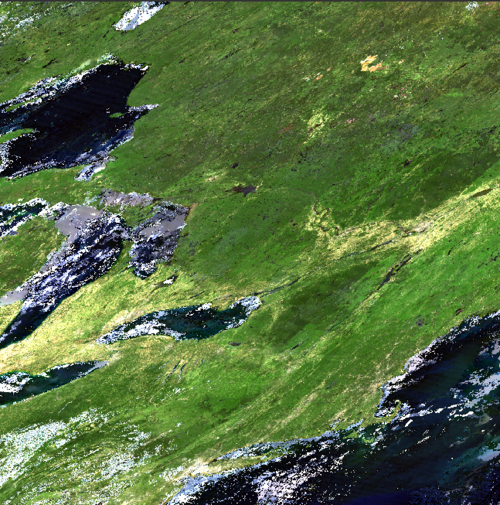
The band combination 1-4-3 creates a true colour image, which represents how the human eye would see the area.
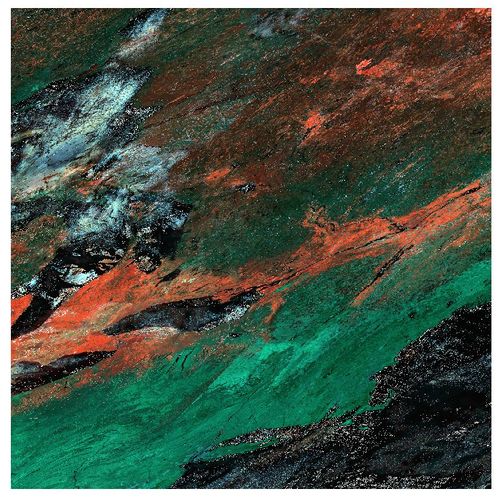
The band combination 3-6-7 highlights snow and ice.
In this band combination, the snow is shown as red, clouds are white, vegetation is green, ice is pinkish red.
There are more band combinations such as 7-2-1 or 2-1-1.
The band combination 7-2-1 is used to observe fire burn scars on the surface from fires. Burn Scars are showns as red to brown.
The band combination 2-1-1 creates a false-colour image. Vegetation is green, clouds appear white.
NDSI
Remote sensing index can be calculate by MODIS image.
NDSI is Normalized Difference Snow Index. NDSI are commonly used in cloud or snow differentiation. Cloud and snow are all shown as bright colour in a true colour image, however, snow is getting darker when the wavelength is greater than 1.6mm. According to the MODIS band wavelength above, for MODIS data the NDSI is calculated as:
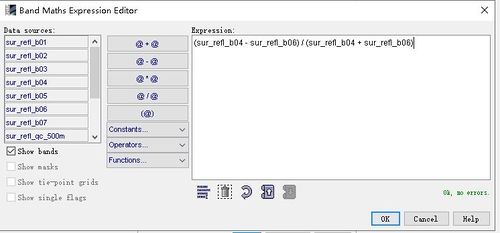
NDSI = (Band 4 - Band 6) / (Band 4 + Band 6)
The calculation can be done by Band Maths which under Raster.
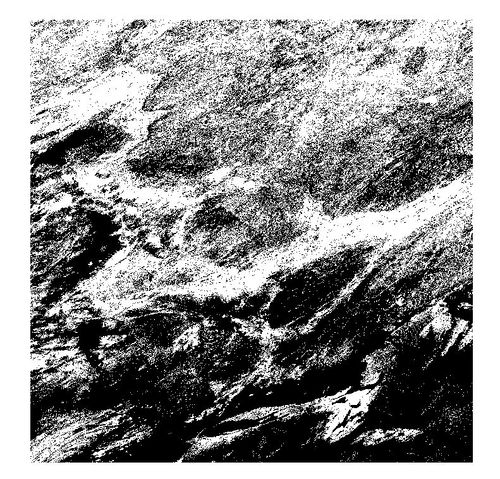
Areas with NDSI > 0.4 are snow area. In the output map, the white area is shown as the snow-covered surface.
NDSI analysis
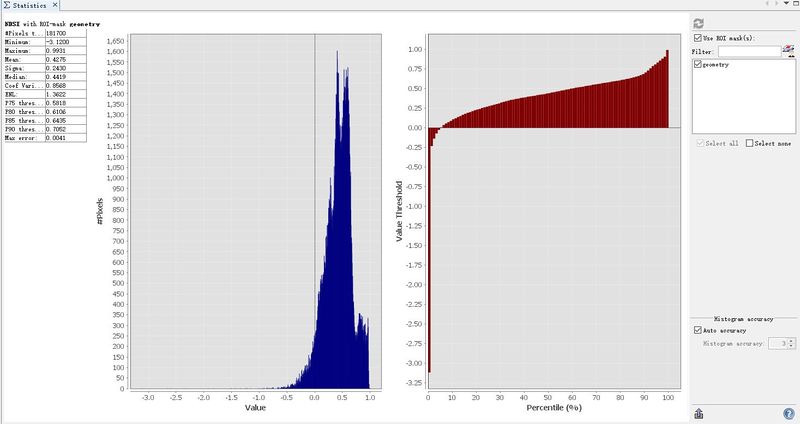
If you want to know the NDSI for a specific region or you want to calculate the mean, of maximum NDSI, you can use Analysis - Statistics to see those values.
In this tutorial, just create a polygon or square above the image and go to Mask Manager to select the mask you just created. If you want to know the average NDSI for the Ottawa area, download the Ottawa boundary shapefile and go to Vector - Import - ESRI Shapefile to import the vector mask.
Then open the Analysis - Statistics window to see the statistics value.
Other Product
NDVI
NDVI (normalized difference vegetation index) can also be computed by MODIS surface reflectance imagery. The formula is NDVI = (band 2 - band 1) / (band 2 + band 1).
However, MODIS has three different resolution (250m, 500m, 1km) products contain NDVI value. The product names are MOD13Q1, MOD13A1, MOD13A2. You can view more information from MODIS Vegetation Index Products
Snow cover
The product MOD10A1 identifies snow-covered land and snow-covered ice on inland water.
Surface Temperature
The 31st and 32nd bands of MODIS are using for surface and cloud temperature monitoring, and the band width for 31st band is 10.780 - 11.280 µm, for 32nd band is 11.770 - 12.270 µm.
Therefore, MODIS has several products with surface temperature value. For example, MOD11A1 for daily surface temperature, MOD11A2 for 8-day surface temperature
Reference
NASA Products list: https://modis.gsfc.nasa.gov/data/dataprod/
MOD09A1 Product description: https://lpdaac.usgs.gov/products/myd09a1v006/
Getting Started with MODIS V6 Surface Reflectance Data: https://lpdaac.usgs.gov/resources/e-learning/getting-started-modis-v6-surface-reflectance-data-part-2-interpreting-quality-information/
Validating MODIS land surface reflectance and albedo products: methods and preliminary results : http://cursosihlla.bdh.org.ar/ET_Local_Regional_2014/Clase_5/3_Material_Lectura/2002_Liang%20et%20al._ALBEDO.pdf
