Difference between revisions of "Creating service area in QGIS"
| Line 66: | Line 66: | ||
Findingvalhalla.PNG| |
Findingvalhalla.PNG| |
||
</gallery> |
</gallery> |
||
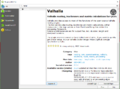
| + | In this tutorial we will be creating service areas for walking distances so click '''Valhalla > Pedestrian > Isochrones Pedestrian''' in the processing tool box. |
||
| − | Setting up the menus |
||
| + | In the Isochrones Pedestrian menu that opens select '''Mapbox''' in the '''Provider''' section. Then in the input point layer section select '''Play_Area_-_Structures''' file. In '''Mode''' select '''Fastest''' because we will be looking at time intervals instead of distance intervals. Lastly in the '''Comma-separated time internals [Min]''' section put 5, 10, 15 and make sure to leave the '''Comma-Separated distance intervals [km]''' blank. This will give us three intervals for each point for just out time intervals we put in. (This tool does have a glitch that if you have mode set to fastest and are putting in distance intervals it will put the units as minutes instead of km in the output). You will not have to set any of the advanced parameters for this tutorial as Valhalla already has appropriate defaults for them. For example walking speed will be 5.1 km/h if you do not set anything in this parameter. |
||
<gallery> |
<gallery> |
||
valhalla.PNG| |
valhalla.PNG| |
||
</gallery> |
</gallery> |
||
| + | |||
output |
output |
||
| + | |||
==== Heading text ==== |
==== Heading text ==== |
||
save as |
save as |
||
Revision as of 18:16, 20 December 2021
Contents
Introduction
Network analyst tools comparing the in program tool to a plug in basic how they are different
Data
Finding and downloading data
For this tutorial we will be using only open data and open sourced programs. You will need to have QGIS installed to perform this tutorial. All data will come from Open Ottawa Catalogue. The files you will need for this tutorial are: road-centerlines play-area-structures ottawa-neighbourhood-study-ons-neighbourhood-boundaries-gen-2.
To download these files select down load or the symbol that looks like a cloud with a down arrow in it. This will open several options of formats to download the files in. You should select Shapefile.
Once all the data is downloaded create a folder in you computer to move all your data files to. Name this new folder something relevant to the tutorial so it is easy to find like NetworkAnalysis_ServiceAreasTutorial. This is to ensure you can easily all the files needed.
Uploading data into QGIS
To add the data in to QSIS go to the Layer tab at the top of the program select Add Layer > Add Vector Layer. This will open a menu called Data Source Manager| Vector. In this menu click the three dots symbol to browse your computer and find the files that were downloaded in the previous step. Select the Play_Area_-_Structures folder and then select the .shp file in that folder. Click Open. After this select Add at the bottom of the menu. Do this for the rest of the files downloaded in the previous step.

Part 1: QGIS Network analyst tool
What is the network analyst tool how does it work
Creating Service Areas
Network data (deleting some roads)

Finding Network analyst tools

setting Network analyst menus output Creating polygons around them ?dissolve output
Part 2: Valhalla Network Analyst tool
What is the Valhalla plug in how does it work
Plugins
Downloading the plugins
To start this section of the tutorial you will first need to install two plugins. To do this you will go to Plugins tab at the top of the QGIS program and select manage and install plugins. In the search bar of the menu that opens type in QucikMapServices and select install. This plug in will allow us to put a base map of the city into our map. Then in the same menu search for Valhalla and install this plugin as well.
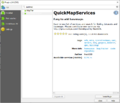
QuickMapServices Plugin
Valhalla Plugin


Creating Service Areas
Creating a mapbox account and and API key
Before you will be able to use this tool you must create a mapbox account to obtain an API tool. To create an account go to Mapbox and select sign up at the top of the page. Once you create and account and log in it will take you to a page that at the bottom will have a box that say "Access token". Select Create a token.
In the page you are taken to you will see you must create a name for your token. You may call this whatever you like. For example call it Tutorial.
After you create your token copy it by clicking the small clipboard symbol beside it and go back to QGIS.
Inputting API key
You must input your token to run any Valhalla tools. This is just to keep track of who is using the tool. To do this you must select the Web tab go to Valhalla and then click Valhalla. In the menu that opens click the gear looking symbol. This will open a menu called Provider Settings. In this menu select Mapbox, which should be the second option in the menu, and past your token into the section that says API Key and click OK. You may now close the Valhalla menu you have open

Using Valhalla tools
To open the Valhalla tool go to the processing tab and select tool box (you can skip this step if you already have the tool box open). You should now be able to scroll to find Valhalla or you can search for it at the top of the processing tool box.

In this tutorial we will be creating service areas for walking distances so click Valhalla > Pedestrian > Isochrones Pedestrian in the processing tool box. In the Isochrones Pedestrian menu that opens select Mapbox in the Provider section. Then in the input point layer section select Play_Area_-_Structures file. In Mode select Fastest because we will be looking at time intervals instead of distance intervals. Lastly in the Comma-separated time internals [Min] section put 5, 10, 15 and make sure to leave the Comma-Separated distance intervals [km] blank. This will give us three intervals for each point for just out time intervals we put in. (This tool does have a glitch that if you have mode set to fastest and are putting in distance intervals it will put the units as minutes instead of km in the output). You will not have to set any of the advanced parameters for this tutorial as Valhalla already has appropriate defaults for them. For example walking speed will be 5.1 km/h if you do not set anything in this parameter.

output
Heading text
save as dissolve together

trouble shoot fix geometry set symbology

output
Conclusion
comparing out puts from both tools strengths and weaknesses from both tools uses for these tools and their outputs