Digitizing in QGIS
Contents
Purpose
The purpose of this tutorial is to demonstrate the process of creating a vector model by digitizing an aerial image within QGIS.
Objective
The objective is to retrieve an aerial image of the City of Ottawa and using QGIS software digitize the different land use cover classes and geographical features within the photo.
Software
The software that will be used for this tutorial is QGIS 2.18.15. QGIS is a user friendly open source geographic information system, it runs on Linux, Unix, Mac OSX, Windows and Android and supports numerous vector, raster and database formats and functionalities. The software can be downloaded at [QGIS].
Data
The data for this tutorial is a aerial photo that was retrieved from [Carleton Library Aerial Images]. The specific aerial image that was used in this tutorial was from the 2014 Orthophotos-National Capital Commission (20cm) and the region that was chosen was over Carleton University.
Methods
This section outlines the steps that will be taken to digitize the image.
Before Beginning
Make sure to have QGIS downloaded and an aerial image saved to a location that it can be accessed.
Starting New Project
For this tutorial we will want to create a new project where all of the data will be stored.
- Along the main toolbar locate the "Project" tab-->New
Adding Aerial Image
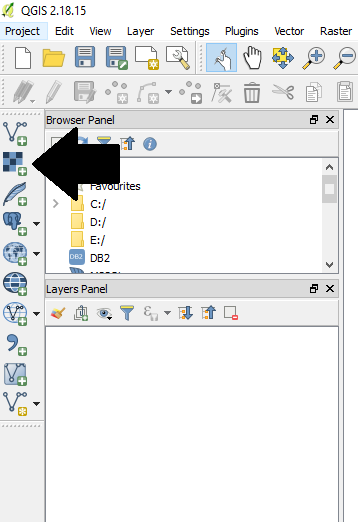
To add the aerial image that was chosen and saved, it can be added into the QGIS canvas by using the "Add raster layer" button.
- The "Add raster layer" button is located along the left panel

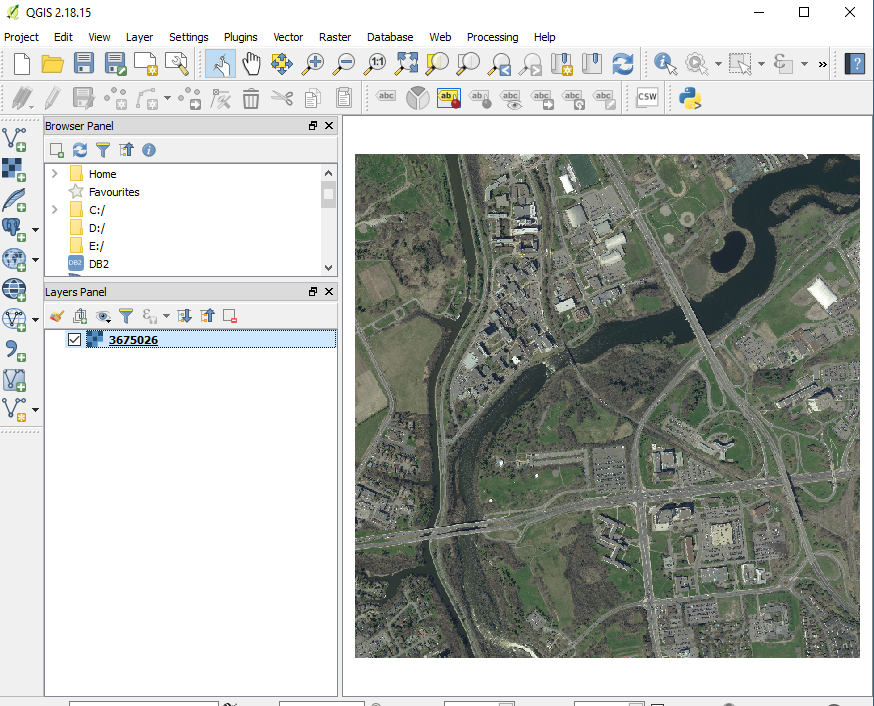
- Locate the drive that you saved your aerial photo in and click "Open"
- Your aerial photo should now be open on the QGIS canvas, you can use the "Zoom in" tool
 and the "Zoom out" tool
 to help you identify geographical features or land uses within the aerial image.

Snapping Options
When digitizing there should be no gaps between vector layers, so setting up the snapping options will ensure that all lines and polygons are placed tightly together.
- Along the main toolbar locate "Setting" and select "Options"
- The "Options" window will open and you will need to locate the "Digitizing" tab and click it
- Within the "Digitizing" tab you will see subheadings-locate "Snapping"
- Within the "Snapping" subheading, you will set change the settings to the following:
- "Default snap mode" select "to vertex and segment"
- "Default snapping tolerance" set to "10.0 pixels"
- Search radius" to "10.0 pixels"
Setting the Projection
Before beginning to digitize the image, you need to make sure the correct projection is set for the image.
- To set the projection locate your aerial photo on the "Layer Panel"
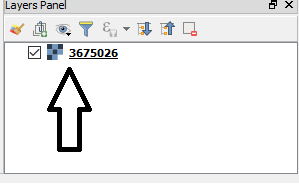

- Right click on the aerial photo and select "Properties"
- Within the "General" tab in the properties window, locate the "Coordinate reference system" subheading and click on the "Coordinate tab"

- A window titled "Coordinate reference system selector" will open and within the filter search bar you can search for the appropriate coordinate system for the image you are using. For an aerial image of Ottawa the coordinate system will be MTM zone 9. Once you have selected your coordinate system click "Ok" and "Apply".
- Within the "General" tab in the properties window, locate the "Coordinate reference system" subheading and click on the "Coordinate tab"
Digitizing
- Along the main toolbar locate "Layer" select "Create Layer" and select "New Shapefile Layer"
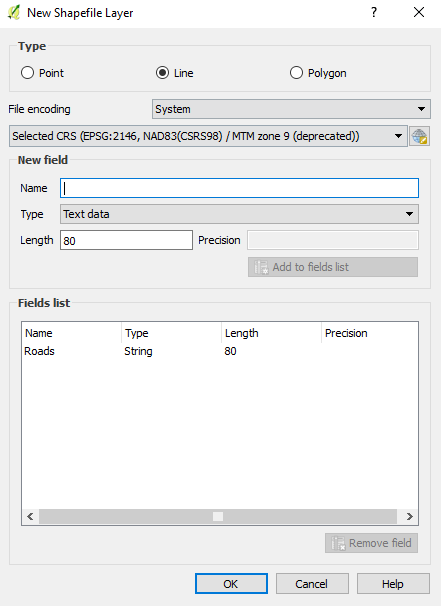
- A new box will open, the first choice is whether you want to draw a point, line or polygon
- Choose "line" as we will draw the roads within the image
- The next step is to set the projection so that the lines are within the same coordinate system as the aerial image
- Click the "coordinate tab" and a new bow will open titled "Coordinate Reference System Selector". Within the filter option search for MTM zone 9 and select it and click "Ok"
- Click the "coordinate tab"
- Still within the "New shapefile layer" box, you will need to fill in the fields for the vector line. Under the subheading "New field" fill in the following;
- Name; Roads
- Type; Text data
- Length; leave the default value
- click "Add to fields list"
- Within the "Fields list" box there is a default vector layer, you may want to delete this. You can delete it by selecting it and clicking the "Remove field" button

- Save your new shapefile, to the location that your project is saved
- Along the main toolbar locate the "Toggle editing button"

- Select the "Add feature" button
 , using this feature draw along a road, when you are finished drawing the road right lick and a new box will open titled "Roads-feature attributes"
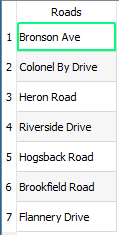
- Within the roads field, label the road with the appropriate name (i.e. "Bronson")
- To double check to see if the information entered into the feature attributes box, you can go back to the "Roads" layer within the "Layers Panel", right click it and go to "Open Attribute Table". Within the table there should be the road name that you entered.

- The roads that you drew should now be present on the aerial image, if you wanted to adjust the appearance of that vector layer(making them wider or a different colour, you can do this by;
- Right click the "Roads" tab within the "Layers panel" select "Properties" and select "Style"
- To continue to digitize you may want to classify the parcels of land into different land classes. The same process would be repeated:
- create new layer
- select polygon
- set coordinate system
- give appropriate title to your new vector layer
- add to field list
- draw polygon
- customize vector layer
Calculating Area of Vector Layer
If you wanted to calculate the geometric area of the different land use cover classifications, this can be done by following these steps:
- Select one of the polygon vector layers and right click on it and select "Open attribute table"
- You will need to "Toggle editing mode" on, click the toggle button
- Now will need to add a new column within the attribute table where you will do the calculation for geometry for each polygon, you will need to click the "New field" button
 .
. - The "Add field" box will open, fill in the following;
- Name: "Area"
- Type: "Whole number (integer)"
- Length: "10"
- Once filled in, click "Ok"
- A new column should now be added in the attribute table titled "Area".
- To calculate the area, you will need to click the "Field calculator"

- The "Field calculator" box will open, you will need to select "Update existing field" and select the "Area" column.
- You now will need to select "Geometry" from "row_number"
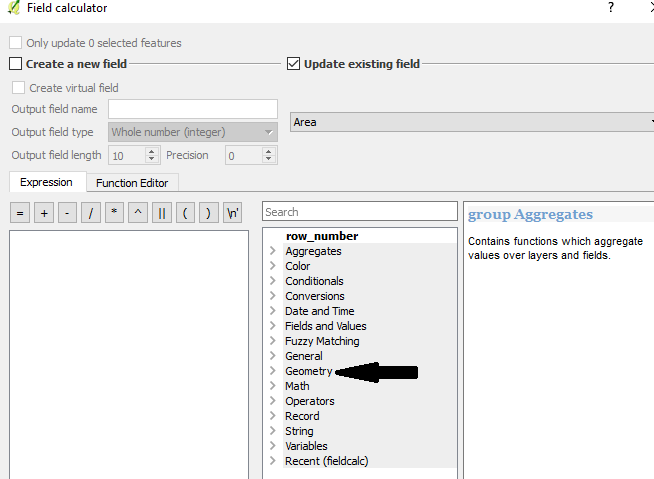
- A drop down list will open for geometry and you will need to select "$area" and click "Ok"
- The window will close and within your attribute table you should now have a calculated area for the area column

Final Vector Model
- When you have digitized all the geographical features and classified the parcels of land into dyouifference land use classifications, your final vector model should be similar to;
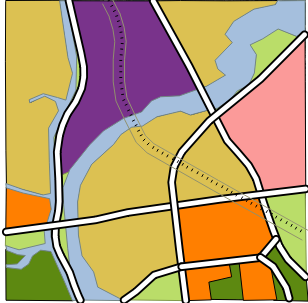

- As well as the "Layers Panel" should include all the different land classifications layers that you added onto the map.
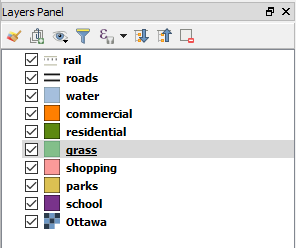

- Within each layer, there should be a corresponding attribute table, right click and select open attribute table.

Conclusion
Following this tutorial, you should have a completed vector model that was created by taking an aerial photo and digitizing the geographical features and land use classes that provides necessary information from that specific region.