Difference between revisions of "Distance Matrix Analysis and Spatial, Non-Spatial and Temporal Querying with QGIS"
Lprocunier (talk | contribs) |
Lprocunier (talk | contribs) |
||
| Line 72: | Line 72: | ||
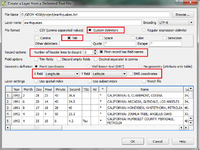
*Fill in the <b> Create a Layer from a Delimited Text File </b> window with the proper information and attach the text file. |
*Fill in the <b> Create a Layer from a Delimited Text File </b> window with the proper information and attach the text file. |
||
| − | <b>DISCLAIMER:</B> if an error occurs, it is because one |
+ | <b>DISCLAIMER:</B> if an error occurs, it is because one of your features does not contain proper coordinates |
[[File:textdelim.png|200px|thumb|left]] |
[[File:textdelim.png|200px|thumb|left]] |
||
| Line 91: | Line 91: | ||
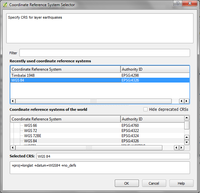
| − | *Now choose your reference system |
+ | *Now choose your reference system. For the purpose of this tutorial, WGS 84 was chosen. |
[[File:textdelim2.png|200px|thumb|left]] |
[[File:textdelim2.png|200px|thumb|left]] |
||
| Line 149: | Line 149: | ||
| − | *Your |
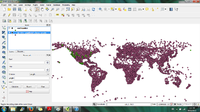
+ | *Your shapfiles should now look something like this: |
[[File:data.png|200px|thumb|left]] |
[[File:data.png|200px|thumb|left]] |
||
| Line 179: | Line 179: | ||
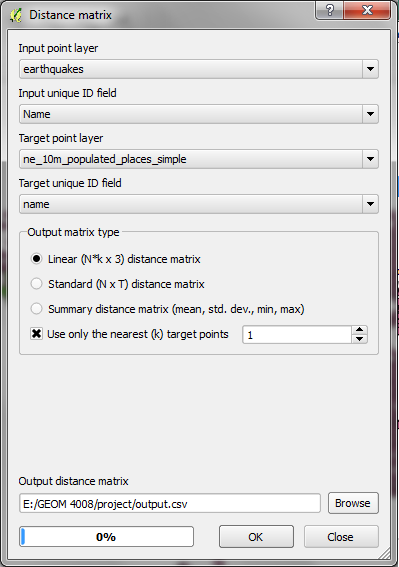
*To fill in the Distance Matrix Window, select <b>Earthquakes</b> as you Input point layer, <b>Name/Location</b> as your Input Unique ID field, <b>Populated Places</b>layer as your Target Point layer, and the <b>Name</b> of the Populated Place as the Target Unique ID field. |
*To fill in the Distance Matrix Window, select <b>Earthquakes</b> as you Input point layer, <b>Name/Location</b> as your Input Unique ID field, <b>Populated Places</b>layer as your Target Point layer, and the <b>Name</b> of the Populated Place as the Target Unique ID field. |
||
| − | *Now for the Output Matrix Type we are going to pick a <b> Linear (N*k x 3) distance matrix</b> and also check off the box for only using one of the nearest (k) target points. This is because we are look for the Natural Neighbour to each earthquake and we only want to know the |
+ | *Now for the Output Matrix Type we are going to pick a <b> Linear (N*k x 3) distance matrix</b> and also check off the box for only using one of the nearest (k) target points. This is because we are look for the Natural Neighbour to each earthquake and we only want to know the closest city and not a number of closest cities. |
*The window should look something like this: |
*The window should look something like this: |
||
| Line 193: | Line 193: | ||
*Now to complete the matrix hit <b>OK</b>. |
*Now to complete the matrix hit <b>OK</b>. |
||
*Now to manually add the output matrix into QGIS, use the same method as adding the Populated Places data by using the <b>Add Vector Layer</b> button. |
*Now to manually add the output matrix into QGIS, use the same method as adding the Populated Places data by using the <b>Add Vector Layer</b> button. |
||
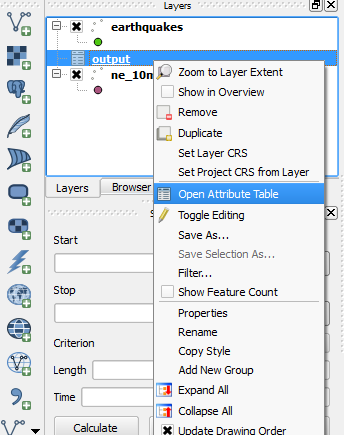
| − | *To view the results of the Distance Matrix, <b>RIGHT Click</b> on the matrix in your Layers window on the left side of QGIS Desktop. Then click on <b> Open Attribute Table</b> like displayed in the image below: |
+ | *To view the results of the Distance Matrix, <b>RIGHT Click</b> on the matrix in your Layers window on the left side of QGIS Desktop. Then click on <b> Open Attribute Table</b>, much like what is displayed in the image below: |
[[File:openatt.png]] |
[[File:openatt.png]] |
||
| Line 205: | Line 205: | ||
| − | *Once the Layer Properties window is open, open the Join tab on the left side of the window and click the add button at the bottom to add a vector |
+ | *Once the Layer Properties window is open, open the Join tab on the left side of the window and click the add button at the bottom to add a vector: |
[[File:addjoin.png]] |
[[File:addjoin.png]] |
||
Revision as of 02:35, 19 December 2013
Contents
Purpose
The objective of this tutorial is to demonstrate how to convert CSV files to shapefiles, how to complete a Natural Neighbour Analysis using the Distance matrix tool, and how to query using Quantum GIS 2.0.1. This tutorial will be done using open source data. This tutorial compares Significant Earthquakes from 1990 - 2013 in North America and their relation to Populated Places around the globe. The earthquake data was retrieved from the Significant Earthquake Database on the National Oceanic and Atmospheric Administration Website [1], and the Populated Places data was retrieved from the Natural Earth Website [2].
The Purpose of this tutorial is to fulfill the partial requirements of the GEOM 4008 - Advanced Topics in Geographic Information Systems class' final exam project at Carleton University. The purpose of this project was to explore the advantages and disadvantages of different open source geographic information systems (GIS) programs.
Introduction to Quantum GIS 2.0.1
Quantum GIS 2.0.1 is a free Open Source Geographic Information System (GIS) program that is used to create, edit, visualize, analyze and publish geospatial information. The program is available for Windows, Mac, Linux, and BSD. This user friendly Open Source GIS program is licensed under the GNU General Public License and is an official project of the Open Source Geospatial Foundation. [3]
QGIS has many different features including QGIS Desktop, where you can create, edit, visualize, analyze and publish geospatial information; QGIS Browser, where you can browse and preview your data and metadata as well as more around your stored data; QGIS Server, where you can publish your QGIS projects as OGC compatible WMS and WFS services; and QGIS Web Client, where you can publish your QGIS projects.[4]
Downloading QGIS
Before beginning the tutorial, if you do not have the 2.0.1 version of QGIS please follow the steps below:
- Follow this link to download [5]
- Choose which version is compatible with the computer you are working on
- Follow the steps in the pop-up downloading window
Acquiring the Data
To download the Earthquake data follow these steps:
- Visit the Significant Earthquake Database at this link [6]
- Fill in the date of the form beginning in 1990 and ending in 2013
- Select North America and Hawaii as the Region Name
- Select Search Database at the bottom of the page
- copy all features and paste into a text file
- Save to folder
To download the Populated Places data follow these steps:
- Visit the Natural Earth Website at this link [7]
- Click to download the 1.47MB version of the Populated Places.
- Download the file
- Unzip the file
- Save to same folder as the the Earthquake file
Tutorial
Adding CSV File
- Once QGIS 2.0.1 opens, start by clicking the Add Delimited Text Layer
- Fill in the Create a Layer from a Delimited Text File window with the proper information and attach the text file.
DISCLAIMER: if an error occurs, it is because one of your features does not contain proper coordinates
- Now choose your reference system. For the purpose of this tutorial, WGS 84 was chosen.
- Your CSV layer is now added to QGIS
Distance Matrix Analysis
- First we need to add in the Populated Places data
- Navigate to the side bar or to the vector drop down menu on the above task bar and click Add Vector Layer
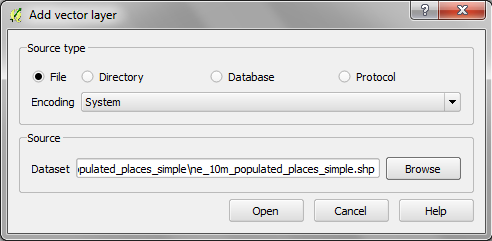
- Using the Add Vector Layer popup, navigate to your Populated Places Data and click Open
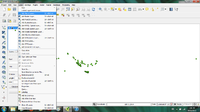
- Your shapfiles should now look something like this:
- Now to begin the Natural Neighbour Analysis by creating a Distance Matrix
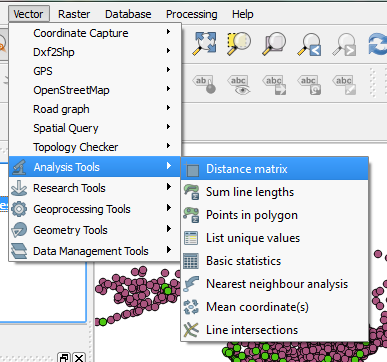
- Using the Vector drop down menu on the tool bar, select Distance Matrix under Analysis Tools
- To fill in the Distance Matrix Window, select Earthquakes as you Input point layer, Name/Location as your Input Unique ID field, Populated Placeslayer as your Target Point layer, and the Name of the Populated Place as the Target Unique ID field.
- Now for the Output Matrix Type we are going to pick a Linear (N*k x 3) distance matrix and also check off the box for only using one of the nearest (k) target points. This is because we are look for the Natural Neighbour to each earthquake and we only want to know the closest city and not a number of closest cities.
- The window should look something like this:
- Using the browse button, navigate to the folder where the Earthquake and Populated Places files are saved and create a name for the output Matrix.
- Now to complete the matrix hit OK.
- Now to manually add the output matrix into QGIS, use the same method as adding the Populated Places data by using the Add Vector Layer button.
- To view the results of the Distance Matrix, RIGHT Click on the matrix in your Layers window on the left side of QGIS Desktop. Then click on Open Attribute Table, much like what is displayed in the image below:
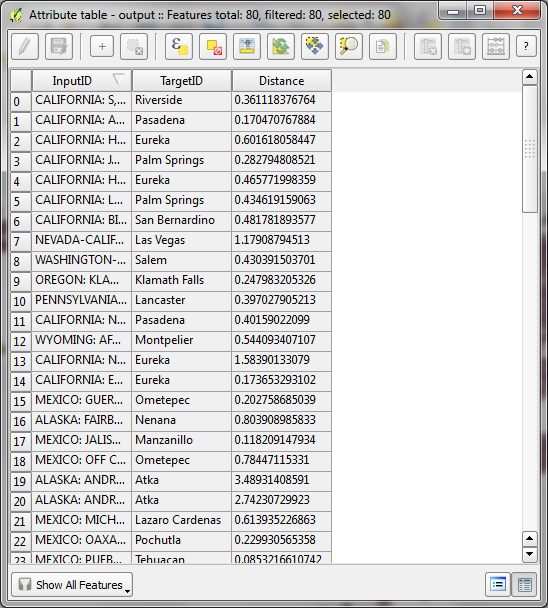
- The attribute table of the Distance Matrix should look something like the image below, where the first column is the Name/Location of the earthquakes that was chosen for the Unique ID, the second column shows the target unique ID representing the closest populated city by Name to the earthquake, and the third column represents the distance in degrees to the nearest earthquake.
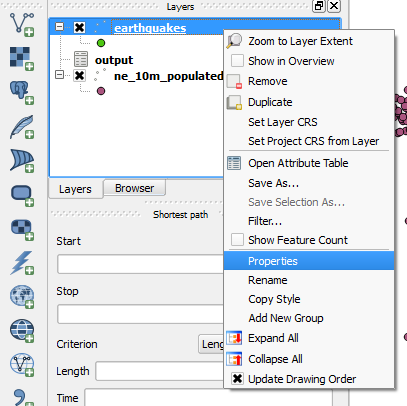
- To make for a simpler comparison, we are going to join the distance Matrix attribute table to the earthquake attribute table. To do this right click the earthquakes layer, and select properties like in the image below:
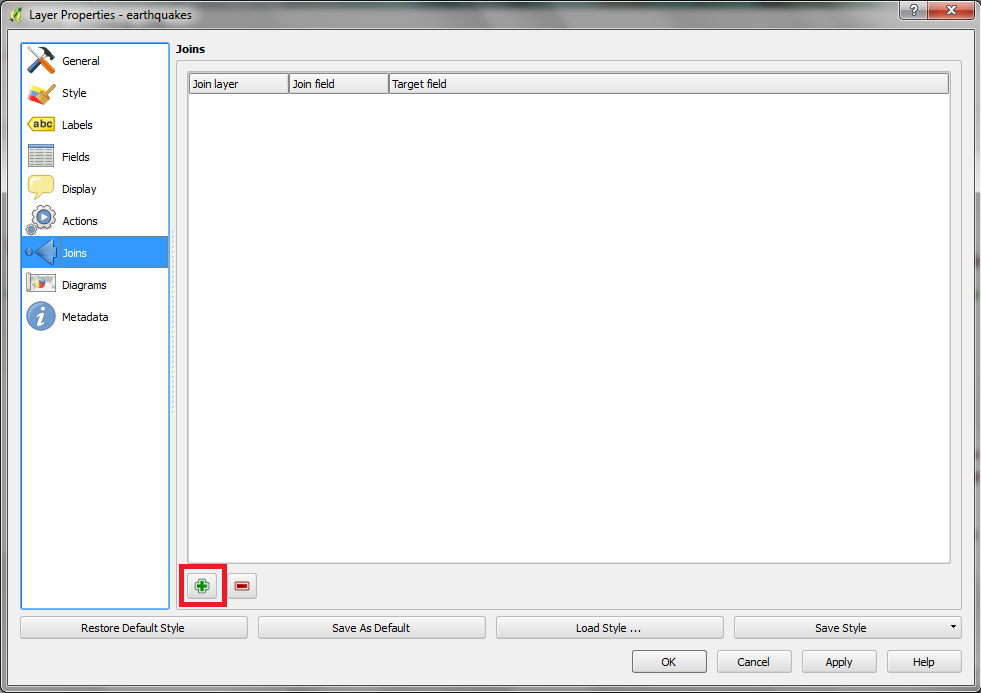
- Once the Layer Properties window is open, open the Join tab on the left side of the window and click the add button at the bottom to add a vector:
- This will open a window like in the image below. Select the created matrix as your Join Layer and the Input ID as your Join field and select name as your Target field.
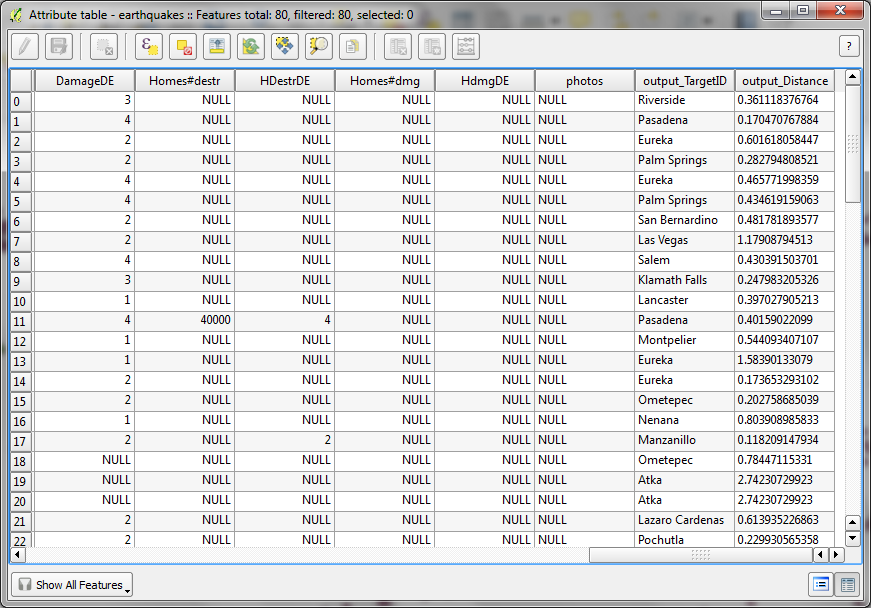
- The resulting earthquake Attribute table will look something like the image below:
Querying
Querying is the process of using an expression to select a subset of features within an attribute table.
- To begin querying first select the button at the top of the attribute table tool bar that says Select features using an expression like in the image below:
First Example
The first example will run through how to use a query expression to determine that amount of earthquakes that occurred during the month of August.
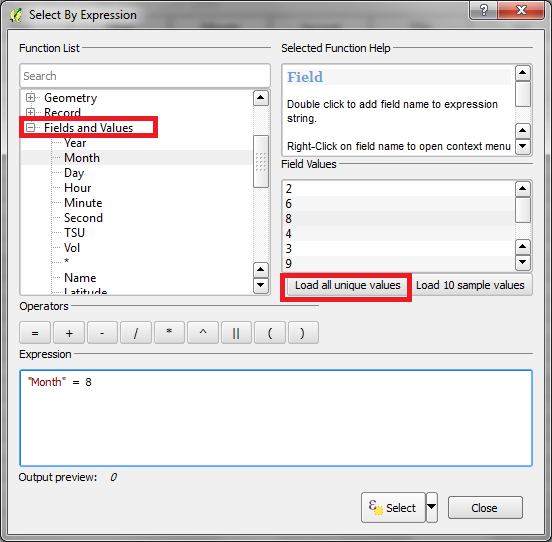
- using the Select by Expression window selected in the Earthquakes Attribute table, under the Function List select the Fields and Values category and double click on Month.
- Now under the Operators list, select the equals (=) sign,
- Next, under the Field Values List select Load all Unique Values. This will load all the possible values under the Month Column.
- Double click on the 8(representing the 8th month of the year)value under Field Values or type the number into the Expression box.
- The expression should look identical to what appears in the image below:
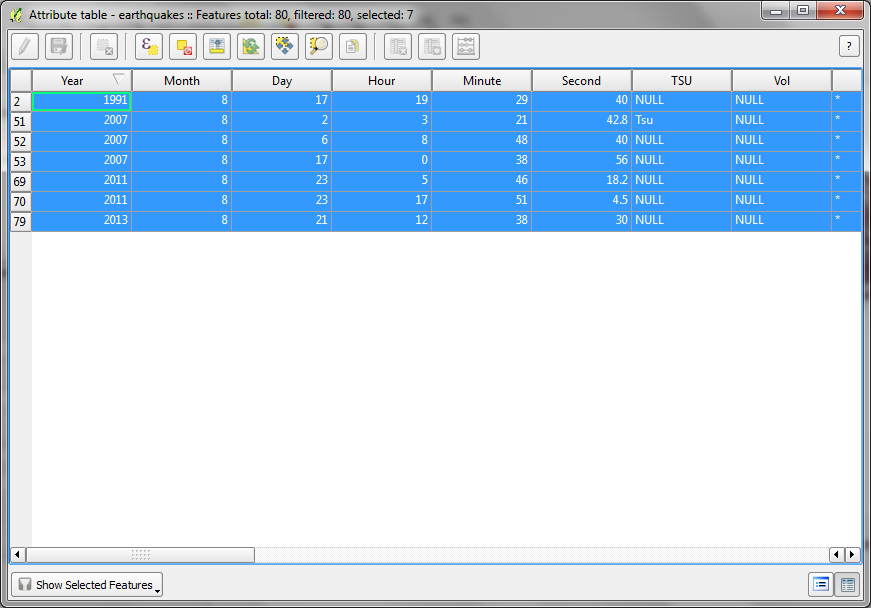
- Now looking at the attribute table, toggle to Show Selected Features at the bottom of the window and all the selected features will appear selected in the attribute table.
- The selected features in the image below, show that there were 7 of the 80 earthquakes occurred during the month of August.
Second Example
The second example will run through how to use a query expression to determine the amount of Populated Places with a population larger than 100,000.
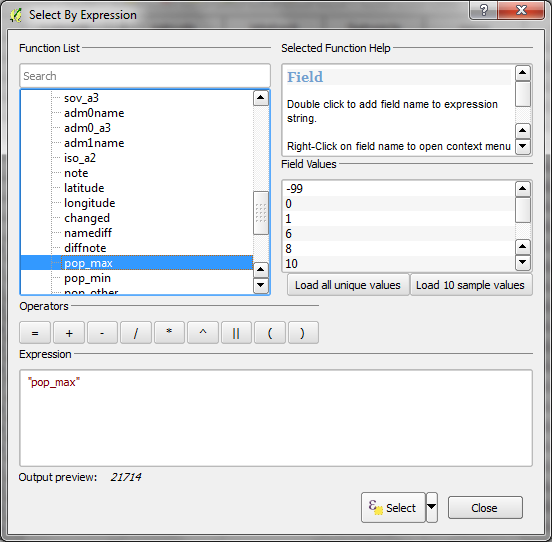
- Using the Select by Expression window of the Populated Places layer's attribute table select the Fields and Values tab.
- Double click on the feature called pop_max
- Double clicking will add the category to the expression box, much like what is shown in the image below:
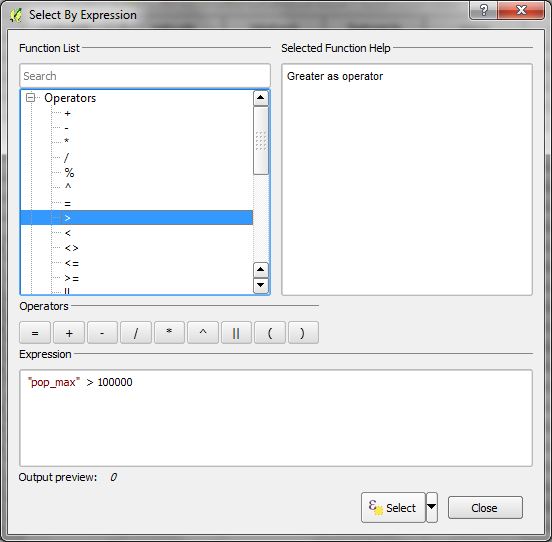
- Now under the Function list scroll up to the Operators tab.
- Select and double click the greater than symbol (>) under the operators tab, or manually type in the greater than symbol into the expression box.
- now manually type in 100000 into the expression box so the query expression looks like the expression in the image below:
- Click Select
- The selected features will appear highlighted in your attribute table.
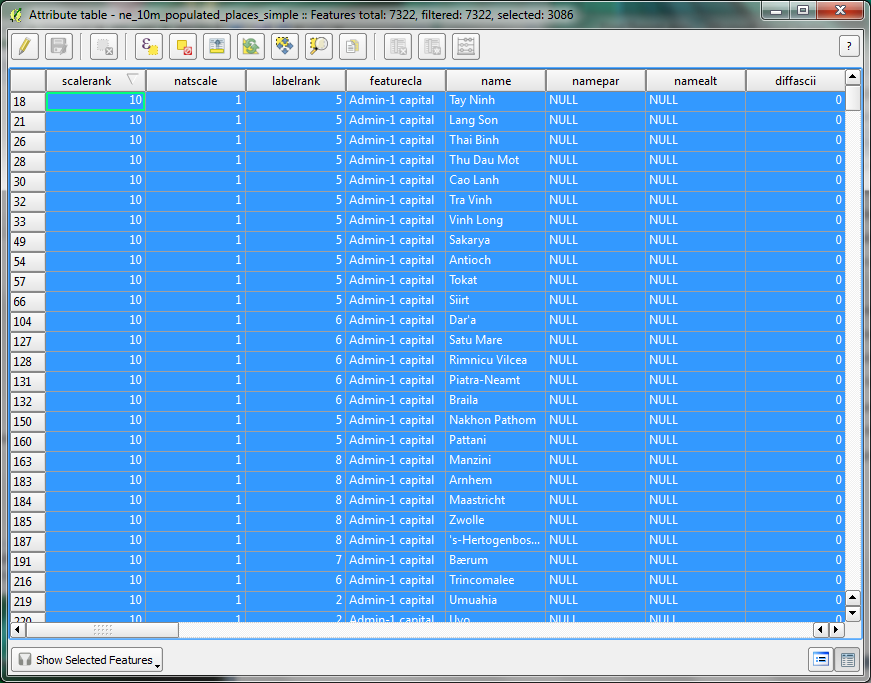
- The image below shows that there were 3086 out of the 7322 Populated Places that had a population larger than 100,000.
- To deselect the selected features click the Unselect All button on the Attribute table tool bar.
Third Example
The Third example will be to determine how many Populated Places Names begin with the letter F and end in the letter S.
- Follow the steps above, but this time under Fields and Values tab select Name.
- Double click Name so it appears in the expression box, then open the Operators tab.
- Select and double click LIKE
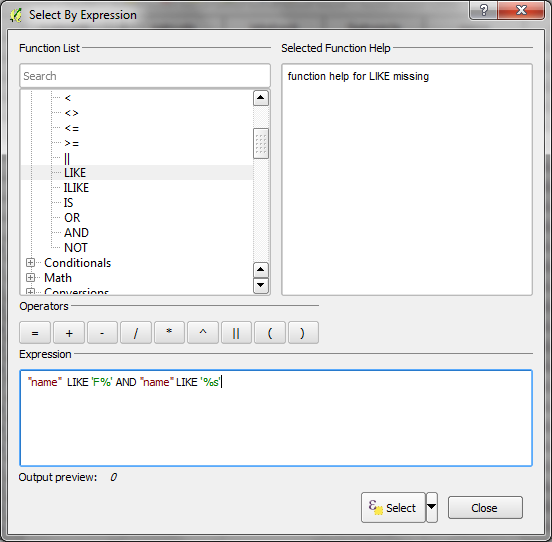
- Now in the expression box using single quotations type 'F%'. The % symbol represents a wildcard. This means that any number of combinations of letters behind the letter F is acceptable in the selection. The % symbol can be typed on manually or selected through the Operators tab.
- Now using the operators tab again select AND or type it in manually. This will allow two queries to be strung together.
- Now you can type this in manually with quotations around it or go back to the Field and Values tab and double clickName again.
- Now back to the operators tab or type in Manually LIKE
- After the LIKE now type in manually '%S'. Here we put the wildcard before the S because we want to select any number or combination of letters, only ending in S.
- The query expression should look like this:
- After clicking Select the selected features will appear highlighted on your Attribute table.
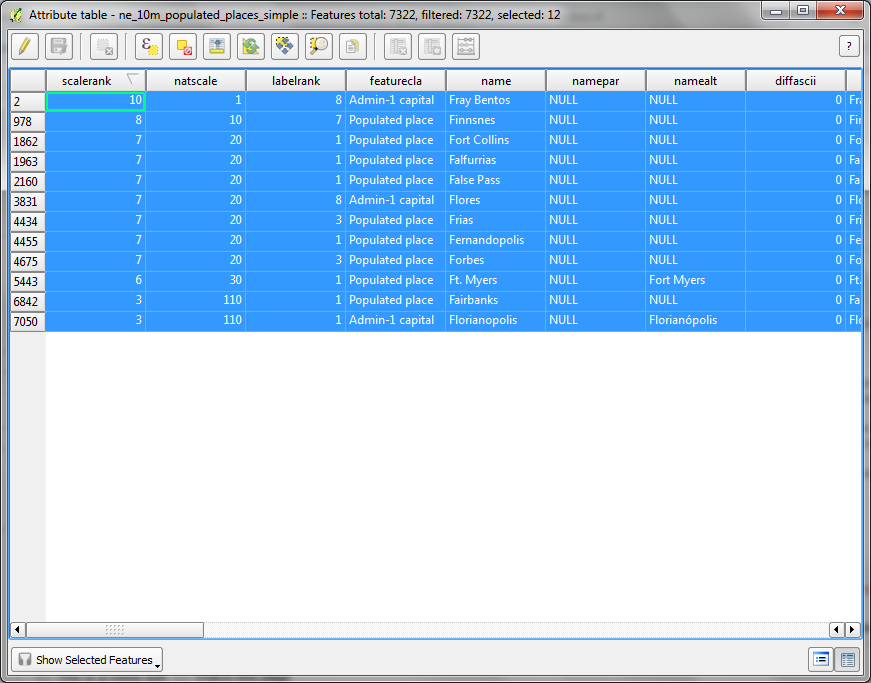
- The following image shows that there were 12 out of the 7322 feature names that started with the letter F and ended in the letter S.
Querying Extras
For more information and example of different queries to run in QGIS visit the following links:
- For specific information on the QGIS Query Builder click here
- For other examples of how to build query expressions click here
- For an explanation of all the different operations click here
- For run through of querying using a YouTube tutorial click here
Resources
ArcGIS Resources (October 25, 2012). ArcGIS Help 10.1:Building a query Expression. Retrieved on December 17, 2013 from http://resources.arcgis.com/en/help/main/10.1/index.html#//00s50000002t000000
GeoInformation. (January 13, 2013). Tips and tutorials on working with GIS: Queries in QGIS. Retrieved on December 18, 2013 from http://infogeoblog.wordpress.com/2013/01/13/queries-in-qgis-pt-1-attribute-queries/
Harvard CGA (November 28, 2011). QGIS 5-Attribute Query [Video File] Retrieved on December 18, 2013 from http://www.youtube.com/watch?v=jRV6b_pd_PE
Natural Earth. (2013). Natural Earth: Populated Places. Retrieved November 19, 2013, from http://www.naturalearthdata.com/downloads/10m-cultural-vectors/10m-populated-places/.
NOAA. (November, 2013). The Significant Earthquake Database. Retrieved November 19, 2013, from http://www.ngdc.noaa.gov/nndc/struts/form?t=101650&s=1&d=1
QGIS. (2013) Download QGIS for your Platform. Retrieved on November 14, 2013 from http://www.qgis.org/en/site/forusers/download.html
QGIS. (2013). Features of QGIS. Retrieved on December 16, 2013 from http://www.qgis.org/en/site/about/features.html
QGIS. (December 15,2013). QGIS: A free and Open Source Geographic Information System. Retrieved December 16,2013, from http://www.qgis.org/en/site/index.html
QGIS. (2013). Query Builder. Retrieved on December 17, 2013 from http://www.qgis.org/en/docs/user_manual/working_with_vector/query_builder.html


