Exploring the Thematic Capabilities of OpenJump
Contents
Purpose
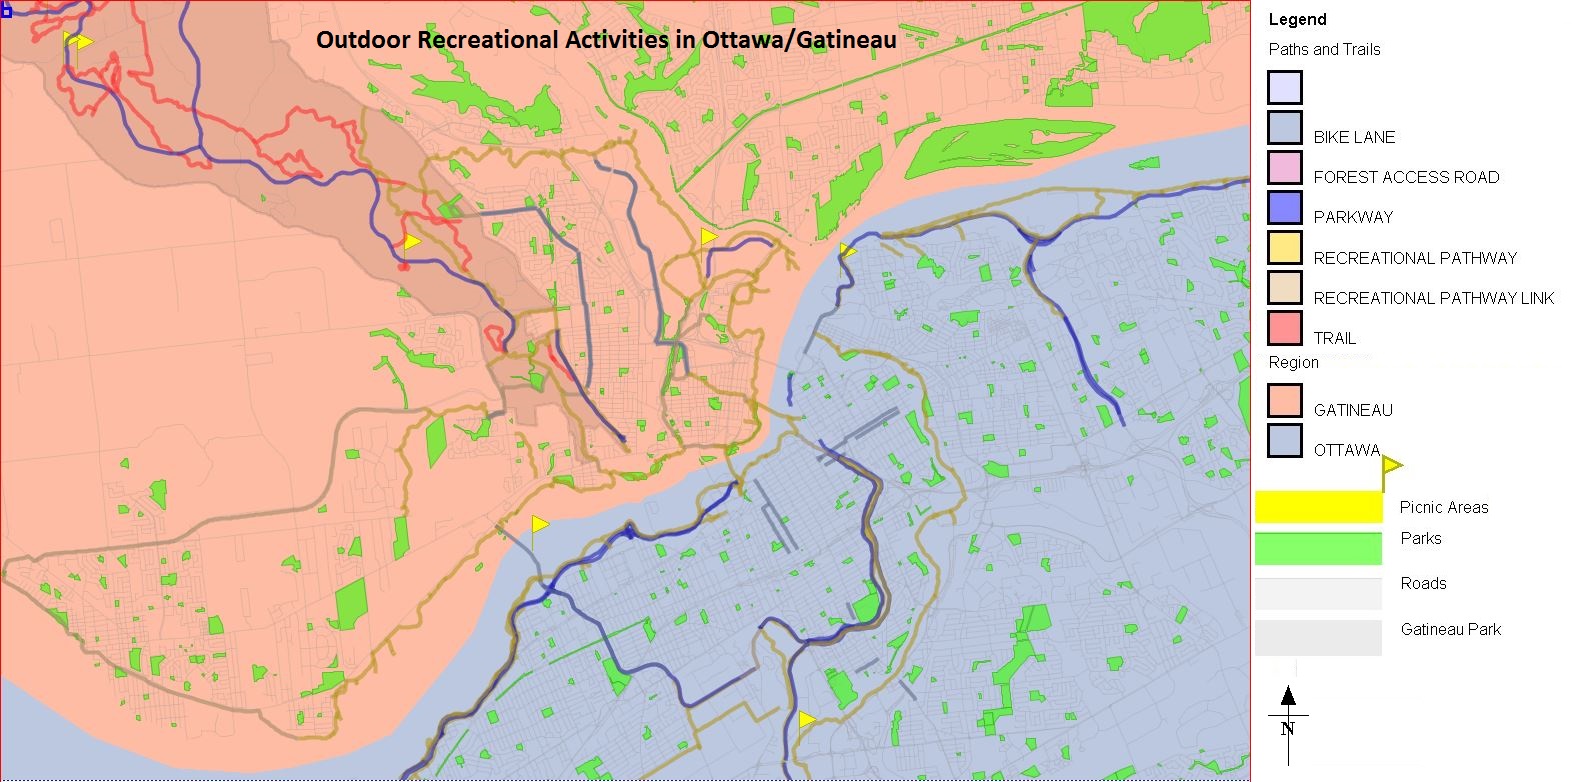
The purpose of the tutorial will be to demonstrate the thematic capabilities of the open software called OpenJump. It will demonstrate some of the strengths of the program to alter data looking at how it displays data, change the style of attributes, and the symbology you can access. These capabilities will be shown through the creation of a thematic map that shows the Outdoor Recreational Activities that Ottawa and Gatineau have to offer. After learning how to create a thematic map by altering data, hopefully it can help either students or employers decide if they want to use this free program to edit their maps, as a potential alternative or complement to proprietary software such as ArcGIS.
Introduction
OpenJump is an open source Geographic Information System that has been created by volunteers around the world. The program is capable of analyzing shapefiles, simple GML files, and then displays their images. The particular strength of this program is its ability to edit geometry and attribute data which this tutorial will demonstrate. Using datasets provided from the MacOdrum Library database, this tutorial will use data that can be easily understood and displayed on the program to show altering and editing capabilities. This tutorial will create a thematic map that will show the variety of outdoor recreational activities in the Ottawa and Gatineau region. This will be done by using data provided by the City of Ottawa, National Capital Commission, and the Rideau Valley Conservation Authority Thematic Data. These files have provided a number of geospatial datasets that include activities, assets, biophysical, boundaries, mapping, and planning.
Methods
Getting Started
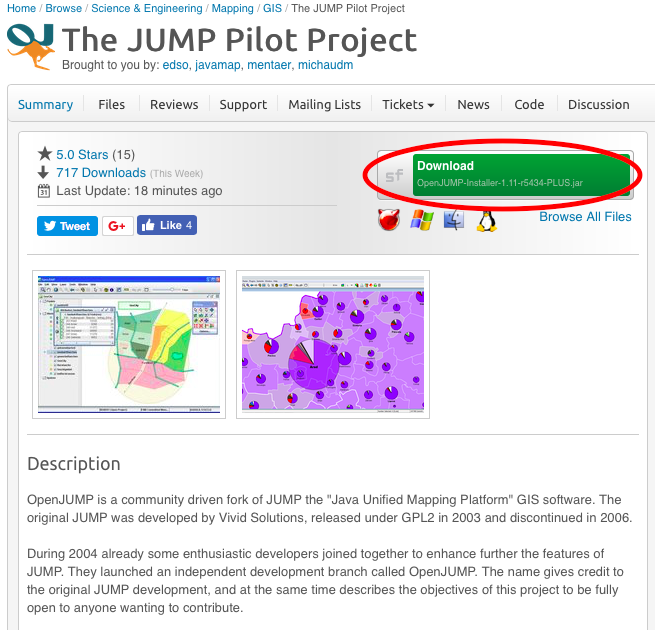
The first step of this tutorial will to first download the software Open Jump. OpenJump can be downloaded HERE
Figure 1. The red circle shows where you can click to download the software and all of its packages
Collecting the Data
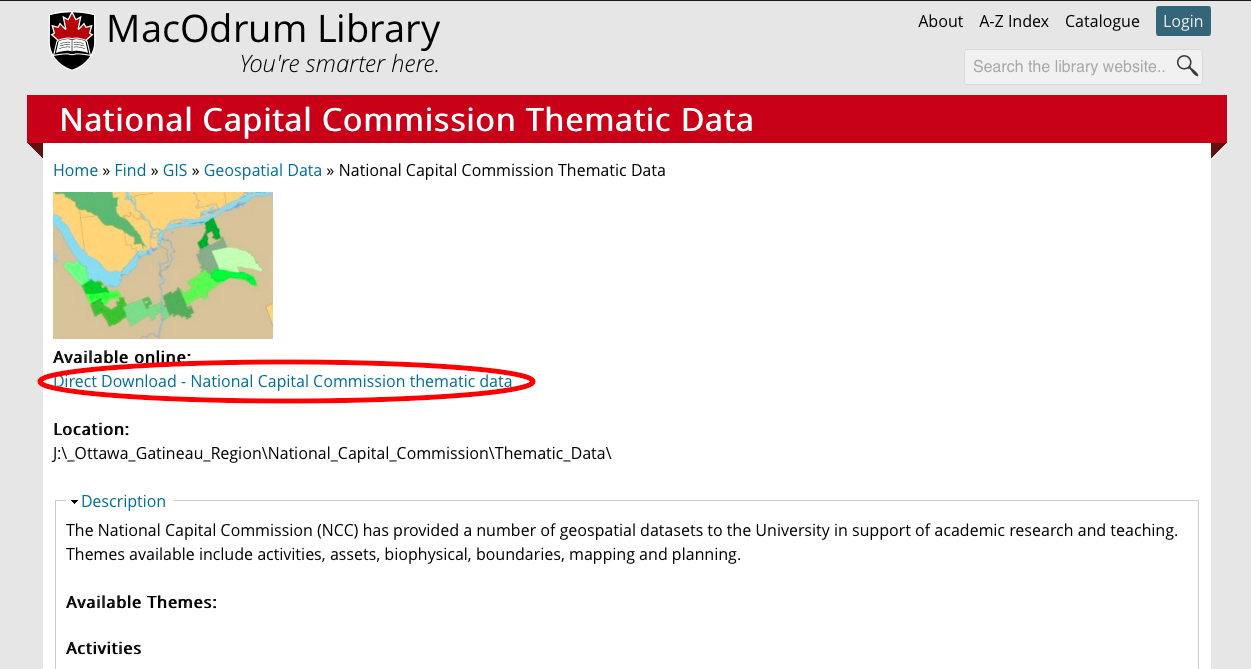
The data that will be used for this tutorial is provided from the National Capital Commission which can be found on the MacOdrum Library website. The download method used in this tutorial is only available to those affiliated with Carleton University. The data can be found HERE for download.
Figure 2. This is where you can access the information used in this tutorial
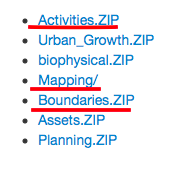
Not all of the data in this dataset will be needed for this tutorial. Select Activities and Boundaries to download those portions of the dataset, as shown in Figure 3, below. Then, select Mapping to view the data available in that section, and select CanMap to download the file, as shown in Figure 4.
Figure 3. The datasets that need to be downloaded are underlined in red.
Figure 4. The dataset from the Mapping folder that needs to be downloaded.
Accessing the data
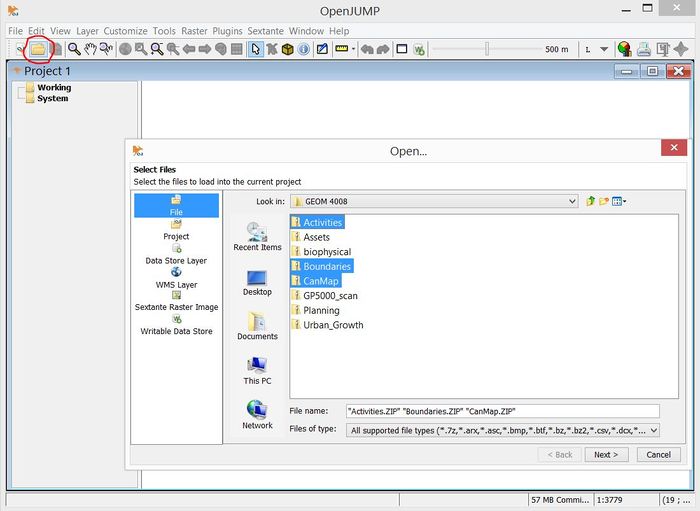
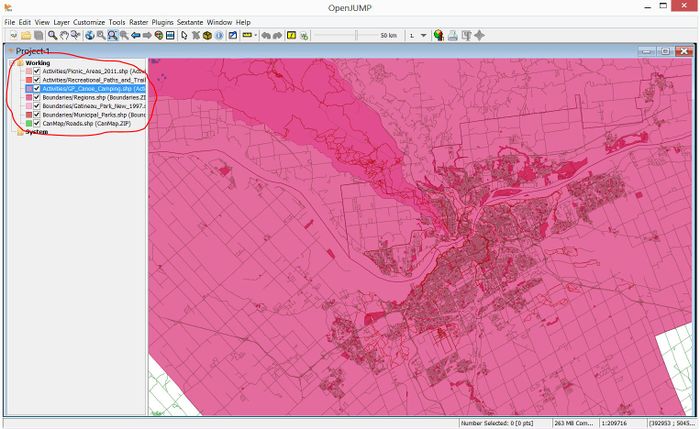
Open up OpenJump, then click on the file in the top left corner of the screen and then locate the downloaded files provided from the National Capital Commission. For this tutorial only the select few layers will be needed: Activities, Boundaries, and CanMap.
Figure 3. The red circle shows where you need to click in order to open and find the files, selecting Activities, Boundaries, and CanMap
From this step on, you will need to select the files that this tutorial will use to edit which are:
Activities:
- Picnic Areas
- Recreation, Paths, and Trails
Boundaries:
- Regions
- Gatineau Park
- Municipal Parks
CanMap
- Roads
Figure 4. This image shows the files that should be selected on the left, and on the right is an image of what the data should will like (Colours may vary)
Altering Data
From this step further, the data will have to be altered to help people understand the map, and show some of the program's strengths. The downloaded data are a bit confusing to grasp at first, but with a little bit of editing, it is possible to transform them into something that can be shared for academic use.
- Changing the Style
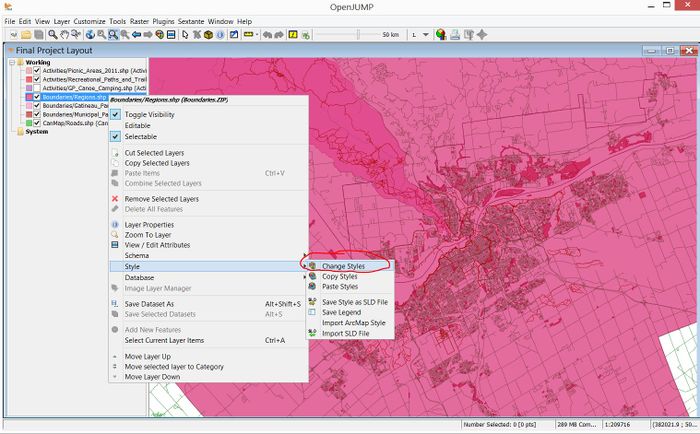
- In order to change the colours of certain layers, you can right click the layer of choice> Click on "Stlye"> then click on "Change Styles". This then opens up a window in which you can edit the properties.
Figure 5. Image depicts how to access the change styles window to edit
- Changing the Style Part 2
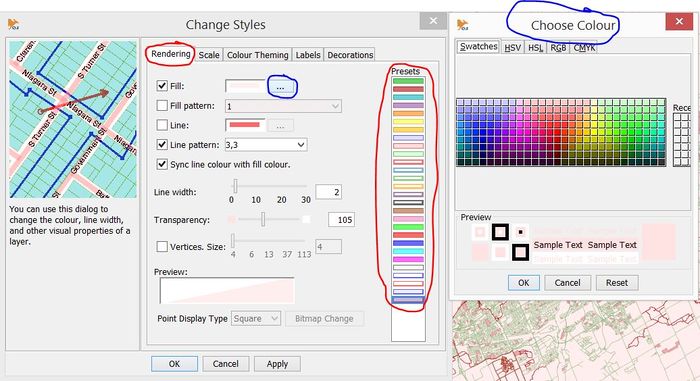
- With the Change Styles Window open you are free to select a variety of different colours, styles, patterns. All of this can be accomplished under the "Rendering" tab. For each data layer appropriate colours will be selected to form an easily read map.
Figure 6. Rendering is where you can alter the colours of selected layers, on the right of the rendering window there is a variety of pre-set colours to choose from, but if those colours do not satisfy yours taste, then by clicking on the three dots that are circled in blue in the image-a colour palette appears that allows you to select a larger range of colours.
- Making More Data Appear
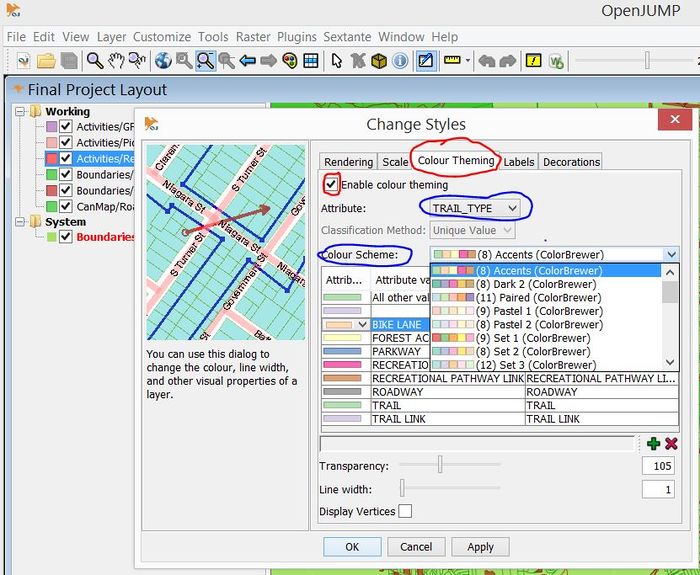
- Currently not all the available data to make an appropriate map for outdoor recreation are displayed on the map. This can easily be changed by selecting what features you want to be displayed. Again by right clicking on the layer you wish to edit, open the "Change Style" window again, but this time instead of selecting Rendering, "Colour Theming" will be selected. From this step, select "Enable Colour Theming", then under Attribute select the theme you would like to be displayed. There are a variety of different themes that OpenJump offers, some of the names are called Accents. Dark 2, Paired, etc. Select the colour theme you wish to be displayed to represent your attribute, or individually select the colours you want by clicking on the colour beside the selected attribute value.
Figure 7. Colour Theming allows the user to show the variety of attributes a layer has in it. Make sure the colour theming box is checked to access it(Red). The Blue shows the variety of attributes you can select and the colour schemes that the program offers.
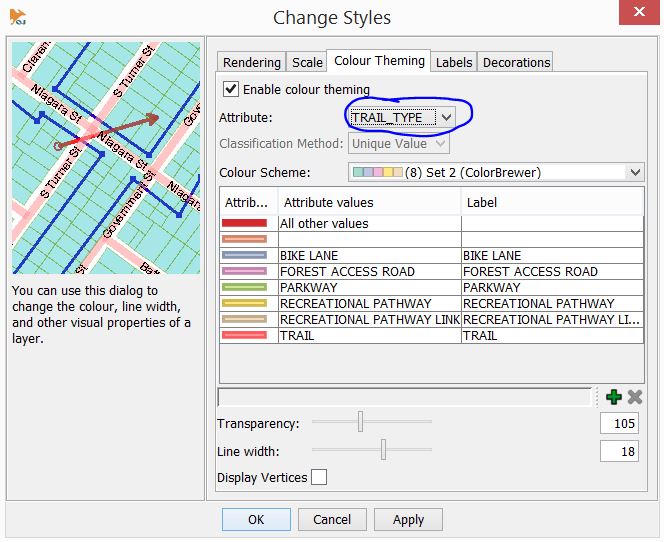
The attributes that will be represented in this tutorial is Trail_Type found in the Activities/Recreation_Paths_and_Trails layer.
Figure 8. Image that shows what attributes were chosen for the final thematic map
- Editing the Data
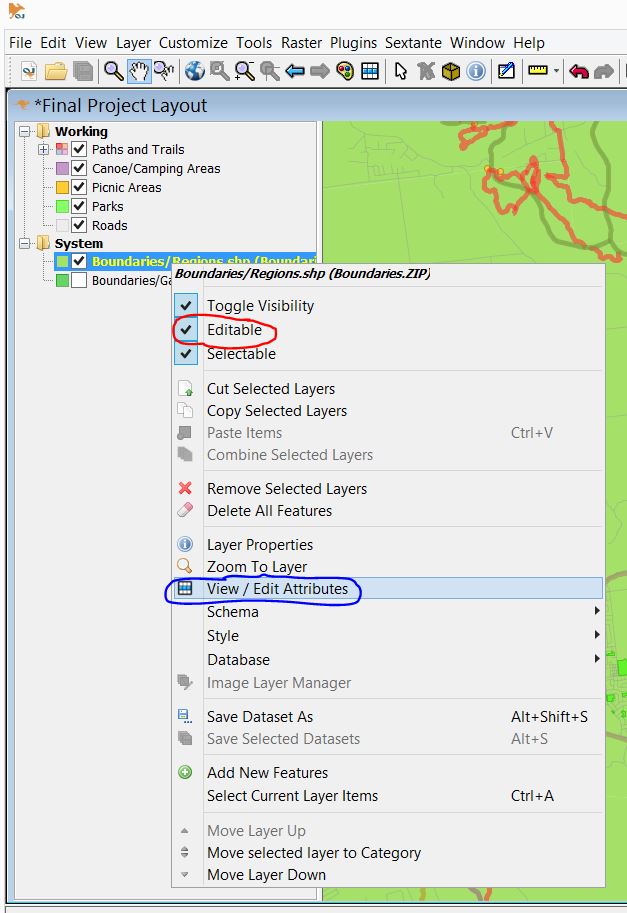
- OpenJump lets you alter the downloadable data to whatever fits your needs. So if you obtain new up to date information you can actually change/update the data. It is even possibler to add your own point of interest for whatever needs you may have. For this exercise, we will show you how to edit this information. First you need to right click on the layer you wish to edit>select editable> then open up the attribute of the select layer you wish you wish to change. For this exercise, to show how to edit data in the attirbute table, we are going to edit the Boundaries/Regions layer. Currently there are three attributes shown in the field AGENCY; GATINEAU, OTTAWA, and MRC. For the purpose of this tutorial only want to show Ottawa and Gatineau, so we are going to replace MCR with Gatineau so that there are only two main boundaries.
Figure 9. Red shows that editable should be selected on the layer to edit the attribute data, and the blue shows where to access and change the layers attribute data.
- Editing the Data Part 2
- In order to actually edit the data you need to double click on the data you wish to change, delete what is currently there, and put in the information you wish to display. Since we only want 2 attribute data categories to be shown on the map, we are going to change MRC to Gatineau. Note: All of the spelling and capitalization needs to stay the same or else the program will not recognize it. So in this case make sure that when you write in Gatineau that it is all capitalized (GATINEAU).
Figure 10. This left image depicts what the attribute data looked like before, on the right is what it looked like after.
To make the two different boundaries appear, follow the same steps in "Making More Data Appear".
Symbology
- Changing Symbology
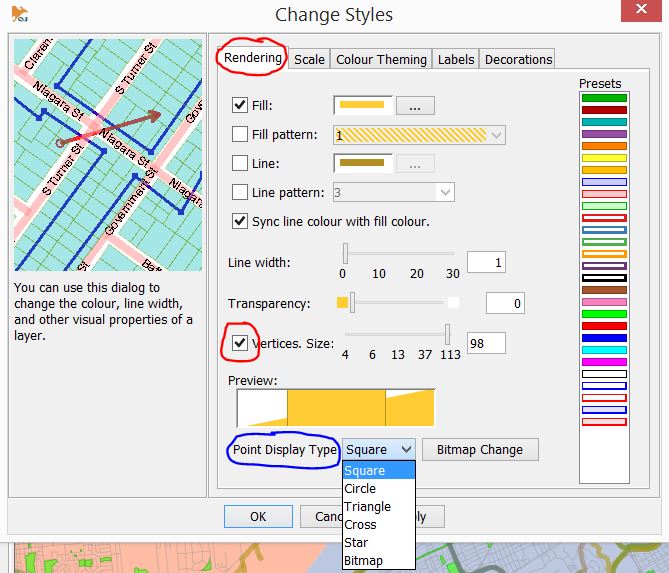
- To change the symbology of certain images it is easy to do so in the "Change Style" window of any layer. In the "Rendering" window, check the box that is labelled "Vertices Size". This will then allow you to change any point shapefiles to a select few shapes including: Square, Circle, Triangle, Cross, Star, and Bitmap. Bitmap is special as it allows the user to select an image they wish to represent for the data and can make it appear on the map.
Figure 11. Shows where in Openjump you can change the appearance of point data. The program uses very simple shapes.
- Changing Symbology Part 2
- If the selected symbology from part 1 does not meet the needs of your data, the program also offers a few other option to represent data using the "VertexSymbolPlugin" tool. This tool can be accessed in the top right corner of the program. To select the layer you want to represent, make sure that the layer is in editable mode. In this tool there are two categories you can select symbology from: Vector and WKT Shapefile. Choose whatever symbol represents your desired layout.
Figure 12. Shows the variety of different symbology you can choose from in Open Jump looking at the Vector and WKT shapes.
Final Image
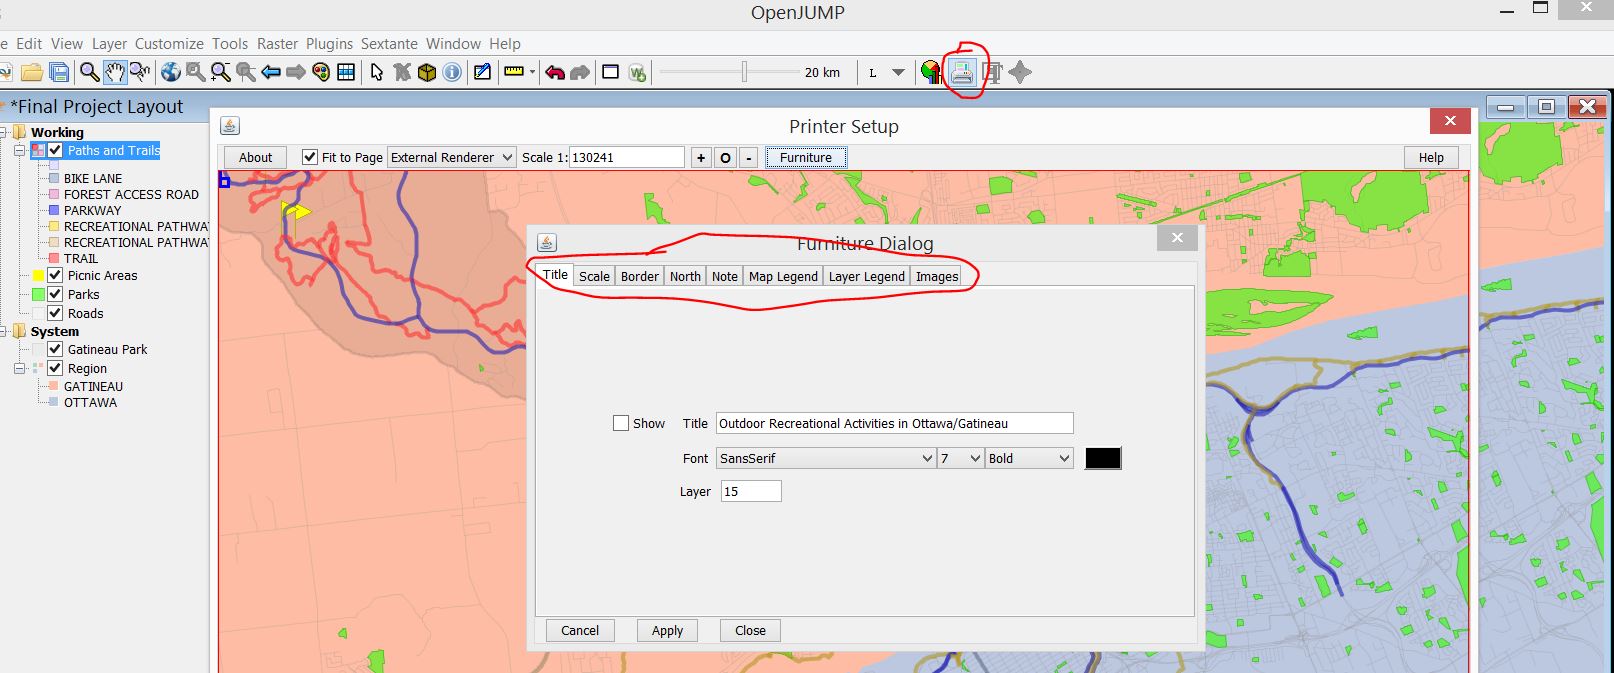
Now that some of the software simple features have been shown and how to use/edit data, it is possible to create the final map.The program has its own layout view where you can edit and make the map appear however you want. In the top right corner of the screen there is an option called "printer". After printer has been selected it is possible to add titles, scales, borders, north arrows, notes, legend, and images (Figure 13). Format the map however you want to your liking until you are happy with your results (Figure 14). Tip: Names of layers can be changed by double clicking on them.
Figure 13. Shows where you can access printer and the different options you can access to change the layout of your map.
Figure 14. The final map created with this tutorial: Map that shows the outdoor recreational activities that Ottawa and Gatineau have to offer.
Conclusion
You have now learned how to successfully alter data in OpenJump and create a thematic map. There are so many other functions that this program has to offer and you can explore, which include processes such as digitization, using the programs multiple tools including queries, analysis, statistics, and more. After realizing some of the capabilities of this program, hopefully students and employers can decide if they would want to use a free software such as this, or pay for an proprietary package such as ArcMap. Either way, this program does an amazing job at editing data.
