Generating Wetness Indices for Watersheds in GRASS
GENERATING WETNESS INDICES FOR WATERSHEDS IN GRASS
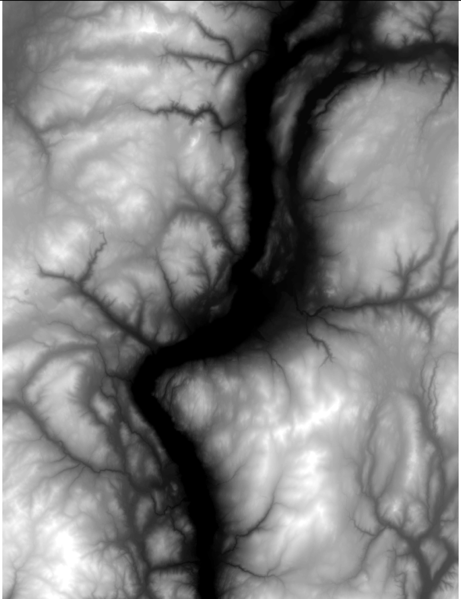
This tutorial will illustrate the processes involved in generating a topological wetness index from a digital elevation model using GRASS modules through Quantum GIS. Each step involved in generating a wetness index for a watershed will de explained, and example maps from a sample analysis will be provided. In the sample analysis, a wetness index was generated for the Carp River watershed in Ottawa, Ontario using a DEM of the Ottawa-Gatineau region (Fig.1).
Once the DEM is loaded in QGIS, create a GRASS mapset with an appropriate projection and workplace extent. Using r.in.gdal.qgis, import the DEM into the new mapset.
1.0 BACKGROUND INFORMATION:
In hydrology, a watershed refers to an area of land in which all the precipitation runoff drains into a common waterway, such as a lake, river, or ocean. Therefore, drainage basins act as natural funnels, collecting the precipitation that lands within their borders, and directing it into the common waterway outlet. Watersheds are arranged in hierarchical order, where the size of a given watershed is determined by the location of its outlet. Therefore, as the outlet of the watershed moves downstream the watershed becomes larger, and consists of more sub-watersheds. In hydrology, watersheds are extremely important since they delineate regions that contribute to flow in a given waterway.
Wetness indices are used to describe spatial moisture patterns within a given region. They are calculated based on a region’s contributing upslope area and slope, where areas with low slope and large contributing area are expected to be relatively wet and areas with high slope and small contributing area are expected to be relatively dry. When a wetness index is calculated for a given region, the index should be calculated for the entire watershed in which that region is located, in order to ensure flow accumulation accuracy. In the sample analysis, wetness index was calculated for the Carp watershed based on [WetnessIndex=ln(A/tan(B))] where A represents the upslope contributing area and B represents slope.
2.0 GENERATING WATERSHED BOUNDARIES:
In order to identify the spatial extent of the watershed of interest, use r.watershed to generate an image of watershed boundaries across the DEM. The r.watershed module uses the DEM and a threshold parameter as input. In this case, the threshold parameter refers to the minimum size in cells a watershed must be for it to be delineated. It may take some experimentation to acquire a proper threshold parameter that will produce watershed boundaries that correspond with the watershed outlet that was chosen in your research.
Once the watershed boundaries are output, use them to focus the GRASS extent around the watershed of study (Fig.2). This will reduce processing times and eliminate extraneous data from calculations and visual representation.
In the sample analysis, watershed boundaries were delineated based on [r.watershed elevation=DEM threshold=10000 basin=Watersheds]
