Difference between revisions of "Introducing Geoprocessing Capabilities of SAGA in R Environment using RSAGA (Saga + Rstudio)"
| Line 219: | Line 219: | ||
=====Analytical Hillshading===== |
=====Analytical Hillshading===== |
||
| + | |||
| + | |||
| + | |||
| + | |||
| + | |||
| + | [[File:HillShading.png|1000px|]] |
||
| + | |||
| + | |||
| + | |||
| + | |||
| + | [[File:RHillshade.JPG|600px|centre]] |
||
| + | |||
| + | |||
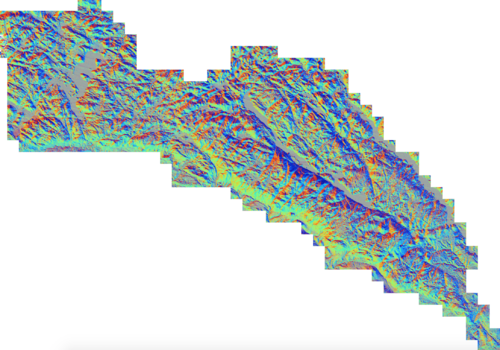
| + | <div align="center">Figure13. Analytical HillShading.''</div> |
||
| + | |||
| + | |||
| + | |||
| + | |||
| + | |||
| + | |||
| + | |||
| + | |||
| + | |||
| + | |||
| + | |||
| + | '''NOTE : setting up a SAGA geoprocessing environment as created by rsaga.env for further arguments to rsaga.geoprocessor in this case we have rsaga.env as env = env ''' |
||
==Original R Script == |
==Original R Script == |
||
Revision as of 03:24, 20 December 2015
Contents
Purpose
This Wikipage has been created for GEOM4008 Class - Advanced Topics in Geographic Information Systems class at Carleton University. The main purpose of this tutorial is to introduce and familiarize future users to understand the computing geoprocessing commands in the R environment and while utilizing the SAGA-GIS platform. In this particular tutorial we will be attempting to work with Terrain Analysis modules on our area of interest - The Gatineau Park located in Ontario, Canada.
Objective
The objective of this tutorial would be to establish an understanding of using the geoprocessing tools by calling functions out between Rstudio and SAGA - RSAGA using R scripted commands.
Softwares Introduction
Rstudio
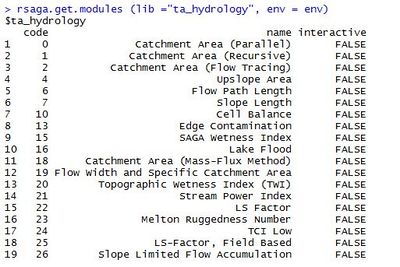
This is an open software program deals with its own scripting language that is often used for data analysis, statistics and graphing of very large datasets. It also has the power to perform 69 modules as seen below, users are able to use spatial data such as DEM or Excel files to manipulate and perform geoprocessing via special commands within this software. The more you explore and use the commands the more comfortable you will get. Initially everyone feels the difficulty however, if the basics are understood well, it eases major geoprocessing tools. R studio is known for handling large datasets with efficiency and helps in optimizing results quicker in order to perform them multiple times at a time without the needs to run through the steps again and again. Also, R not only processes data but if users may want to visualize their spatial output of their data, R has a package called (sp) which has that feature.
Saga
System for Automated Geoscientific Analyses - is a Geographic Information System (GIS) software with immense capabilities for geodata processing and analysis. Functions are organised as modules in framework independent Module Libraries and can be accessed via SAGA’s Graphical User Interface (GUI) or various scripting environments such python or Rstudio.
Data Setup
DEM
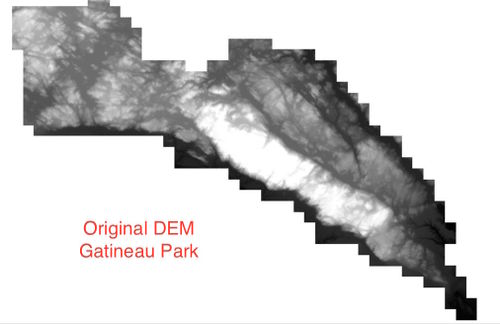
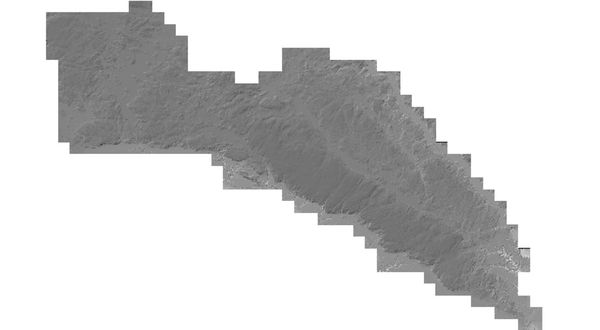
The above DEM of Gatineau Parking Located in Ontario, Canada is our area of interest for this tutorial. The specifications of this DEM - it is a 5 meter DEM which hold to be best for visualizing Terrain.It also is very useful when trying out 3D representation of a terrain's surface. Therefore, the user may consider going as far as 10 meter however, it is recommended the smaller the better for accuracy and interpretation.
Date Usage
Permission & Licence Agreement From
Please follow the step below in order to access the data or be able to use it
1) To use the same data as shown in this tutorial the user would need to be from Carleton university and currently enrolled in a program.
2) They need to sign GIS Data Use Agreement prior to use, which is compliant with our data license with the NCC. To share the data otherwise (even between students) would contravene the license.
3) For any other support Rebecca Bartlett is GIS and Digital Resources Librarian who could provide further assistance to Carleton students.
4) It is very important the user understands the legal considering behind using the 5mDEM of Gatineau Park.
5) Lastly, if any user who could be categorized as a non-Carleton student, would need to directly ask the NCC for further data permissions.
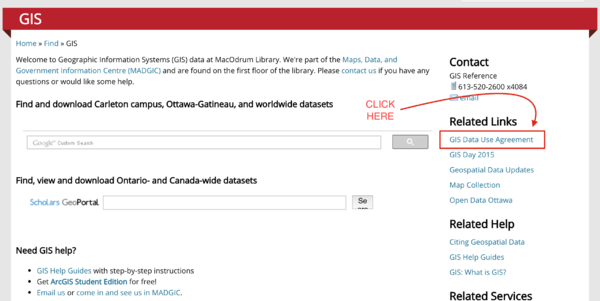
How to Sign the Agreement
Go to - https://library.carleton.ca/find/gis ( copy and paste link in URL)
To the righthand side of the website
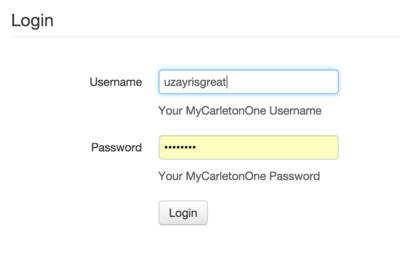
User needs to sign in with their Carleton username and password
Understanding Basic R Environment
To begin this tutorial, the author understands or predicts the user has prior knowledge or understanding of how Rstudio commands and environment setup works.
However, if the user feels they are not familiar they are welcome to check an introductory tutorial below in the link by Julia Riddick.
http://gracilis.carleton.ca/CUOSGwiki/index.php/R_Studio%27s_Spatial_Capabilities
Rsaga Tutorial
Before we being the tutorial we need to prepare both the software so there is a connection between them. As you already know the core of this tutorial is to teach the user on how geoprocessing of SAGA performs in R using its Environment via scripting.
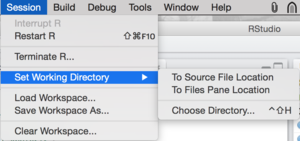
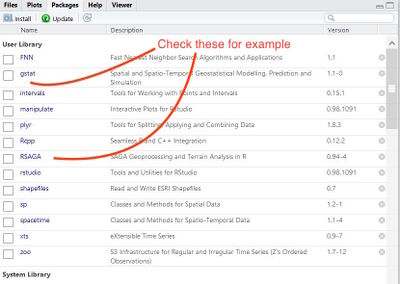
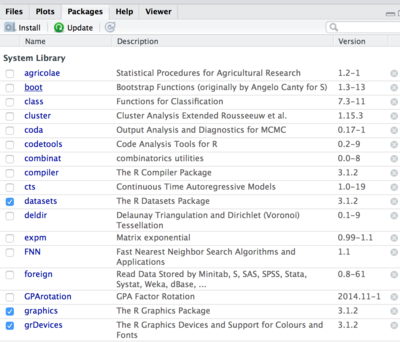
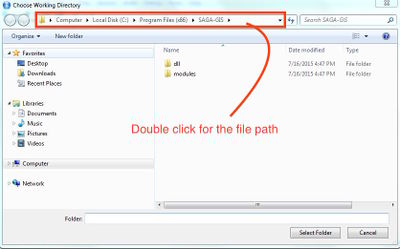
Set up RSAGA
Note: If none of these two above step work and result in error, you might want to check your command setup again, it usually varies between the users computer setup. However,it is ok you can still proceed to next step.
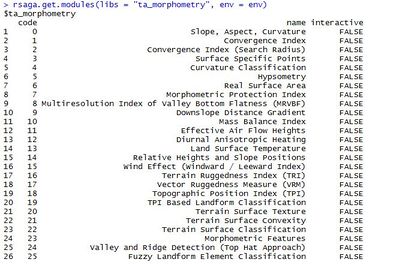
The earlier library command in Step 3 should do the work to call out all modules.
GeoProcessing Using Rsaga
Slope
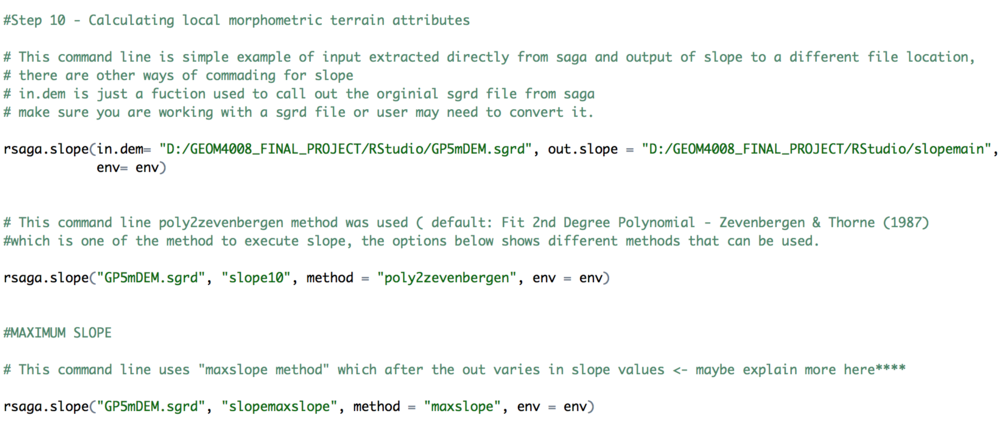
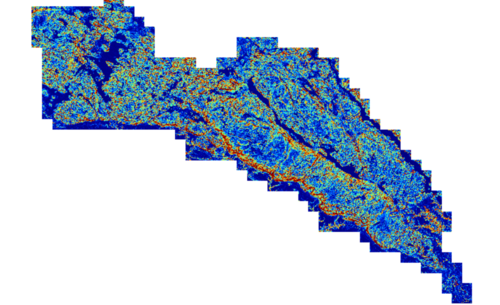
Result :
Just some options you can use from below :
- Maximum Slope - Travis et al. (1975) ("maxslope", or 0)
- Max. Triangle Slope - Tarboton (1997) ("maxtriangleslope", or 1)
- Least Squares Fit Plane - Costa-Cabral and Burgess (1996) ("lsqfitplane", or 2)
- Fit 2nd Degree Polynomial - Bauer et al. (1985) ("poly2bauer", or 3)
- Fit 2nd Degree Polynomial - Heerdegen and Beran (1982) ("poly2heerdegen", or 4)
- Default: Fit 2nd Degree Polynomial - Zevenbergen and Thorne (1987) ("poly2zevenbergen", or 5)
- Fit 3rd Degree Polynomial - Haralick (1983) ("poly3haralick", or 6).
In this tutorial the default option was choosen : poly2zevenbergen for slope and later then Max slope was attempted as seen above in my R command script
Aspect
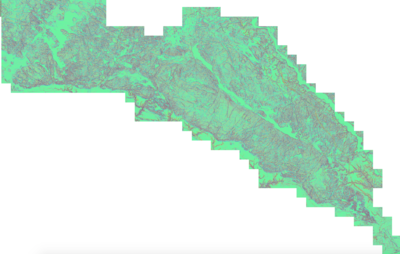
Result:
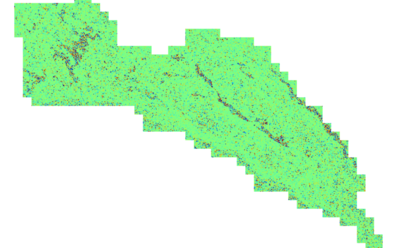
Profile & Plain Curvature
Result :
Multi Geoprocess R Command Script
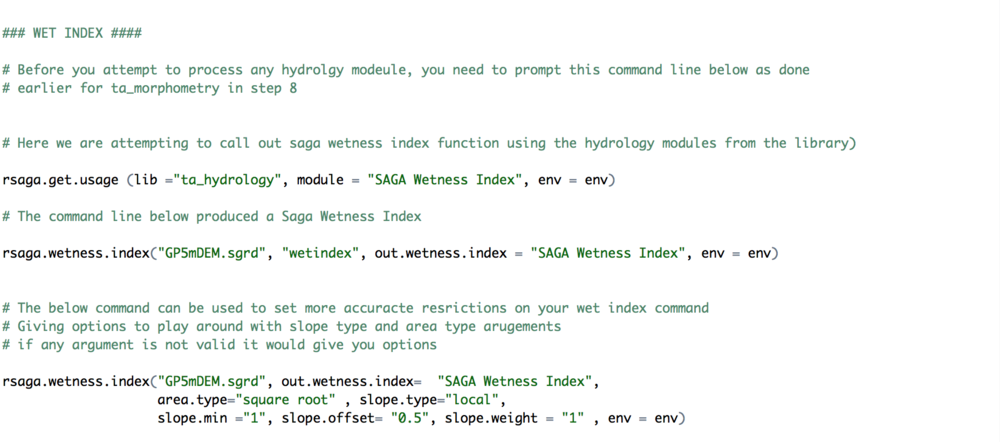
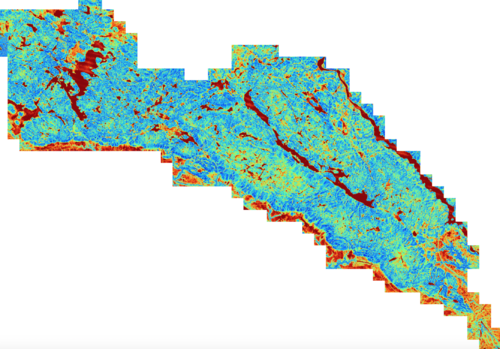
Wet index
Result:
Analytical Hillshading
NOTE : setting up a SAGA geoprocessing environment as created by rsaga.env for further arguments to rsaga.geoprocessor in this case we have rsaga.env as env = env
Original R Script
Conclusion
In conclusion, both the softwares successfully got connected which is the first and most important step of this RSAGA tutorial. Once that has been setup, having the knowledge of R commands can be useful to perform many other geoprocessing tools using different modules, depending on the goal and the type of data the user might have. This tutorial would definitely help users who plan to work with large data sets. As Rstudio being a very powerful software - RSAGA package within that manages to perform many geoprocessing on large datasets much quickly, saving users time and it's free of cost. The feasibility and commonality of R scripting makes it much more encouraging and persuasive for users with both python scripting background or no coding background to get started. This tutorial definitely fills the gap of sharing a quick step by step knowledge base for future users or Carleton students to perform their geoprocessing tasks much efficiently.
Refrences
http://www.ijesit.com/Volume%202/Issue%201/IJESIT201301_38.pdf
http://sourceforge.net/projects/saga-gis/
https://cran.r-project.org/web/packages/RSAGA/vignettes/RSAGA-landslides.pdf
http://www.colorado.edu/geography/class_homepages/geog_4203_s08/class6_TerrainAnSlopeAspect.pdf

