Network Analysis Plugins in QGIS, What (and How) to Use
Contents
Introduction and Purpose
Network analysis is a common GIS application with real-world uses ranging from determining the most efficient routes for delivering goods to the best location for a transit hub. This tutorial is catered to those who are familiar with QGIS operations.
QGIS
Quantum GIS, commonly referred to as QGIS, is an open source software that boasts a great number of tools and functions to complete various geospatial operations. It is maintained and updated through its large volunteer community, and there are a wealth of online resources available on the QGIS site and the associated documentation page which contains resources like help manuals
APIs
API stands for Application Programming Interface. APIs allow two softwares to communicate with each other. In this tutorial, APIs enable plugins to access different data and tools to conduct network analyses. The reason many of the plugins do not require a local data download to conduct operations (see table under Plugins) is because they are access data from an external server through an API. For more information on APIs, feel free to visit the AWS API resource page.
Learning Outcomes
After completing this tutorial, you will know how to:
- Install a plugin on QGIS
- Register for HERE and TravelTalk APIs
- Conduct Point-to-point network analysis using QNEAT3, Online Routing Mapper, TravelTime, and Hqgis
- Do Service Area calculations with QNEAT3, TravelTime, and Hqgis
- Geocode addresses using TravelTime and Hqgis
- Run a POI search with Hqgis
Plugins
Several plugins have been created to support or enhance the functionality of QGIS. Each plugin has different benefits and limitations, so be sure to familiarize yourself with your project to make sure you make the right selection. For example, using an API may be preferred to reduce processing times as calculations are being completed on external servers. On the other hand, you will have to plan ahead to use APIs that require accounts to generate permission keys, as it can take some time for your account to gain access. The table below shows the different functions each plugin offers to help with your selection. For more information on a particular plugin, click the embedded link.
| Plugin | Local Data Required? | Functions | API Login required? | Notes |
|---|---|---|---|---|
| QNEAT3 | Yes | Point-to-point routing, Service Area calculation, Origin-Destination matrix | No | Origin-Destination matrix does not generate |
| Online Routing Mapper | No | Point-to-point routing | No | Only HERE and TomTom APIs remain supported |
| TravelTime | No | Point-to-point routing, Service Area calculation, Geocoding | Yes | Slow API account validation, limited number of data queries on free account |
| Hqgis | No | Point-to-point routing, Service Area calculation, Geocoding, POI search | Yes | Limited number of API keys generated for each project |
Tutorial
QGIS
This tutorial uses QGIS, if you have yet to install the software, follow this link to do so. This tutorial uses QGIS 3.32. Select the version you wish to download based on your operating system, and follow the guide that is installed in the package. Once QGIS is installed, launch the application to begin the tutorial.
Installing Plugins
There are many plugins available in QGIS, but they must be installed before you can use them.
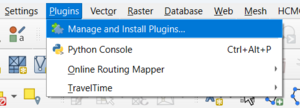
- To access plugins, click the Plugins tab in the menu, then select Manage and Install Plugins... This will open a pop-up window.
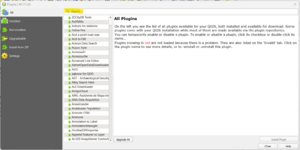
- At the top of the new window, you will see a search bar (highlighted in yellow), and a list of all available plugins below it.
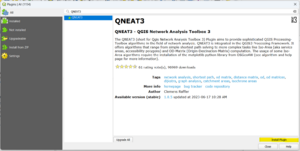
- Search for QNEAT3 using the search bar, and select the result. A brief description will appear in the right hand side of the window. Next, click the Install Plugin button (highlighted in yellow) to install.
- Repeat this process for the Online Routing Mapper, TravelTime, and Hqgis plugins.
QNEAT3
QNEAT3 is similar to the default network analysis tools in QGIS, as both are able to do point-to-point routing, do service area calculations, and require a network file to either of these analyses. However, QNEAT3 offers a different visualization of the outputs, with routes extending off the network if the start or end point lies outside the network, and showing service areas as either contours, polygons, pointclouds, or buffers, while the default QGIS tool depicts the service area by highlighted network segments within the area.
Data
The data used in this tutorial is the Trois-Rivières road network found using the Government of Canada's Open Government Portal by searching for "road network". It can be found and downloaded by following this link and selecting the SHP file option. *image of govt geoportal
- Extract the downloaded .zip file into your project folder and load the data into QGIS. insert pic?
Point-to-point routing
- To access QNEAT's tools, click on the gear (Toolbox) icon in the top right corner of your QGIS window (marked in red). This will open the Processing Toolbox tab on the left side of your screen. insert tb_1
- In the Processing Toolbox search bar, type "QNEAT3". Click on the drop-down arrow next to the result (highlighted in yellow) to see all of the tools available with the plugin. insert tb2
- Under Routing, double click on Shortest path (point to point) to open a pop-up window.
- Ensure that the Trois-Rivières road network is selected as your Network Layer (shown in yellow). To select your Start and End points, click on the three dots (shown in red). These will allow you to use your mouse to browse the area, simply select your points by clicking on the desired location. insert qn_sp
- Once this is complete, hit Run in the bottom right corner and wait for the operation to complete.
- The output will be a line that connects the two selected points that follows the network, though it may start or end off the network if the points lie off-network. insert qn_pp_2
Service Area calculation
- For Service Area calculation using QNEAT3, follow the first three steps listed under Point-to-point routing, but double click on Iso-Areas as Contours (from Point) instead of Shortest path
- In the pop-up window, ensure that the Trois-Rivières road network is selected as your Network Layer (shown in yellow). To select your Start point, click on the three dots (shown in red). This will allow you to use your mouse to browse the area, simply select your point by clicking on the desired location. insert qn_sa1
- Under Optimization Criterion, select either Shortest Path or Fastest Path. This will determine whether your service area will be defined by travel time or travel distance.
- Once this is complete, set the Size of Iso-Area. This determines the total size of the area and is expressed in cost units. In this tutorial, the default of 2500 distance cost units was used.
- Use the contour interval to determine the size of division of the Iso-Area. If you want to communicate what distance can be reached in 5, 10, and 30 minutes of driving, you would do that here. The default of 500 distance cost units was used for this tutorial.
- When you have filled in all your inputs, click Run in the bottom right corner and wait for the operation to complete.
- The output will be a layer of lines delineating the extent of each cost interval and an interpolated raster layer that shows the cost of network travel at each location. insert qn_sa2
Online Routing Mapper
Online Routing Mapper uses several APIs to conduct point-to-point routing, making it very useful for quick but simple analyses. Unfortunately several APIs no longer seem to be supported by the plugin or require additional registration to use, meaning that only the TomTom and HERE routing APIs currently generate results.
Point-to-point routing
- When you install the Online Routing Mapper plugin in QGIS, it automatically adds a button your page for quick access. It resembles a green cloud adorned with arrows, and can be found in the top right corner. insert orm1
- To open the tool, click on the icon. A pop-up window will appear with an Online Service drop-down menu. This is where you select the API you will be using. The TomTom API was used in this tutorial
- Select your start and end points by click on each Choose button. This will allow you to use your mouse to browse the area, simply select your points by clicking on the desired location. insert orm2
- With all your inputs selected, hit the Run button. A dialog window will appear saying "The analysis result was added to the canvas." Close this and the Online Routing Mapper window to view the generated route.
- The output will appear as black and white line connecting the green starting point to the red end point. insert orm3
TravelTime
API login
- Visit the sign up page at TravelTime.com
- Fill out the form under the Get started with TravelTime API header. inster ttapi1
- You will be redirected to your account page and must wait for your account to be validated.
Point-to-point routing
Service Area calculation
Geocoding
Hqgis
Hqgis is the most robust of all the API plugins, offering four network analysis functions: point-to-point routing, service area calculation, geocoding, and a function they call POI search, which allows you to find where the nearest POIs (fire station, for example) to the entered address are and displays their location. The plugin enables access to the HERE API, which requires an account to use.
API login
- To get the required API key, follow HERE's tutorial: How to get HERE Developer Credentials and API keys
- After you have generated your API key, open QGIS and click on the Hqgis icon found in the top right corner (shown below). insert hq_1
- In the Hqgis pop-up window, select the Credentials tab. Paste your API key into the bar and click save credentials. You should now be connected through the HERE API. insert hq_2
Point-to-point routing
- Open the Hqgis window, as shown in step 2 of the API login, and select the Routing tab. instert hq_r
- The To and From Addresses must be input manually, meaning that you must enter the street address of your start and end points.
- Select time or distance as your cost unit using the Type drop-down. Fast is used as the time cost, and short is used as the distance cost.
- The travel mode allows for the selection of different route options (pedestrians can use sidewalks while cars and trucks cannot). Car was the selected option for this tutorial
- Traffic can be enabled or disabled and uses historical data, but was not used in this tutorial. If traffic is enabled, you are also able to set a departure time.
- Click Calculate Route at the bottom of the window to generate the shortest path.
- The output is a line connecting the start and end points. insert hq_r2
Service Area calculation
- Open the Hqgis window, as shown in step 2 of the API login, and select the Isochrone tab. instert hq_i
- The From Addresses must be input manually, meaning that you must enter the street address of your start point.
- Select time or distance as your cost unit using the Metric drop-down. Distance was used in this tutorial.
- The travel mode allows for the selection of different route options (pedestrians can use sidewalks while cars and trucks cannot). Car was the selected option for this tutorial.
- Traffic can be enabled or disabled and uses historical data, but was not used in this tutorial. If traffic is enabled, you are also able to set a departure time.
- Click Calculate Isochrones at the bottom of the window to generate the Service Area.
- The output will be a polygon covering the extent of the service area. insert hq_i2
Geocoding
Geocoding with Hqgis allows you to: Create single points by inputting a street address, create points from an input table with an address field, or create points from an input table with multiple separate address fields (country, state, county, postal code, city, street, house number). All of these functions create the same outputs, which option you select depends on the format of your inputs. This tutorial will demonstrate how to create a single point from a street address input.
- Open the Hqgis window, as shown in step 2 of the API login, and select the Geocode tab. insert hq_g
- Type the street address of your intended location in the Address bar
- Click Geocode Single Address to generate your point
- Your output will be a single point feature (symbolized by the red dot) with detailed address information in its attributes, including the country, state (province), city, street and postal code. insert hq_g2
POI Search
- Open the Hqgis window, as shown in step 2 of the API login, and select the POI Search tab. insert hq_p1
- Type the street address of your intended location in the From Address bar.
- Select the type(s) of POI that you are looking for. Note that you can select multiple types, but the tool will generate a maximum of 100 points and select the 100 closest POIs, regardless of types. In the tutorial, Police-Fire-Emergency and Post office were selected.
- Click Find POIs at the bottom of the screen to generate your points.
- Your output will consist of multiple points distributed around your From Address. Note that there is not a point generated for the From Address. insert hq_p2
Resources
Government of Canada Open Portal https://open.canada.ca/data/en/dataset/17e9938c-c744-4171-b7bc-53abd7a6d8bc
Trois-Rivières Road Network https://open.canada.ca/data/en/dataset/17e9938c-c744-4171-b7bc-53abd7a6d8bc
QNEAT3 Github https://root676.github.io/
Online Routing Mapper https://cbsuygulama.wordpress.com/online-routing-mapper-en/
TravelTime Manual https://docs.traveltime.com/qgis/about/reference-manual
Hqgis Github https://github.com/riccardoklinger/Hqgis/blob/master/readme.md
HERE API Key Tutorial https://www.here.com/docs/bundle/getting-here-credentials/page/README.html


