Noise Modelling using OpeNoise in QGIS
Contents
Introduction
Purpose
The objective of this tutorial is to help the user visualize the impact of sound and how it propagates from a location. The user will do this using the “opeNoise” Plugin in QGIS and create a noise map assessing the exposure to noise in a given area, due to the existence of different sources of noise. For this tutorial, the noise to be modelled is the impact of formula 1 race cars at Baku City Circuit, Azerbaijan.
Accessing opeNoise Plugin in QGIS
To complete this tutorial the user will need to install QGIS and the opeNoise plugin:
1) Install *QGIS 3.10 and open QGIS Desktop
2) when you open QGiS you are greeted by Recent QGIS news and Project templates. To begin click "New Empty Project"
2) Click "Plugins" on the ribbon at the top of the screen, then click "Manage/install plugins"
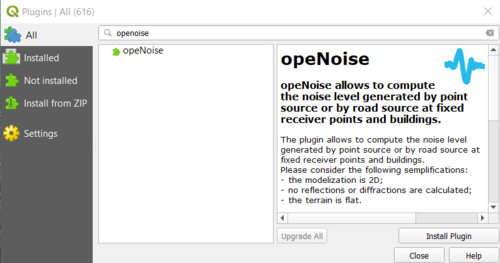
3) Search for opeNoise and click "Install Plugin". The user can then access opeNoise by clicking on the "Plugins" option on the ribbon.
Setting Coordinate Reference System(CRS)
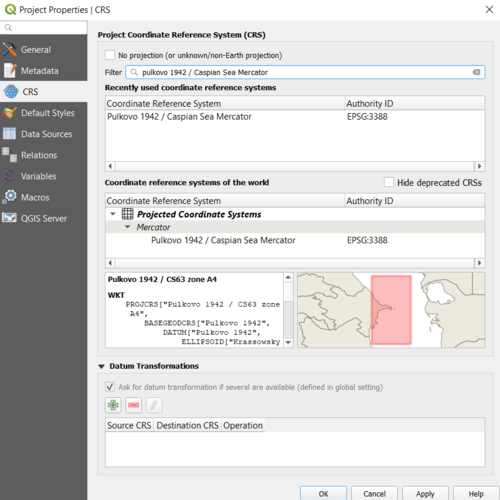
Before importing the required shapefile into QGIS, you must set a project coordinate system for your project file. Due to the study area being near the Caspian Sea we can use the "Pulkovo 1942/ Caspian Sea Mercator" projection to ensure accuracy in our analysis.
To change the projection in QGIS: press ctrl+ shift + p and click CRS. In the search bar type "Pulkovo 1942/ Caspian Sea Mercator" and click apply at the bottom of the screen.
Data
All data used for this tutorial is open source and can be acquired at
the shapefiles needed are: Baku City Street Circut and Baku Downtown Building


