Spatial Analysis of Different Types of Traffic Accidents with QGIS
Contents
Purpose
The purpose of this tutorial is to give users an understanding of what free and open source software (FOSS) is and demonstrate how to use Quantum GIS (QGIS) by using spatial data.
Introduction
The city of Ottawa has many programs regarding the safety of transportation and safer roads. A Safer Roads Ottawa Program is committed to preventing or eliminating road deaths and serious injuries. The program is conducted by Ottawa Fire Services, Ottawa Paramedic Service, Ottawa Police Service, Ottawa Public Health, and the Public Works Department. They are conducting the program through culture change, community engagement, and developing a sustainable safe transportation environment. Another program called the Safety Improvement Program includes all three E's of road safety: education, enforcement, and engineering. Locations chosen to be studied are usually higher-than-average traffic collision rate locations. The Safety Improvement Program is carried out on an annual basis because that is when year-end traffic collision and volume data is available.
Data
The data used in this tutorial is from the Carleton University's Maps, Data, Government Information Centre (MADGIC). The data used in this tutorial are a polygon shapefile of Ottawa, a point shapefile of traffic accidents, and a polyline shapefile of Ottawa roads. You may use any other data for another city or location as long as there are a polygon shapefile of your chosen city or neighbourhood, a polyline shapefile for roads, and a point shapefile for accidents. All these shapefiles should be in the same working folder as it would make things easier.
Quantum GIS (QGIS)
Quantum GIS, also known as QGIS is the best GIS tool that is a free and open source software (FOSS). The purpose of QGIS is to allow users to create maps with many capabilities provided by core functions and plugins. QGIS is available for Windows, Mac OS X, and Linux. Download the latest version of QGIS (v.2.6) to help get started on this tutorial.
Tutorial
Before we begin, the QGIS version that is used in this tutorial is v.2.2. Vector data of polygon shapefile of Ottawa, a point shapefile of traffic accidents, and a polyline shapefile of Ottawa roads will be used.
Setting Up the Environment
Go to the Project menu, select Projection Properties. The Projection Properties windows will open, and the Selected CRS that should be selected is NAD83(CSRS) / MTM zone 9 if in the Ottawa region. As well, toggle on Enable 'on the fly' CRS transformation.
Adding Shapefiles
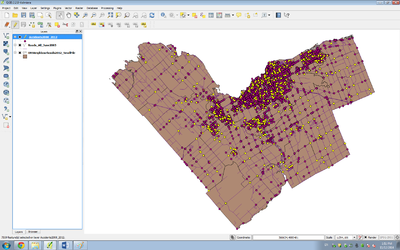
Once QGIS is launched, go to the Layer menu, Add Layer and select Add Vector Layer.
Editing Attribute Tables
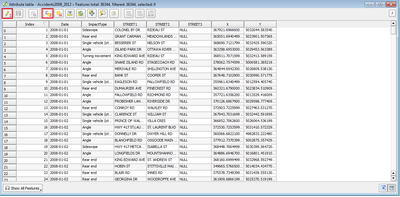
Right click on the accidents layer and select Open Attribute Table. An attribute table of the accident layer will appear and it will have the different types of impact and the two street names where the accident occurred.
Once you have the attribute table open, toggle on the Editing Mode (1). Once the editing mode has been toggled on, select Select Features Using an Expression (2). An Select By Expression window will appear, and in the function list, expand the Fields and Values and select Impact Type. In the Field values, a list should appear when you select the "all unique". The field values will have the list of different impact types that were seen in the attribute table.
In the expression box of the select by expression window. When you double click on the Impact Type, "ImpactType" will appear. Once that appears, you select the equal (=) sign where the available operators are listed. The next step is to select a field value. In this example, the first field value selected is "Angle". The expression should be "ImpactType" = 'Angle'. Once this expression has been selected, the impact types that are 'angle' are now highlighted.
Saving Selected Points (Shapefile)
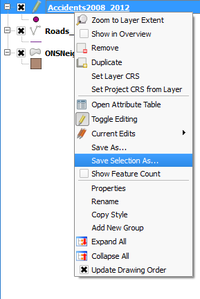
The selected points that are now highlight can be saved as their own shapefile. To do this, right click on the accidents layer and select Save Selection As and a window will appear. In this window, the format that the shapefile should be saved under is "ESRI Shapefile", give the shapefile a name and toggle on "Add saved file to map".
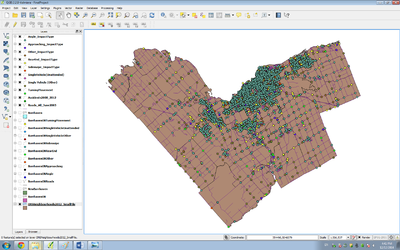
Once a new shapefile has been made and added to the map. Repeat "Editing Attribute Tables" and "Saving Selected Points (Shapefile)" steps until all the impact types have been saved as their own individual shapefiles.
Selecting a Specific Area
To select a specific area, open the attribute table for the Ottawa shapefile layer. Toggle editing mode on, and select "features using an expression".
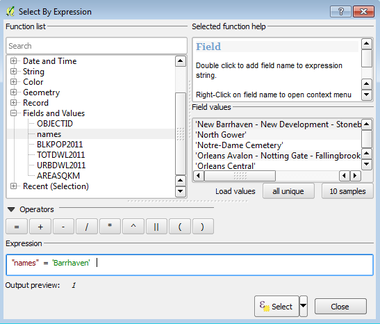
The Select By Expression window will appear, and in the function list, expand the Fields and Values and select the specific area you want to study. In this case, it is Barrhaven. The expression should be "names" = 'Barrhaven'. To save the selected shapefile, right click on the Ottawa layer and select Save Selection As and a window will appear. In this window, the format that the shapefile should be saved under is "ESRI Shapefile", give the shapefile a name and toggle on "Add saved file to map".
Since there is an Old Barrhaven and a New Barrhaven, the steps need to be repeated for the New Barrhaven area. The expression should be "names" = 'New Barrhaven - New Development - Stonebridge'.
Merging Shapefiles
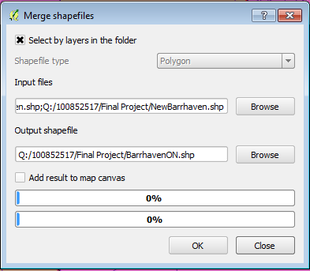
By using the two polygon shapefiles that were just made. In the main QGIS menu, go to the vector menu -> data management tools and select Merge shapefiles to one. When the merge shapefiles window appears, make sure to toggle on select by layers in the folder, so that only the shapefiles selected will be merged together. You could also toggle on add result to map canvas so that your map could be added in when the merge is complete.
Clipping Roads and Points
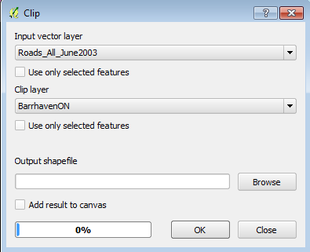
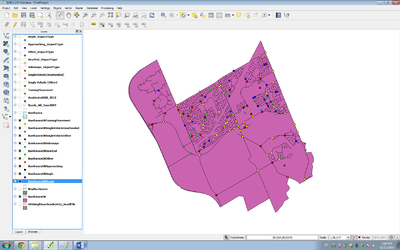
When the newly merged shapefile has been made, you can simply clip the roads and accident points into the study area as well. To do this, go to the vector menu, select geoprocessing tools and then select clip. A clip window will appear and the input vector layer will be what shapefile you want to clip onto the output vector layer. Therefore, the input vector layer should be roads and the clip layer should be the newly merged shapefile made, in this case called "BarrhavenON". When clipping the impact types, the clip layer remains the same, but the input vector layer changes.
Conclusion
By creating new point shapefiles of different impact types, it is easier to determine which impact type occurred where. By using QGIS, it shows how simple it is to use basic tools when it comes to analyzing spatial data.
References
- City of Ottawa. (2014). Safer Roads Ottawa Program | City of Ottawa. Retrieved December 20, 2014, from City of Ottawa: http://ottawa.ca/en/residents/transportation-and-parking/safer-roads-ottawa-program
- City of Ottawa. (2014). Safety Improvement Program | City of Ottawa. Retrieved December 20, 2014, from City of Ottawa: http://ottawa.ca/en/residents/transportation-and-parking/road-safety/safety-improvement-program
- MacOdrum Library. (2014). Maps, Data and Government Information Centre | MacOdrum Library. Retrieved December 19, 2014, from MacOdrum Library: https://www.library.carleton.ca/contact/service-points/maps-data-and-government-information-centre
- QGIS. (2014). Discover QGIS. Retrieved December 20, 2014, from QGIS: http://www.qgis.org/en/site/about/index.html
- QGIS. (2014). Download QGIS. Retrieved December 20, 2014, from QGIS: http://www.qgis.org/en/site/forusers/download.html

