Visualizing Multi-Temporal Data with Temporal Controller
Contents
Introduction
In a distant universe, 500 milliseconds ago, you embarked on a mission of temporal exploration and spatial pattern analysis. Your task is to map and visualize the occurrences of emergencies in the City of Seattle within your selected timeframe from the year 2020. You will learn to use Time Manager, a plugin for QGIS, so you may conduct spatial analysis at any point in time. Your analyses will be an option of the following: weekly, bi-weekly, or monthly emergency calls. The analyses you will conduct are
Introduction to Temporal Controller
Temporal Controller is a built in plugin of QGIS that allows for surfing through temporal geospatial data. It allows for temporal visualization of layers in QGIS. The Temporal Controller was incorporated into QGIS from version 3.14 onward. If you have an older version of QGIS refer to Visualizing Multi-Temporal Data with Time Manager for it's plugin tutorial.
Introduction to Earth Quakes in the US from 1973 to 1997
Requirements
Windows/Macintosh/Linux Compatible
Getting the data
Getting Earthquake and Landmass data
- Proceed to [1] which includes a zip containing continental landmass shapefile and [freegistutorial.com/wp-content/uploads/2018/10/quake_mi.zip] that contains the USA Earthquake data.
- Press download and save the zip file in an appropriate location
Temporal Controller
Data Maintenance
- Once you have imported the two shapefiles into your QGIS project you need to make sure that your shapefile has the proper reference Field within it's attribute table.
- You need a "Date" type field with whatever time unit you are going to be using. For this tutorial you must create a new field called "Dateofocc" and use the "to_date" expression to fill in the Field

Importing a Single Dataset to Time Manager
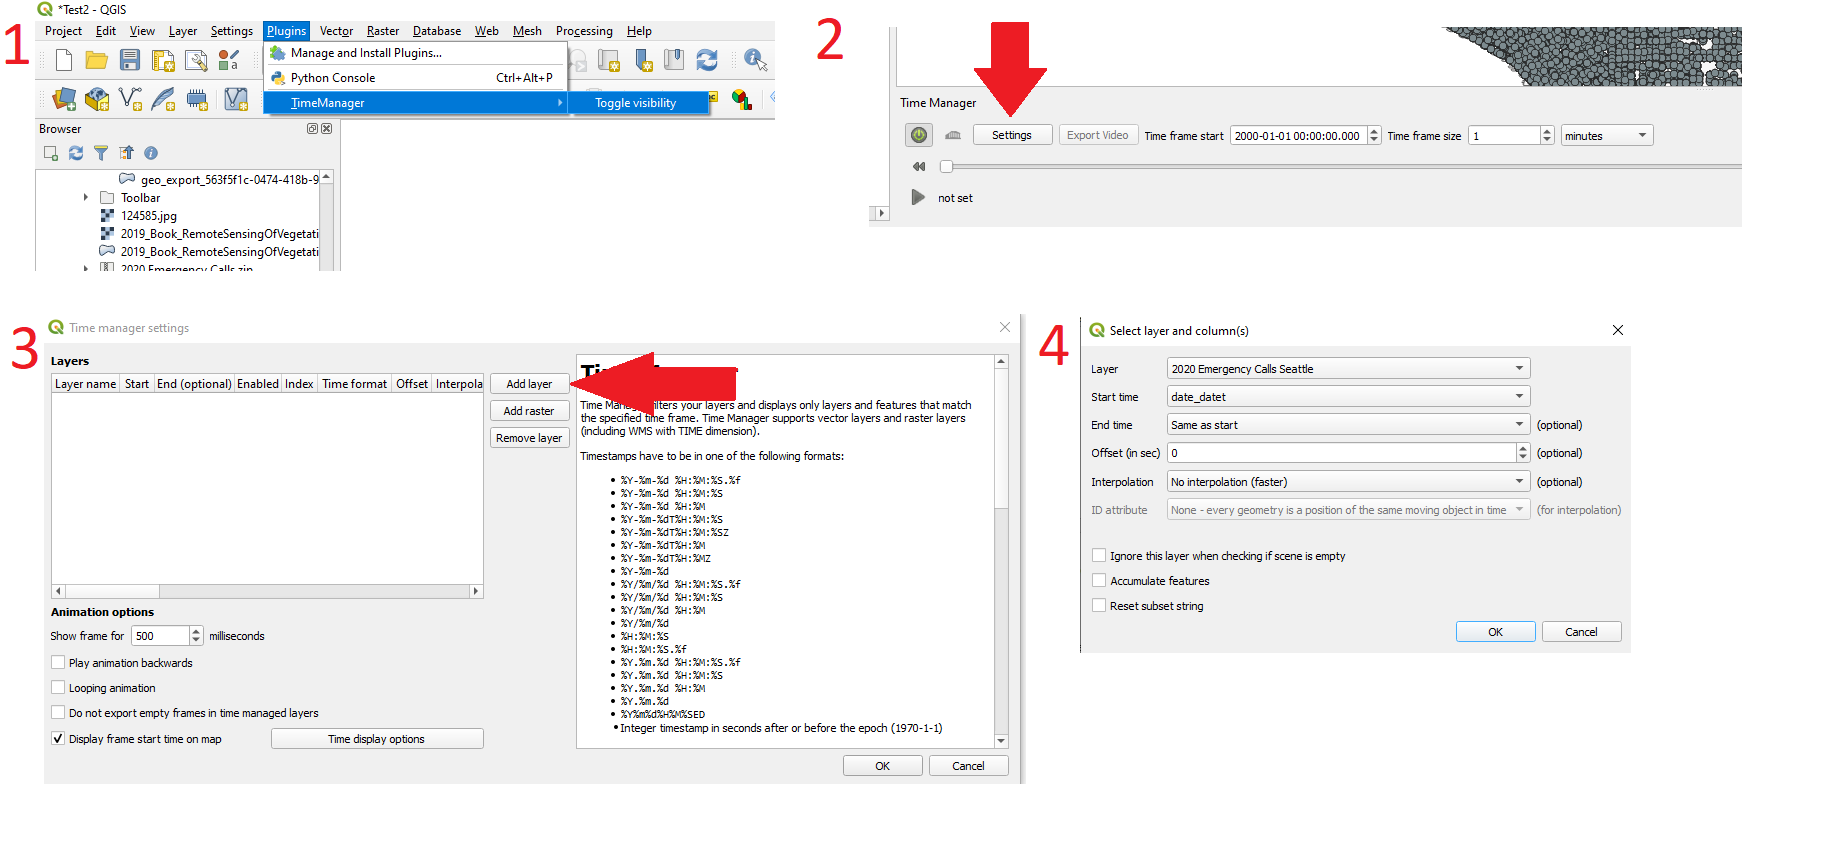
- Follow the following steps look at the image for reference
- 1: Press Plugin and ensure that visibility is enabled for the Time Manager plugin
- 2: The Manager should now be visible at the bottom of the page, press on the settings button
- 3: Press on add layer on the popup menu
- 4: Make sure the layer is "2020 Emergency Calls Seattle" and the start time is set to "date_datet" and press "Ok" to finish


Visualizing the Distribution of the Type of Emergency
- Right click on seattle.shp, click "properties" from the drop down menu.
- Browse to the "Style" tab.
- Change symbology from "Single Symbol" to "Categorized"
- Choose "Type" as the column.
- Pick a gradient color ramp.
- Click on the "Classify" button.
Conclusion
At this point in time, you have learned to utilize the following to conduct :
- Visualize data with Time Manager
- Animate/Simulate with Time Manager
- Export Images from the Animation
- Create GIF's from the exported images
Feel free to share your results in this wiki and/or make this tutorial more effective.