Difference between revisions of "Visualizing Multi-Temporal Data with Time Manager"
m (Page is out of date, linking up to date wiki page) |
|||
| (24 intermediate revisions by 3 users not shown) | |||
| Line 1: | Line 1: | ||
| + | ==Notice== |
||
| + | This tool is now out of date refer to [[Visualizing Multi-Temporal Data with Temporal Controller]] for up to date Multi-Temporal Visualization tool |
||
| + | |||
| + | |||
==Introduction== |
==Introduction== |
||
| − | In a distant universe, 500 milliseconds ago, you embarked on a mission of temporal exploration and spatial pattern analysis. Your task is to map and visualize the occurrences of emergencies in the City of Seattle within your selected timeframe from the year 2020. You will learn to use Time Manager, a plugin for QGIS, so you may conduct spatial analysis at any point in time. Your analyses will be an option of the following: weekly, bi-weekly, or monthly. The analyses you will conduct are: |
+ | In a distant universe, 500 milliseconds ago, you embarked on a mission of temporal exploration and spatial pattern analysis. Your task is to map and visualize the occurrences of emergencies in the City of Seattle within your selected timeframe from the year 2020. You will learn to use Time Manager, a plugin for QGIS, so you may conduct spatial analysis at any point in time. Your analyses will be an option of the following: weekly, bi-weekly, or monthly emergency calls. The analyses you will conduct are: |
::1. "points in polygon" to probe the amount of incidents in a given neighbourhood |
::1. "points in polygon" to probe the amount of incidents in a given neighbourhood |
||
::2. "near neighbourhood analysis" to gauge the average of the distance between incidents |
::2. "near neighbourhood analysis" to gauge the average of the distance between incidents |
||
::3. "basic statistics" such as the mean, median, min, max and the range of incidents in a given time. |
::3. "basic statistics" such as the mean, median, min, max and the range of incidents in a given time. |
||
| + | |||
| − | Last but not least you will learn to visualize and animate temporal data. |
||
===Introduction to Time Manager=== |
===Introduction to Time Manager=== |
||
| Line 12: | Line 16: | ||
===Introduction to City of Seattle Real-Time 911 Emergency Calls=== |
===Introduction to City of Seattle Real-Time 911 Emergency Calls=== |
||
| − | As per the title, the data you will be using are close to real time, as they are updated every |
+ | As per the title, the data you will be using are close to real time, as they are updated every 10 minutes; they comprise all the emergency calls made to the city's various emergency departments and were taken from the 01-01-2020 to 06-10-2020. |
===Estimated Time to Complete=== |
===Estimated Time to Complete=== |
||
| Line 20: | Line 24: | ||
Windows/Macintosh/Linux Compatible |
Windows/Macintosh/Linux Compatible |
||
<br/> |
<br/> |
||
| − | *[https://qgis.org/en/site/forusers/download.html QGIS (3. |
+ | *[https://qgis.org/en/site/forusers/download.html QGIS (3.10 was the latest stable release when this document was last updated)] |
==Installing Time Manager== |
==Installing Time Manager== |
||
| Line 33: | Line 37: | ||
===Enabling Plugin=== |
===Enabling Plugin=== |
||
* Click "Plugins" on the toolbar. A drop down menu will appear. |
* Click "Plugins" on the toolbar. A drop down menu will appear. |
||
| − | * Click "Manage Plugins" |
+ | * Click "Manage and Install Plugins..." |
| − | * Search " |
+ | * Search "TimeManager" |
| − | * Enable " |
+ | * Enable "TimeManager" |
| − | * Click "OK" to exit. |
+ | * Click "OK" to exit. |
| ⚫ | |||
| ⚫ | |||
| ⚫ | |||
| ⚫ | |||
| − | |||
| ⚫ | |||
| − | |||
| ⚫ | |||
| + | ==Getting the data== |
||
===Getting emergency calls data=== |
===Getting emergency calls data=== |
||
* Proceed to [https://github.com/YussufY/SeattleCalls/blob/main/2020%20Emergency%20Calls.zip this Github link] which includes a zip containing all 911 calls for the first 10 months of 2020 in Seattle |
* Proceed to [https://github.com/YussufY/SeattleCalls/blob/main/2020%20Emergency%20Calls.zip this Github link] which includes a zip containing all 911 calls for the first 10 months of 2020 in Seattle |
||
| Line 55: | Line 52: | ||
==Importing Data== |
==Importing Data== |
||
| − | |||
| − | ===Importing a Spreadsheet to QGIS=== |
||
| − | * Start QGIS and click "Layer" on the toolbar. A drop down menu will appear. |
||
| − | * Click "Add Delimited Text Layer". |
||
| − | * Browse to location of Seattle_Real_Time_Fire_911_Calls.csv file. |
||
| − | * Click on the "OK" button. |
||
| − | |||
| − | * Right click on the imported spreadsheet on the Layers panel. A drop down menu will appear. |
||
| − | * Click "Save As" |
||
| − | * Format should be "ESRI shapefile" |
||
| − | * CRS should be "WGS84" |
||
| − | * Name of file is "Seattle.shp" |
||
| − | * "Add saved file to map" should be enabled. |
||
| − | * Save file to a desired location. |
||
| − | * Click on the "OK" button. |
||
===Importing a Vector Polyline/Polygon to QGIS=== |
===Importing a Vector Polyline/Polygon to QGIS=== |
||
| − | * Start QGIS and click "Layer" on the toolbar |
+ | * Start QGIS and click "Layer" on the toolbar A dropdown menu will appear. |
* Click "Add Vector Layer". |
* Click "Add Vector Layer". |
||
| − | * Browse to location of |
+ | * Browse to the location of the files that you downloaded and select the "2020 Emergency Calls Seattle.shp" and press add |
| + | * Repeat the same step for the "City_Clerk_Neighborhoods.shp" to add it |
||
| − | * Click on the "Open" button to import. |
||
| + | * Ensure that they are in your Layers subsection on the main page of QGIS |
||
| + | |||
| ⚫ | |||
| ⚫ | |||
| ⚫ | |||
| ⚫ | |||
| ⚫ | |||
===Importing a Single Dataset to Time Manager=== |
===Importing a Single Dataset to Time Manager=== |
||
| + | * Follow the following steps look at the image for reference |
||
| − | * Click on the "Settings" button. |
||
| + | * 1: Press Plugin and ensure that visibility is enabled for the Time Manager plugin |
||
| − | * Click "Add Layer". |
||
| + | * 2: The Manager should now be visible at the bottom of the page, press on the settings button |
||
| − | * Choose "Seattle.shp" as the Layer. |
||
| + | * 3: Press on add layer on the popup menu |
||
| − | * Choose "Datetime" column as the Start Time. |
||
| + | * 4: Make sure the layer is "2020 Emergency Calls Seattle" and the start time is set to "date_datet" and press "Ok" to finish |
||
| − | * Click "OK" to confirm and exit. |
||
| + | *[[File:How to get time Manager.png]] |
||
| ⚫ | |||
| + | |||
| ⚫ | |||
==Visualizing the Distribution of the Type of Emergency== |
==Visualizing the Distribution of the Type of Emergency== |
||
| Line 95: | Line 88: | ||
===Result: Categorized Symbology=== |
===Result: Categorized Symbology=== |
||
| − | [[File:TXT.png]] |
||
==Points in Polygon Spatial Analysis== |
==Points in Polygon Spatial Analysis== |
||
| Line 118: | Line 110: | ||
:[[File:NOV20122.PNG]] |
:[[File:NOV20122.PNG]] |
||
| ⚫ | |||
| ⚫ | |||
| + | * [https://gfycat.com/inexperienceduniformambushbug Here is an example of the location of day to day 911 Emergency Calls] |
||
| − | |||
| − | ===Importing multiple datasets=== |
||
| − | * Click on the "Settings" button. |
||
| − | * Click "Add Layer". |
||
| − | * Choose "Seattle_Start.shp" as the Layer. |
||
| − | * Choose "Datetime" column as the Start Time. |
||
| − | * Click "OK" to confirm and exit. |
||
| − | |||
| − | * Repeat process with "Seattle_End.shp" as the Layer. |
||
| − | * Change the offset to -20 |
||
| − | * Click "OK" |
||
| − | |||
| ⚫ | |||
| − | *[https://www.youtube.com/watch?v=9e48i5MworQ Screencast of Visualization] |
||
| − | *[http://www.screenr.com/ Screenr] was used to make a video of the animation. |
||
==Conclusion== |
==Conclusion== |
||
Latest revision as of 10:55, 20 September 2023
Contents
Notice
This tool is now out of date refer to Visualizing Multi-Temporal Data with Temporal Controller for up to date Multi-Temporal Visualization tool
Introduction
In a distant universe, 500 milliseconds ago, you embarked on a mission of temporal exploration and spatial pattern analysis. Your task is to map and visualize the occurrences of emergencies in the City of Seattle within your selected timeframe from the year 2020. You will learn to use Time Manager, a plugin for QGIS, so you may conduct spatial analysis at any point in time. Your analyses will be an option of the following: weekly, bi-weekly, or monthly emergency calls. The analyses you will conduct are:
- 1. "points in polygon" to probe the amount of incidents in a given neighbourhood
- 2. "near neighbourhood analysis" to gauge the average of the distance between incidents
- 3. "basic statistics" such as the mean, median, min, max and the range of incidents in a given time.
Introduction to Time Manager
Time Manager is a plugin of QGIS that allows for surfing through temporal geospatial data. It allows for visualization and spatial analysis simultaneously.
Introduction to City of Seattle Real-Time 911 Emergency Calls
As per the title, the data you will be using are close to real time, as they are updated every 10 minutes; they comprise all the emergency calls made to the city's various emergency departments and were taken from the 01-01-2020 to 06-10-2020.
Estimated Time to Complete
20 minutes at minimum and 40 to 60 minutes at maximum (dependent on your hardware, software, internet connection/speed and distractions).
Requirements
Windows/Macintosh/Linux Compatible
Installing Time Manager
Installing Plugin
- Click "Plugins" a drop down menu should show up
- Click "Manage and Install Plugins..." a menu should pop up
- Click "Install from zip"
- Download zip plugin from here
- Click "Install Plugin" and wait for confirmation of install.
- Click "Close" to exit.
Enabling Plugin
- Click "Plugins" on the toolbar. A drop down menu will appear.
- Click "Manage and Install Plugins..."
- Search "TimeManager"
- Enable "TimeManager"
- Click "OK" to exit.
Getting the data
Getting emergency calls data
- Proceed to this Github link which includes a zip containing all 911 calls for the first 10 months of 2020 in Seattle
- Press download and save the zip file in an appropriate location
Getting Seattle neighbourhood data
- Proceed to the Seattle geoData website and download the City Clerk neighbourhood Shapefile
- Save the file in the same location as the emergency calls file
Importing Data
Importing a Vector Polyline/Polygon to QGIS
- Start QGIS and click "Layer" on the toolbar A dropdown menu will appear.
- Click "Add Vector Layer".
- Browse to the location of the files that you downloaded and select the "2020 Emergency Calls Seattle.shp" and press add
- Repeat the same step for the "City_Clerk_Neighborhoods.shp" to add it
- Ensure that they are in your Layers subsection on the main page of QGIS
Time Manager
Enabling User Interface
- Time Manager should appear under "Plugins" drop down menu.
- If not, right click on the toolbar, drop down menu will appear; scroll down to Time Manager and check.
- Time Manger should now be at the bottom of your screen.
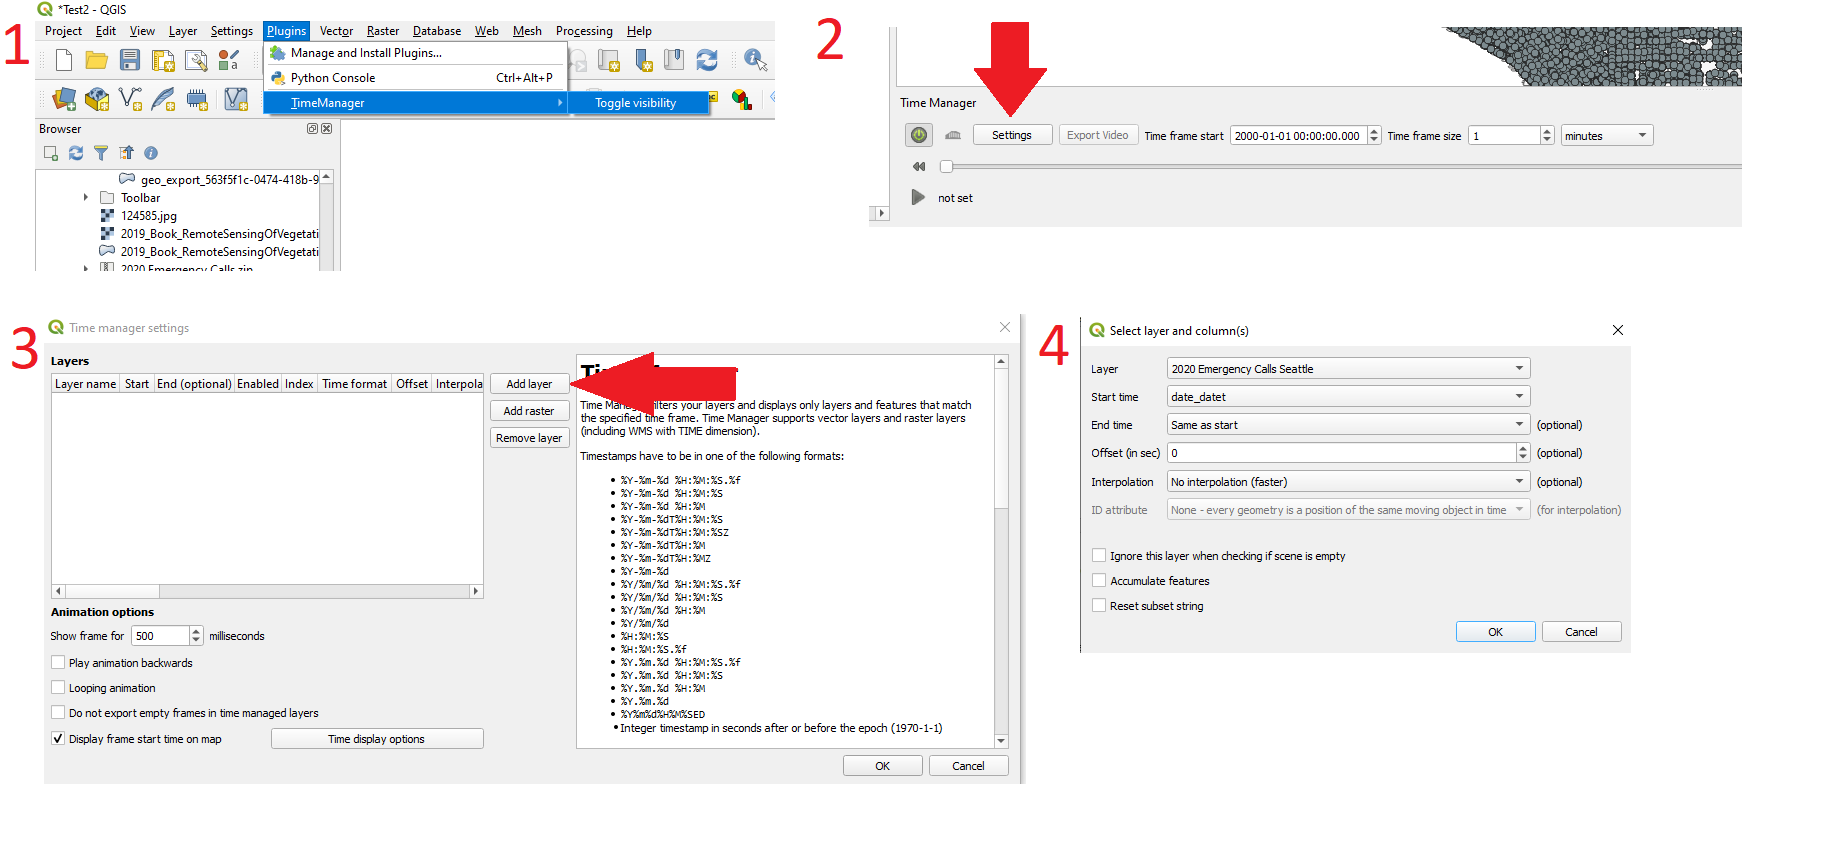
Importing a Single Dataset to Time Manager
- Follow the following steps look at the image for reference
- 1: Press Plugin and ensure that visibility is enabled for the Time Manager plugin
- 2: The Manager should now be visible at the bottom of the page, press on the settings button
- 3: Press on add layer on the popup menu
- 4: Make sure the layer is "2020 Emergency Calls Seattle" and the start time is set to "date_datet" and press "Ok" to finish


Visualizing the Distribution of the Type of Emergency
- Right click on seattle.shp, click "properties" from the drop down menu.
- Browse to the "Style" tab.
- Change symbology from "Single Symbol" to "Categorized"
- Choose "Type" as the column.
- Pick a gradient color ramp.
- Click on the "Classify" button.
Result: Categorized Symbology
Points in Polygon Spatial Analysis
- Click "Vector" on the toolbar. A drop down menu will appear.
- Click "Analysis" from the drop down menu. Another drop down menu will appear.
- Click "Points in Polygon"
- Choose "Neighbourhoods.shp" as the input polygon vector layer.
- Choose "Seattle.shp" as the input point vector layer.
- Choose a output shapefile name, for this tutorial I chose "area.shp".
- Click "OK" to process.
- Click "Close" afterwards to exit.
Results:Bi-Weekly


Results:Monthly


Visualization
Conclusion
At this point in time, you have learned to utilize the following to conduct spatial pattern analysis:
- Time Manager plugin for QGIS
- Visualize data with Time Manager
- Animate/Simulate with Time Manager
- Point in Polygon Analysis
- Nearest Neighbour Analysis
- Basic Statistics such as min, max, median and range.
Feel free to share your results in this wiki and/or make this tutorial more effective.