Basic Processing of Radarsat-1 data in Snap ESA
Contents
Introduction
On April 1st, 2019, NRCAN released over 35 000 RADARSAT-1 scenes for open-access, with anticipation of releasing more in the future. This allows anyone to access SAR scenes covering Canada as far back as 1995 for free! This is incredible progress, however very little documentation exists on processing RADARSAT-1 products. This tutorial looks to fill this gap; providing users with basic background on RADARSAT-1, along with instructions on downloading RADARSAT-1 scenes and basic processing techniques within open-source SNAP ESA software.
Overview of Radarsat-1
RADARSAT-1 was a C-Band (5.6cm wavelength) radar satellite launched 1995 in collaboration of MDA and the Canadian Space Agency. It is able to send and receive in horizontally polarized microwaves at a spatial resolution between 1m and 100m, and swath widths ranging from 18km - 500km, depending on beam mode. RADARSAT-1 went out of commission in 2013 after 17 years of supplying Canada and the world with reliable SAR data. It was Canada's first Earth observation satellite and was used across the country for tasks such as quantifying climate change, crop monitoring, marine hazard study, and disaster relief. To learn more about RADARSAT-1, visit MDA's website here, where a series of manuals are available for free that overview everything from beam-modes to file conversions.
Retrieving a Radarsat-1 Product
EODMS Account
Before we begin working in SNAP, we first have to download a Radarsat-1 product from NRCAN. We begin at the Earth Observation Data Management System. In order to download products, an account must first be created. This can be done by clicking on the Register (Required to Order) link under the Users subsection on the left-hand side of the page. Follow the on-screen instructions to create your account, confirm your email, and change your password.
If you already have an account, log into EODMS by clicking on the Login link under the Users subsection on the left-hand side of the page.
Finding a Scene
Once an account is created, we can begin searching for a scene. Begin by clicking the Search tab under the Start tab and Data subsection on the left-hand side. What will appear are a series of grey boxes indicating the steps needed to locate and download our scene. Each numbered step below corresponds to the like numbered grey box.
1. The first step is to select our data. Under All Collections there are three main options: Aerial photo, Value-added Satellite Products and our data of interest, Radar Satellites. After selecting Radar satellites, you will want to select RADARSAT-1 Open Data Products
2. Once the data is selected, our date range must be selected. Select the Date Range option and input dates between which you wish to find a scene. For this example, I am looking for any images in 2012. Keep in mind when selecting your date range that RADARSAT-1 may only provide imagery from 1995 to 2013.
3. The next step is to select specific options we wish our data to have. This includes a certain incidence angle range, beam modes, pass direction and so on. These steps are for the most part optional, as they depend mostly on the study being conducted, however, for our case we need a specific beam mode. Under the Beam Mode selection box, select Standard.
NOTE: Due to a bug within SNAP, we can only work with Standard beam mode imagery. Standard beam-mode imagery is not available everywhere, so this may affect your search results.
4. Finally, before we submit our search, we must select an area of interest (AOI). This can be done is numerous ways, as indicated by the seven different drop-down menu's under this step. For this example, Draw an Area will be used. Information on the use of each tool can be found by selecting the ? beside each drop-down.
- A. Begin by using the map on the right half of the screen to zoom into an area of interest, for this example I will be focusing on the oil-sands operations around Fort McMurray Alberta.
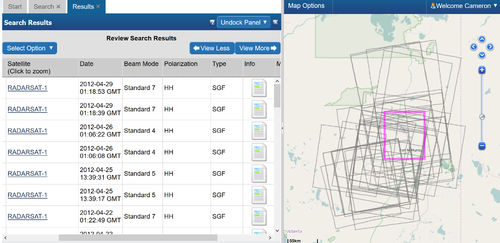
- B. Select the Draw an Area drop-down menu and then the Rectangle option. Draw the rectangle around an area that you wish to be included in your scene. See Figure 1 for an example.
5. Once all above steps are completed, select the Submit Search tab then the Search button. If results are found, a new Results tab will open showing all matching results. If no results are found, refine your search dates and/or search area until results are found.
Downloading the Scene
The Results will list all scenes that match your search criteria, and will look something like Figure 1. Hover over each result to highlight its footprint on the map. Select a scene you wish to work with and check the Order box. In the new window that appears, check the box under the Select item(s) tab and then the Update Cart button. This will close the window and open a forth tab titled Cart. In this tab you will see your scene listed. Click the Submit Satellite Product Order button. This will open a window asking for the Order Priority and Delivery Destination(s). Leave both of these as their defaults and click the Order button.
Once submitted, an email will be sent confirming your order, along with a notice that another email will sent once the scene is ready for download. This second email could take some time to arrive depending on the amount of traffic on EODMS when your order is sent in. Once this email arrives, select the HTTPS link within the email, this will open a tab in your internet browser. In this tab, click the link beside the file icon, followed by the link ending in .zip to download your scene. Save it to a place that is easily accessible later.
Snap ESA Introduction
Get Snap ESA
Snap ESA software can be downloaded at the following link [1]. Click the Download link in the Sentinel Toolboxes row that corresponds to your OS. Once the installer is downloaded, follow the instructions to install the software package onto your computer. When the portion of the installer asking to configure the Python library appears, skip this section as it will not be used in this tutorial or for most small processing scenarios.
NOTE: This tutorial was updated in 2021 and so complies with SNAP version 8.0 and below.
Load a Scene & GUI Overview
To load our scene into SNAP, first unzip the product, then within SNAP navigate to File->Import->SAR SENSORS->RADARSAT 1. Navigate to the location your scene was extracted into using the file browser and open the corresponding file. If no file appears under this browser, instead navigate within SNAP to File->Open Product. Navigate to the location your scene was extracted into and open the file with the extention ".vol" or the name "vdf_dat.001". The file naming convention was changed at some point during RADARSAT-1's lifetime, which is the reasoning for two file options.
NOTE: Due to the age of the data, there is a chance an error will occur on the import step due to corruption. If this is the case, you will need to go back to the previous steps and download a new scene.
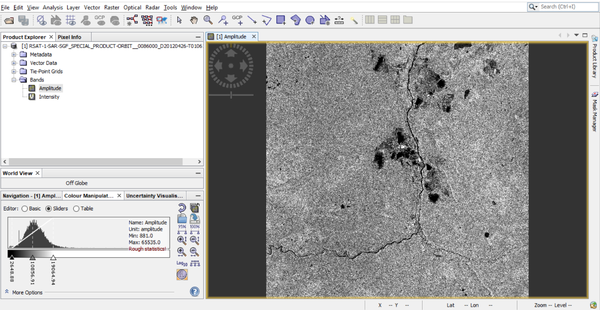
If opened successfully, a product should appear in the Product Explorer window on the left. Press the '+' to the left of the product name to expand it into several folders of data. The one we are most interested in is the Bands folder, expand it. Inside will be two bands, Amplitude and Intensity, double-click Amplitude to open it in the product viewer on the right side. Use the scroll wheel (or the magnifying glass icon on the top toolbar) to zoom in and out on the product. To explore the product, select the hand icon on the top toolbar and click & drag around the product. Notice as the cursor is moved around on-top of the product, the line-pixel coordinates and lat-long coordinates in the lower right corner are updated. The extents of the current view on the map can be seen by selecting the Navigation tab in the lower left section. A histogram, along with some rough statistics for our product can be found in the tab beside, labeled Colour Manipulation. Your SNAP interface should look similar to that in Figure 2 (with a different scene of course) if the previous steps have been done correctly.
Now that some basic navigation has been established within the SNAP environment, we'll begin processing our product.
Subset
The first step within SNAP that should be conducted is to create a subset of your specific study area. This is not a required step, as the full scene can be used for this tutorial, just be aware that using the full scene will require longer processing times than using a subset.
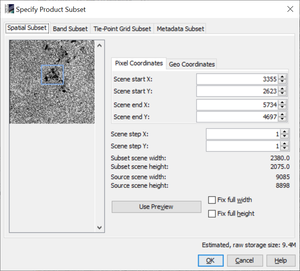
Begin by navigating to Raster->Subset. A window as per Figure 3 should appear. Within this interface, we can subset in three ways: Drawing a subset area, Pixel coordinates, or Geographic coordinates. If your subset area does not need to be precise, the easiest method is to simply manipulate the subset bounding box on the map. If precision is necessary, enter the geographic coordinates. If entering coordinates, make sure your subset region bounding box appears on the map, if not, your study area may not be within the image bounds. Once your preferred subset region has been set, hit OK. A new product will appear within the Product Explorer. Open up the Amplitude band as described in the previous step, notice how the image has been clipped to only contain your study region.
Speckle Filter & Colour Manipulation
The next step we need to conduct in processing our scene is to run a Speckle Filtering operation. Speckle is the salt-and-pepper effect that appears in radar imagery. Generally this is considered error or noise and should be averaged out to remove false returns and achieve a better insight on return from the ground. Select the subsetted product (or the original scene that was imported into SNAP if subsetting was not conducted), and then navigate to Radar->Speckle Filtering->Single Product Speckle Filter.
The first tab contains input and output parameters, most of which should be auto filled. Make sure the correct input file is selected (either the original product or subsetted product, the output name can be left the same. Change the directory to your working directory using the triple dots (...). The output format that should be used in intermediate steps is BEAM-DIMAP, SNAP's file format.
The second tab contains the operation settings. For this example, Select Amplitude as our source band, a Boxcar filter, and X & Y filter size of 5.
With these parameters set, hit Run. A new object will appear within the Product Explorer once the task is completed. Open up your Amplitude band as before, and notice how the filtering has smoothed out our image. Below the product explorer, open the Colour Manipulation tab and look at the histogram. Compare it to the histogram of the non-filtered product and notice how it has become a smoother and better defined bell. Feel free to try other filtering methods and filter sizes to compare and contrast their differences.
NOTE: (Optional) Try selecting one of the bin markers. This will allow you to classify by colour. (If bin markers overlap or are outside the plot area, use the magnifying glass icon to stretch the distribution over more of the plot area.) Another option is to select the blue file folder in the upper right corner of the colour manipulation tab. This icon allows you to import a colour palette from a text file. Scroll through the options and select one that can best represent your data. Examples are terrain, which is a blue-yellow-white colour scheme, and 5 colours, which is a white-blue-yellow-red scheme. a More Options tab will appear at the bottom left corner of the tab window. In it, there are options to make the colours discrete, specify a 'No data' colour and add a Histogram Matching transformation. See which combination works best for you.
Creating Masks using the Mask Manager
While preparing our data, we may want to create a mask to aid further analyses and comparisons. This is completed in the Mask Manager tab normally found at the right side of the SNAP screen. (If Mask Manager is not there, in the Menu bar, click View->Tool Windows->Mask Manager to open.) By clicking the dock button in the top right corner of the Mask Manager tab, we can add Mask Manager as a tab near the Product Explorer tab. Masks can be applied in three ways using the Mask Manager:
1. Based on a logical band expression (denoted by the f(x) symbol). With this option, we can create a boolean expression to select the cells which will host the mask. click 'Amplitude_HH' or any mask already created to form the boolean argument. Once completed, press OK. The mask will be applied to those values that fulfill the boolean condition.
2. By a value range (denoted by the [x] symbol). This option is simpler than the first as there are two inputs, the starting range and the ending range value. Enter these values then press OK once complete. The mask will be applied to those values found within the range.
3. Based on a new geometry container (denoted by the overlapping line, square and triangle symbol).
Other notable ways to create masks are by using the polygon, rectangle or ellipse drawing tools at the bottom of the toolbar. Select an area by clicking and dragging the shape over the area of interest. Once completed, the shape will appear in the Mask Manager tab. Click the select tool, then select the shape we created. Go to the Layer Editor view found in the same location we found the Mask Manager. In the Layer Editor, change the fill to 'None' and the stroke colour to black. This configuration will allow us to manually select the colour of our mask in the Mask Manager. Be sure to make the shape visible in the Mask Manager by clicking the check box next to its name.
Slant-Range to Ground-Range
The final processing step is to convert our scene from slant-range to ground-range. Our scene in its current form is orientated on an imaginary slant relative to the sensors incidence angle in range (y) and azimuth (x) coordinates. This means the image is positioned relative to the sensors flight path and not general map coordinates. To convert our image to mapping coordinates, the image must be re-sampled in a process known as an ellipsoid correction. To perform this operation, select the filtered product in the Product Explorer, and navigate to Radar->Geometric->Ellipsoid Correction->Geolocation-Grid.
As in the previous step, a window with two tabs will appear. The settings for the first tab are the same as the previous step, except select the speckle-filtered product as the input. In the second tab, select the Amplitude band, and pick a re-sampling method (I recommend Bilinear Interpolation), and finally select a map projection. A good option is UTM / WGS84 (Automatic), which will determine which UTM zone to use automatically. Once prepared, hit Run. A new tab will appear in the Product Explorer once the process is completed. The product is now ready for export.
Final Product
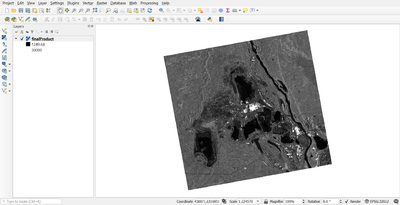
Upon completion of the last step, we now have a usable RADARSAT-1 product, however it is still in SNAP format and must be converted. To finish off our product, we will convert it into a GeoTiff. Select the ellipsoid-corrected product in the product explorer and navigate to File->Export->GeoTiff. Navigate to the location on your computer to which you wish to save the product and click Export Product. Once complete, your product is ready! It can be imported into any GIS for further analysis, for example QGIS as seen in Figure 4.
References
https://mdacorporation.com/geospatial/international/satellites/RADARSAT-1


