Creating Custom Basemaps with Vector Tile Servers
Contents
Overview
Basemaps play an important role in giving geographic context to a map, however they can be hard to come across and are typically only available under a copyright or license that makes the unusable for many projects. The styling of a basemap can also affect the aesthetic of a map, however the appearance of basemaps is generally controlled by the original creator of the basemap.
This tutorial will show how to create a custom basemap using open data, how to apply a customized style to the basemap, and how to use the basemap in a mapping application.
Prerequisites
This tutorial will require some basic command line use (running commands, changing directories) and will be done in a Linux environment on Ubuntu, however it is possible to complete these steps on Windows, macOS, and other Linux distributions as well.
The following tools will need to be installed:
- NodeJS (Install instructions)
- Docker (Install instructions)
- docker-compose (Install instructions)
- git
- Osmium (
apt-get install osmium-tool)
Setup
Once NodeJS, Docker, docker-compose, and git are installed we can set up the other tools required to create the vector tiles and tileserver.
Navigate to a working directory of your choice and then clone the openmaptiles repository using git.
git clone https://github.com/openmaptiles/openmaptiles
cd openmaptiles
This repository contains a set of scripts that we will use to generate vector tiles from OpenStreetMap data. The script uses docker-compose and docker to process the data.
We will also need a tileserver to serve our tiles once we've generated them. We will use tileserver-gl-light which is available as a NodeJS (npm) package.
npm install -G tileserver-gl-light # The -G flag will make the tileserver package available "G"lobally
Vector Tiles
Tilesets are a way of storing geographic data that has been split up into a uniform grid of tiles, and pre-processed to be displayed at preset zoom levels. This pre-processing makes it really easy for a "tileserver" to serve only the relevant data for the current view and zoom of a map viewport, which is far more efficient than trying to load an entire raw dataset. A tileset can contain vector or raster data, however we will be creating a tileset of vector data.
Our vector data source will be OpenStreetMap which makes its data available under the Open Database License (ODbL). The license states that:
You are free to copy, distribute, transmit and adapt our data, as long as you credit OpenStreetMap and its contributors. If you alter or build upon our data, you may distribute the result only under the same licence. The full legal code explains your rights and responsibilities.
OpenStreetMap has a dedicated page which details how to credit OpenStreetMap and its contributors.
Generating Tiles
To generate our own vector tiles, we will be using the OpenMapTiles project which provides and open-source tool for generating tilesets from OpenStreetMap data.
To install OpenMapTiles, run the following command, and then change into the openmaptiles directory:
git clone https://github.com/openmaptiles/openmaptiles.git
cd openmaptiles
A "quickstart" script is provided which can be run to quickly generate tiles. By default, it will download data for, and generate a tileset of Albania.
By providing the name of a specific region (from a set list of regions), the script will generate tiles for the specified region instead.
The tileset data will be stored in the data directory, under the OpenMapTiles project.
./quickstart.sh         # Generate tileset of Albania

./quickstart.sh canada  # Generate tileset of Canada
./quickstart.sh quebec  # Generate tileset of Québec
This process can be very slow for large regions like Canada or Québec however, so we will see how to create smaller OpenStreetMap datasets for OpenMapTiles to convert.
Creating Custom OpenStreetMap Data Extract
An OpenStreetMap dataset contains raw high detail vector data, which results in very large data files. For example, Canada alone contains 2.8GB worth of vector data which is both a lot to download, but also a lot to process. Most sources for downloading OpenStreetMap data will only allow a very small extract of data to be downloaded, but some sources like Geofabrik provide larger pre-extracted downloads. Geofabrik has per-province extracts for Canada, which can be more manageable to work with.
Let's say that for this tutorial we want to create a basemap of the Ottawa-Gatineau region, which happens to span across both Ontario and Québec. Unfortunately this means that the Geofabrik extracts would split our region across the provincial border, but we can combine the two extracts using a tool called Osmium. The commands below will download and merge the two extracts. We can also go one step further and also use Osmium to extract a much smaller extent of just the Ottawa-Gatineau area, and by leaving out the rest of Ontario and Québec we cut the merged dataset down from 1.2GB to just 48MB.
# Change into the openmaptiles/data directory
cd openmaptiles
# Create directory if it does not exist
mkdir data
cd data

# Download provincial extracts
wget https://download.geofabrik.de/north-america/canada/ontario-latest.osm.pbf
wget https://download.geofabrik.de/north-america/canada/quebec-latest.osm.pbf

osmium merge ontario-latest.osm.pbf quebec-latest.osm.pbf -o merged.osm.pbf

# Extract the National Capital Region
osmium extract -b -76.2616,45.1249,-75.1726,45.6620 merged.osm.pbf -o ncr.osm.pbf
Generating Tiles (cont.)
Before generating any more tiles, we need to make one adjustment to the default configuration of OpenMapTiles to allow it to generate more tile zoom levels.
By default it will only generate 7 levels, as this is much quicker and can be used for creating previews of tilesets.
Open the .env file from the OpenMapTiles project and change the MAX_ZOOM variable to read MAX_ZOOM=14.
This tells the tool to generate the higher-detail zoom levels.
Now with the ncr.osm.pbf inside of the OpenMapTiles data directory, we can now run the following commands to generate a tileset for our extent.
# ncr refers to ncr.osm.pbf, created in previous section
make generate-bbox-file area=ncr

./quickstart.sh ncr
After running, this will produce a tiles.mbtiles file in the data directory containing our tileset.
Styling the Map
By default the tile server we created renders the vector data in a fairly plain-looking style. Perhaps we would like to change the colours to fit our desired aesthetic, or to emphasize certain features, or even to add and remove some features from the map altogether.
Layers
Layers take some or all features from a data source (our vector tiles in this case) and apply some layout and paint properties to those features which dictate how they will be rendered. A layer can select which features will be included by specifying a source layer or filter property. A data source can have multiple data layers, and the filter can be used to further refine the selection using the filter property.
For example:
{
  "id": "road_secondary_tertiary",
  "type": "line",
  "source": "openmaptiles",
  "source-layer": "transportation",
  "filter": [
    "in",
    "class",
    "secondary",
    "tertiary"
  ],
  "layout": {},
  "paint": {}
}
This defines a layer that takes the features from the transportation source layer in the openmaptiles data source,
and then filters specifically for features (roads in this case) that are in the secondary and tertiary road class.
The list of all available source layers and properties are defined in the OpenMapTiles Vector Tile Schema.
Layout and Paint properties
Layout and paint properties define how features in a certain layer will be displayed. These properties are specified in the Mapbox Style Specification. The spec defines a lengthy list of properties with a very wide range of capabilties that allows for a high level of customization. For this tutorial, we will only make simple fill color changes.
Styling (cont.)
The Mapbox GL style specification is used to customize the style of vector tiles. A style is a JSON document that specifies (among other things), a list of layers to be rendered. These layers derive their data from the vector data source we produced earlier, but can be filtered to only display certain features from the source. Those features can they have different layout and paint properties applied to them, and the styling can even be set up to change depending on a feature's data properties.
Editing Map Styles with Maputnik
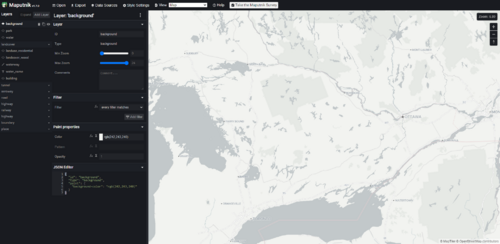
It is possible to write a style directly as a JSON document, however it can be complicated. Instead, we will use the Maputnik editor, which is an open-source web app for editing map styles. The editor shows the current style in a viewport, and has panels on the left which list the style's layers, and the different styling properties applied to a selected layer.
Using Maputnik
We will begin with the "Positron" style as a base. To use this style, click on the "Open" button in the Maputnik toolbar and then select "Positron" from the "Gallery Styles" section.
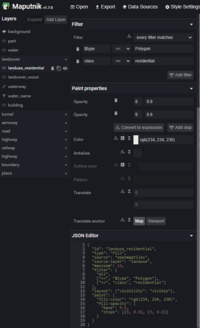
On the lefthand side, there is a "Layers" panel which lists all of the layers being included in the current style. Some our grouped together based on their purpose. e.g. the landcover group contains all layers that represent some form of landcover. Clicking on a layer will show that layer's properties in a panel immediately to the right. At the bottom of this properties panel, the JSON representation of the layer is shown. In general, the properties in the layer JSON map directly to the properties shown in the panel.
An important thing to note is that Maputnik uses vector tiles hosted by MapTiler, and that a map style includes a direct reference to the data source being used. This means that once we have modified and exported our map style, we will need to make some minor modifications after the fact in order to get it to work with our tileserver. This will be covered below.
Modifying a Layer
To modify a layer, we simply select a layer from the layers panel and modify its properties. We can also click on features directly on the map preview to see which layers are present under the cursor.
We want to add some color to our map so we will change the fill color of the water layer to a bright blue, and the landcover_wood to a bright green.
Adding a Layer
In Maputnik, we can add a layer by simply clicking on the "Add Layer" button in the layers panel.
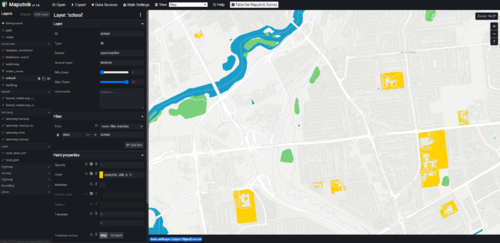
We will add a layer with the ID school, with a Fill type, openmaptiles as the Source, and landuse as the Source Layer.
When added, a lot of black polygons will appear because we haven't filtered and styled this layer yet.
Under the "Filter" section of the properties panel for our new layer, click the "Add filter" button to add a new filter statement.
Edit the <snytaxhighlight inline>name</syntaxhighlight> field to be "class", and then enter school in the other text field.
There should only be a few polygons left, which represent the schools.
We can change the colour of the polygons by adjusting the "Color" paint property. Maputnik provides a handy color selector. We'll pick a bright yellow, like a school bus.
Lastly, the new layer we've added is placed above all the other layers that were already added, so our yellow polygons are blocking the other features underneath. To fix this, we can drag our school layer in the layers panel from the bottom of the layers list, to somewhere near the top, such as into the "landcover" group. Now buildings and roads will still be visible on top of our layer.
The final result should look like this:
Removing a Layer
Sometimes we may also want to remove a layer. For instance, if we intend to add our own labels then there's no point in keeping the any labels in the basemap. By default, our style has included road and place names.
In the layers panel, the type of layer is represented by an icon next to the layer's name. Fill layers are represented by a diamond, line layers by a line, and text (symbol) layers with the letter "T". To remove a layer in Maputnik, simply click on the layer and then on the garbage bin icon.
We will remove all text layers to give our basemap a cleaner look.
Exporting the Style
Once we've finished editing our style, we can export the JSON document that we'll use with our tile server.
To export the style, simply click on the "Export" button in the toolbar, and then click "Download". You do not need to enter any access tokens.
Save the JSON document in your openmaptiles data directory as fancy.json
In order to make it work with our tile server we need to make some minor adjustments. Open the style document in your preferred text editor and change the following properties (highlighted):
"sources": {
  "openmaptiles": {
    "type": "vector",
    "url": "https://api.maptiler.com/tiles/v3/tiles.json?key={key}"
  }
},
"sprite": "https://openmaptiles.github.io/positron-gl-style/sprite",
"glyphs": "https://api.maptiler.com/fonts/{fontstack}/{range}.pbf?key={key}",
Replace the "url" property, delete the "sprite" property, and replace the "glyphs" property to instruct the tile server to use our data as follows:
"sources": {
  "openmaptiles": {
    "type": "vector",
    "url": "http://localhost:8080/data/ottawa-vector.json"
  }
},
"glyphs": "fonts/{fontstack}/{range}.pbf",
Serving Tiles
Now that we have generated our map tiles, we want to serve them so that they can be used by a mapping application.
We will do this with tileserver-gl-light.
Configuring the Tileserver
To configure the server, we can create a JSON file that can be passed to the tileserver command. For convenience, we can just create the configuration file in the openmaptiles data directory.
{
    "styles": {
        "fancy": {
            "style": "fancy.json"
        }
    },
    "data": {
        "ottawa-vector": {
            "mbtiles": "tiles.mbtiles"
        }
    }
}
This configuration file defines the styles and data files that the server will use.
Each entry in the "styles" section is given an ID ("fancy" in this case), and the "style" property is the path to the JSON style definition. In this case the "fancy.json" refers to a file in the openmaptiles data directory which we will create in the section below.
Each data entry is similar, where an ID is assigned to each ("ottawa-vector" in this case), and then the "mbtiles" property refers to a path to the vector tile file to serve.
In this case the path points to the tiles.mbtiles that was created in the previous section.
Multiple styles and data sources can be defined simply by adding more entries in this configuration file.
Running the Tileserver
After running the following command, the server can be accessed at http://localhost:8080.
tileserver-gl-light --config config.json
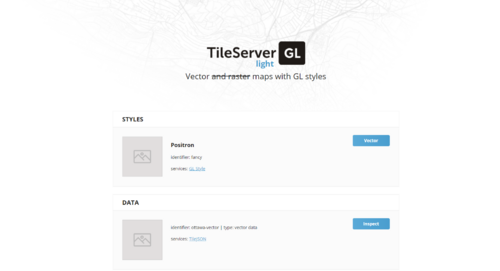
The homepage of the tileserver includes a link that can be used to preview the tileset.
Clicking the "Vector" button will open a page with a map preview of the style, identical to the Maputnik preview. By zooming into our extent of Ottawa-Gatineau we can see the detailed vector tiles being loaded in. Areas outside of the extent will be blank, since we didn't include that data when generating the tiles.
Note the "GL Style" and "TileJSON" links. The TileJSON link refers to a JSON document which the tile server generates that defines our vector tile source.
This is the URL that we updated our fancy.json file with earlier as the style data source.
The "GL Style" URL is simply the style JSON document that we had previously created. This exact URL is used to refer to the map style as a whole and is what we use to import the style into other software, like QGIS which will be explored below.
Using Vector Tiles in QGIS
Vector tiles in this format can be consumed by many tools and libraries, but we will demonstrate their use in QGIS here. MapTiler develops a plugin for QGIS, also called MapTiler, which enables the use of vector tiles in QGIS.
To install the plugin, in QGIS navigate to the Plugins > Manage and Install Plugins... menu. In the search bar, enter "MapTiler", select the plugin that turns up in the search results, and install the plugin. Once installed, a new "MapTiler" dropdown will be added to the QGIS Browser panel. Expanding the dropdown shows a list of preset vector tile services that can be added, however they require a MapTiler access key.
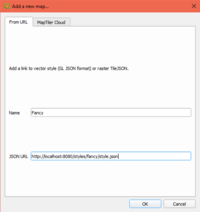
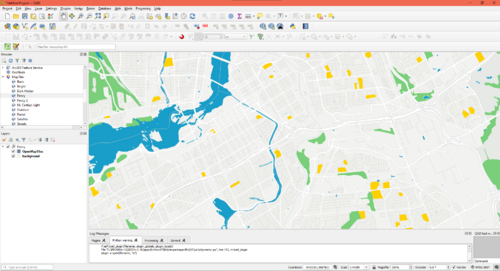
To add our own tile server, we can right click on the MapTiler dropdown and select "Add a new map...". The popup will default to adding a new map from URL, where we can give our map a name, and then enter the URL to the tile server's style JSON. (The "GL Style" URL from the previous section) We can then add the new map as a layer in our QGIS project by double clicking our map service in the QGIS catalog.
The plugin treats the vector tiles as proper vector data, meaning that it can be queried like any other vector features in QGIS. When producing map layouts, the vector data can even be exported to vector graphics formats like SVG and PDF. Other data layers can be added on top of this basemap to create all kinds of thematic maps that combine the OSM data in our basemap with any other dataset.
Licensing Considerations
Remember that the Open Database License requires that OpenStreetMap contributors are credited when using data or datasets that are derived from OpenStreetMap data.
In addition, any use of the vector tiles that are created using OpenMapTiles must also credit OpenMapTiles.
An example attribution of both: © OpenMapTiles © OpenStreetMap contributors
Conclusion
We have seen how to create our own styled vector basemaps using open-source tools and OSM data. The extensive OSM dataset allows for many different possible combinations of features in the basemap to fit the needs of individual maps, and the Mapbox GL style spec allows for many different customizations. These vector tile services can then be consumed by all kinds of programs to create your ideal map. The possibilities are endless.
The full fancy.json file created in this tutorial (Click "Expand" to view):
{
  "version": 8,
  "name": "Positron",
  "metadata": {
    "mapbox:autocomposite": false,
    "mapbox:groups": {
      "101da9f13b64a08fa4b6ac1168e89e5f": {
        "collapsed": false,
        "name": "Places"
      },
      "a14c9607bc7954ba1df7205bf660433f": {"name": "Boundaries"},
      "b6371a3f2f5a9932464fa3867530a2e5": {
        "collapsed": false,
        "name": "Transportation"
      }
    },
    "mapbox:type": "template",
    "openmaptiles:mapbox:owner": "openmaptiles",
    "openmaptiles:mapbox:source:url": "mapbox://openmaptiles.4qljc88t",
    "openmaptiles:version": "3.x",
    "maputnik:renderer": "mbgljs"
  },
  "sources": {
    "openmaptiles": {
      "type": "vector",
      "url": "http://localhost:8080/data/ottawa-vector.json"
    }
  },
  "glyphs": "fonts/{fontstack}/{range}.pbf",
  "layers": [
    {
      "id": "background",
      "type": "background",
      "paint": {"background-color": "rgb(242,243,240)"}
    },
    {
      "id": "park",
      "type": "fill",
      "source": "openmaptiles",
      "source-layer": "park",
      "filter": ["==", "$type", "Polygon"],
      "layout": {"visibility": "visible"},
      "paint": {"fill-color": "rgb(230, 233, 229)"}
    },
    {
      "id": "water",
      "type": "fill",
      "source": "openmaptiles",
      "source-layer": "water",
      "filter": [
        "all",
        ["==", "$type", "Polygon"],
        ["!=", "brunnel", "tunnel"]
      ],
      "layout": {"visibility": "visible"},
      "paint": {"fill-antialias": true, "fill-color": "rgba(25, 157, 201, 1)"}
    },
    {
      "id": "landcover_ice_shelf",
      "type": "fill",
      "source": "openmaptiles",
      "source-layer": "landcover",
      "maxzoom": 8,
      "filter": [
        "all",
        ["==", "$type", "Polygon"],
        ["==", "subclass", "ice_shelf"]
      ],
      "layout": {"visibility": "visible"},
      "paint": {"fill-color": "hsl(0, 0%, 98%)", "fill-opacity": 0.7}
    },
    {
      "id": "landcover_glacier",
      "type": "fill",
      "source": "openmaptiles",
      "source-layer": "landcover",
      "maxzoom": 8,
      "filter": [
        "all",
        ["==", "$type", "Polygon"],
        ["==", "subclass", "glacier"]
      ],
      "layout": {"visibility": "visible"},
      "paint": {
        "fill-color": "hsl(0, 0%, 98%)",
        "fill-opacity": {"base": 1, "stops": [[0, 1], [8, 0.5]]}
      }
    },
    {
      "id": "landuse_residential",
      "type": "fill",
      "source": "openmaptiles",
      "source-layer": "landuse",
      "maxzoom": 16,
      "filter": [
        "all",
        ["==", "$type", "Polygon"],
        ["==", "class", "residential"]
      ],
      "layout": {"visibility": "visible"},
      "paint": {
        "fill-color": "rgb(234, 234, 230)",
        "fill-opacity": {"base": 0.6, "stops": [[8, 0.8], [9, 0.6]]}
      }
    },
    {
      "id": "landcover_wood",
      "type": "fill",
      "source": "openmaptiles",
      "source-layer": "landcover",
      "minzoom": 10,
      "filter": ["all", ["==", "$type", "Polygon"], ["==", "class", "wood"]],
      "layout": {"visibility": "visible"},
      "paint": {
        "fill-color": "rgba(122, 207, 122, 1)",
        "fill-opacity": {"base": 1, "stops": [[8, 0], [12, 1]]}
      }
    },
    {
      "id": "waterway",
      "type": "line",
      "source": "openmaptiles",
      "source-layer": "waterway",
      "filter": ["==", "$type", "LineString"],
      "layout": {"visibility": "visible"},
      "paint": {"line-color": "hsl(195, 17%, 78%)"}
    },
    {
      "id": "school",
      "type": "fill",
      "source": "openmaptiles",
      "source-layer": "landuse",
      "filter": ["all", ["==", "class", "school"]],
      "paint": {"fill-color": "rgba(255, 209, 0, 1)"}
    },
    {
      "id": "building",
      "type": "fill",
      "source": "openmaptiles",
      "source-layer": "building",
      "minzoom": 12,
      "paint": {
        "fill-antialias": true,
        "fill-color": "rgb(234, 234, 229)",
        "fill-outline-color": "rgb(219, 219, 218)"
      }
    },
    {
      "id": "tunnel_motorway_casing",
      "type": "line",
      "metadata": {"mapbox:group": "b6371a3f2f5a9932464fa3867530a2e5"},
      "source": "openmaptiles",
      "source-layer": "transportation",
      "minzoom": 6,
      "filter": [
        "all",
        ["==", "$type", "LineString"],
        ["all", ["==", "brunnel", "tunnel"], ["==", "class", "motorway"]]
      ],
      "layout": {
        "line-cap": "butt",
        "line-join": "miter",
        "visibility": "visible"
      },
      "paint": {
        "line-color": "rgb(213, 213, 213)",
        "line-opacity": 1,
        "line-width": {"base": 1.4, "stops": [[5.8, 0], [6, 3], [20, 40]]}
      }
    },
    {
      "id": "tunnel_motorway_inner",
      "type": "line",
      "metadata": {"mapbox:group": "b6371a3f2f5a9932464fa3867530a2e5"},
      "source": "openmaptiles",
      "source-layer": "transportation",
      "minzoom": 6,
      "filter": [
        "all",
        ["==", "$type", "LineString"],
        ["all", ["==", "brunnel", "tunnel"], ["==", "class", "motorway"]]
      ],
      "layout": {
        "line-cap": "round",
        "line-join": "round",
        "visibility": "visible"
      },
      "paint": {
        "line-color": "rgb(234,234,234)",
        "line-width": {"base": 1.4, "stops": [[4, 2], [6, 1.3], [20, 30]]}
      }
    },
    {
      "id": "aeroway-taxiway",
      "type": "line",
      "metadata": {"mapbox:group": "1444849345966.4436"},
      "source": "openmaptiles",
      "source-layer": "aeroway",
      "minzoom": 12,
      "filter": ["all", ["in", "class", "taxiway"]],
      "layout": {
        "line-cap": "round",
        "line-join": "round",
        "visibility": "visible"
      },
      "paint": {
        "line-color": "hsl(0, 0%, 88%)",
        "line-opacity": 1,
        "line-width": {"base": 1.55, "stops": [[13, 1.8], [20, 20]]}
      }
    },
    {
      "id": "aeroway-runway-casing",
      "type": "line",
      "metadata": {"mapbox:group": "1444849345966.4436"},
      "source": "openmaptiles",
      "source-layer": "aeroway",
      "minzoom": 11,
      "filter": ["all", ["in", "class", "runway"]],
      "layout": {
        "line-cap": "round",
        "line-join": "round",
        "visibility": "visible"
      },
      "paint": {
        "line-color": "hsl(0, 0%, 88%)",
        "line-opacity": 1,
        "line-width": {"base": 1.5, "stops": [[11, 6], [17, 55]]}
      }
    },
    {
      "id": "aeroway-area",
      "type": "fill",
      "metadata": {"mapbox:group": "1444849345966.4436"},
      "source": "openmaptiles",
      "source-layer": "aeroway",
      "minzoom": 4,
      "filter": [
        "all",
        ["==", "$type", "Polygon"],
        ["in", "class", "runway", "taxiway"]
      ],
      "layout": {"visibility": "visible"},
      "paint": {
        "fill-color": "rgba(255, 255, 255, 1)",
        "fill-opacity": {"base": 1, "stops": [[13, 0], [14, 1]]}
      }
    },
    {
      "id": "aeroway-runway",
      "type": "line",
      "metadata": {"mapbox:group": "1444849345966.4436"},
      "source": "openmaptiles",
      "source-layer": "aeroway",
      "minzoom": 11,
      "filter": [
        "all",
        ["in", "class", "runway"],
        ["==", "$type", "LineString"]
      ],
      "layout": {
        "line-cap": "round",
        "line-join": "round",
        "visibility": "visible"
      },
      "paint": {
        "line-color": "rgba(255, 255, 255, 1)",
        "line-opacity": 1,
        "line-width": {"base": 1.5, "stops": [[11, 4], [17, 50]]}
      }
    },
    {
      "id": "road_area_pier",
      "type": "fill",
      "metadata": {},
      "source": "openmaptiles",
      "source-layer": "transportation",
      "filter": ["all", ["==", "$type", "Polygon"], ["==", "class", "pier"]],
      "layout": {"visibility": "visible"},
      "paint": {"fill-antialias": true, "fill-color": "rgb(242,243,240)"}
    },
    {
      "id": "road_pier",
      "type": "line",
      "metadata": {},
      "source": "openmaptiles",
      "source-layer": "transportation",
      "filter": ["all", ["==", "$type", "LineString"], ["in", "class", "pier"]],
      "layout": {"line-cap": "round", "line-join": "round"},
      "paint": {
        "line-color": "rgb(242,243,240)",
        "line-width": {"base": 1.2, "stops": [[15, 1], [17, 4]]}
      }
    },
    {
      "id": "highway_path",
      "type": "line",
      "metadata": {"mapbox:group": "b6371a3f2f5a9932464fa3867530a2e5"},
      "source": "openmaptiles",
      "source-layer": "transportation",
      "filter": ["all", ["==", "$type", "LineString"], ["==", "class", "path"]],
      "layout": {
        "line-cap": "round",
        "line-join": "round",
        "visibility": "visible"
      },
      "paint": {
        "line-color": "rgb(234, 234, 234)",
        "line-opacity": 0.9,
        "line-width": {"base": 1.2, "stops": [[13, 1], [20, 10]]}
      }
    },
    {
      "id": "highway_minor",
      "type": "line",
      "metadata": {"mapbox:group": "b6371a3f2f5a9932464fa3867530a2e5"},
      "source": "openmaptiles",
      "source-layer": "transportation",
      "minzoom": 8,
      "filter": [
        "all",
        ["==", "$type", "LineString"],
        ["in", "class", "minor", "service", "track"]
      ],
      "layout": {
        "line-cap": "round",
        "line-join": "round",
        "visibility": "visible"
      },
      "paint": {
        "line-color": "hsl(0, 0%, 88%)",
        "line-opacity": 0.9,
        "line-width": {"base": 1.55, "stops": [[13, 1.8], [20, 20]]}
      }
    },
    {
      "id": "highway_major_casing",
      "type": "line",
      "metadata": {"mapbox:group": "b6371a3f2f5a9932464fa3867530a2e5"},
      "source": "openmaptiles",
      "source-layer": "transportation",
      "minzoom": 11,
      "filter": [
        "all",
        ["==", "$type", "LineString"],
        ["in", "class", "primary", "secondary", "tertiary", "trunk"]
      ],
      "layout": {
        "line-cap": "butt",
        "line-join": "miter",
        "visibility": "visible"
      },
      "paint": {
        "line-color": "rgb(213, 213, 213)",
        "line-dasharray": [12, 0],
        "line-width": {"base": 1.3, "stops": [[10, 3], [20, 23]]}
      }
    },
    {
      "id": "highway_major_inner",
      "type": "line",
      "metadata": {"mapbox:group": "b6371a3f2f5a9932464fa3867530a2e5"},
      "source": "openmaptiles",
      "source-layer": "transportation",
      "minzoom": 11,
      "filter": [
        "all",
        ["==", "$type", "LineString"],
        ["in", "class", "primary", "secondary", "tertiary", "trunk"]
      ],
      "layout": {
        "line-cap": "round",
        "line-join": "round",
        "visibility": "visible"
      },
      "paint": {
        "line-color": "#fff",
        "line-width": {"base": 1.3, "stops": [[10, 2], [20, 20]]}
      }
    },
    {
      "id": "highway_major_subtle",
      "type": "line",
      "metadata": {"mapbox:group": "b6371a3f2f5a9932464fa3867530a2e5"},
      "source": "openmaptiles",
      "source-layer": "transportation",
      "maxzoom": 11,
      "filter": [
        "all",
        ["==", "$type", "LineString"],
        ["in", "class", "primary", "secondary", "tertiary", "trunk"]
      ],
      "layout": {
        "line-cap": "round",
        "line-join": "round",
        "visibility": "visible"
      },
      "paint": {"line-color": "hsla(0, 0%, 85%, 0.69)", "line-width": 2}
    },
    {
      "id": "highway_motorway_casing",
      "type": "line",
      "metadata": {"mapbox:group": "b6371a3f2f5a9932464fa3867530a2e5"},
      "source": "openmaptiles",
      "source-layer": "transportation",
      "minzoom": 6,
      "filter": [
        "all",
        ["==", "$type", "LineString"],
        [
          "all",
          ["!in", "brunnel", "bridge", "tunnel"],
          ["==", "class", "motorway"]
        ]
      ],
      "layout": {
        "line-cap": "butt",
        "line-join": "miter",
        "visibility": "visible"
      },
      "paint": {
        "line-color": "rgb(213, 213, 213)",
        "line-dasharray": [2, 0],
        "line-opacity": 1,
        "line-width": {"base": 1.4, "stops": [[5.8, 0], [6, 3], [20, 40]]}
      }
    },
    {
      "id": "highway_motorway_inner",
      "type": "line",
      "metadata": {"mapbox:group": "b6371a3f2f5a9932464fa3867530a2e5"},
      "source": "openmaptiles",
      "source-layer": "transportation",
      "minzoom": 6,
      "filter": [
        "all",
        ["==", "$type", "LineString"],
        [
          "all",
          ["!in", "brunnel", "bridge", "tunnel"],
          ["==", "class", "motorway"]
        ]
      ],
      "layout": {
        "line-cap": "round",
        "line-join": "round",
        "visibility": "visible"
      },
      "paint": {
        "line-color": {
          "base": 1,
          "stops": [[5.8, "hsla(0, 0%, 85%, 0.53)"], [6, "#fff"]]
        },
        "line-width": {"base": 1.4, "stops": [[4, 2], [6, 1.3], [20, 30]]}
      }
    },
    {
      "id": "highway_motorway_subtle",
      "type": "line",
      "metadata": {"mapbox:group": "b6371a3f2f5a9932464fa3867530a2e5"},
      "source": "openmaptiles",
      "source-layer": "transportation",
      "maxzoom": 6,
      "filter": [
        "all",
        ["==", "$type", "LineString"],
        ["==", "class", "motorway"]
      ],
      "layout": {
        "line-cap": "round",
        "line-join": "round",
        "visibility": "visible"
      },
      "paint": {
        "line-color": "hsla(0, 0%, 85%, 0.53)",
        "line-width": {"base": 1.4, "stops": [[4, 2], [6, 1.3]]}
      }
    },
    {
      "id": "railway_transit",
      "type": "line",
      "metadata": {"mapbox:group": "b6371a3f2f5a9932464fa3867530a2e5"},
      "source": "openmaptiles",
      "source-layer": "transportation",
      "minzoom": 16,
      "filter": [
        "all",
        ["==", "$type", "LineString"],
        ["all", ["==", "class", "transit"], ["!in", "brunnel", "tunnel"]]
      ],
      "layout": {"line-join": "round", "visibility": "visible"},
      "paint": {"line-color": "#dddddd", "line-width": 3}
    },
    {
      "id": "railway_transit_dashline",
      "type": "line",
      "metadata": {"mapbox:group": "b6371a3f2f5a9932464fa3867530a2e5"},
      "source": "openmaptiles",
      "source-layer": "transportation",
      "minzoom": 16,
      "filter": [
        "all",
        ["==", "$type", "LineString"],
        ["all", ["==", "class", "transit"], ["!in", "brunnel", "tunnel"]]
      ],
      "layout": {"line-join": "round", "visibility": "visible"},
      "paint": {
        "line-color": "#fafafa",
        "line-dasharray": [3, 3],
        "line-width": 2
      }
    },
    {
      "id": "railway_service",
      "type": "line",
      "metadata": {"mapbox:group": "b6371a3f2f5a9932464fa3867530a2e5"},
      "source": "openmaptiles",
      "source-layer": "transportation",
      "minzoom": 16,
      "filter": [
        "all",
        ["==", "$type", "LineString"],
        ["all", ["==", "class", "rail"], ["has", "service"]]
      ],
      "layout": {"line-join": "round", "visibility": "visible"},
      "paint": {"line-color": "#dddddd", "line-width": 3}
    },
    {
      "id": "railway_service_dashline",
      "type": "line",
      "metadata": {"mapbox:group": "b6371a3f2f5a9932464fa3867530a2e5"},
      "source": "openmaptiles",
      "source-layer": "transportation",
      "minzoom": 16,
      "filter": [
        "all",
        ["==", "$type", "LineString"],
        ["==", "class", "rail"],
        ["has", "service"]
      ],
      "layout": {"line-join": "round", "visibility": "visible"},
      "paint": {
        "line-color": "#fafafa",
        "line-dasharray": [3, 3],
        "line-width": 2
      }
    },
    {
      "id": "railway",
      "type": "line",
      "metadata": {"mapbox:group": "b6371a3f2f5a9932464fa3867530a2e5"},
      "source": "openmaptiles",
      "source-layer": "transportation",
      "minzoom": 13,
      "filter": [
        "all",
        ["==", "$type", "LineString"],
        ["all", ["!has", "service"], ["==", "class", "rail"]]
      ],
      "layout": {"line-join": "round", "visibility": "visible"},
      "paint": {
        "line-color": "#dddddd",
        "line-width": {"base": 1.3, "stops": [[16, 3], [20, 7]]}
      }
    },
    {
      "id": "railway_dashline",
      "type": "line",
      "metadata": {"mapbox:group": "b6371a3f2f5a9932464fa3867530a2e5"},
      "source": "openmaptiles",
      "source-layer": "transportation",
      "minzoom": 13,
      "filter": [
        "all",
        ["==", "$type", "LineString"],
        ["all", ["!has", "service"], ["==", "class", "rail"]]
      ],
      "layout": {"line-join": "round", "visibility": "visible"},
      "paint": {
        "line-color": "#fafafa",
        "line-dasharray": [3, 3],
        "line-width": {"base": 1.3, "stops": [[16, 2], [20, 6]]}
      }
    },
    {
      "id": "highway_motorway_bridge_casing",
      "type": "line",
      "metadata": {"mapbox:group": "b6371a3f2f5a9932464fa3867530a2e5"},
      "source": "openmaptiles",
      "source-layer": "transportation",
      "minzoom": 6,
      "filter": [
        "all",
        ["==", "$type", "LineString"],
        ["all", ["==", "brunnel", "bridge"], ["==", "class", "motorway"]]
      ],
      "layout": {
        "line-cap": "butt",
        "line-join": "miter",
        "visibility": "visible"
      },
      "paint": {
        "line-color": "rgb(213, 213, 213)",
        "line-dasharray": [2, 0],
        "line-opacity": 1,
        "line-width": {"base": 1.4, "stops": [[5.8, 0], [6, 5], [20, 45]]}
      }
    },
    {
      "id": "highway_motorway_bridge_inner",
      "type": "line",
      "metadata": {"mapbox:group": "b6371a3f2f5a9932464fa3867530a2e5"},
      "source": "openmaptiles",
      "source-layer": "transportation",
      "minzoom": 6,
      "filter": [
        "all",
        ["==", "$type", "LineString"],
        ["all", ["==", "brunnel", "bridge"], ["==", "class", "motorway"]]
      ],
      "layout": {
        "line-cap": "round",
        "line-join": "round",
        "visibility": "visible"
      },
      "paint": {
        "line-color": {
          "base": 1,
          "stops": [[5.8, "hsla(0, 0%, 85%, 0.53)"], [6, "#fff"]]
        },
        "line-width": {"base": 1.4, "stops": [[4, 2], [6, 1.3], [20, 30]]}
      }
    },
    {
      "id": "boundary_state",
      "type": "line",
      "metadata": {"mapbox:group": "a14c9607bc7954ba1df7205bf660433f"},
      "source": "openmaptiles",
      "source-layer": "boundary",
      "filter": ["==", "admin_level", 4],
      "layout": {
        "line-cap": "round",
        "line-join": "round",
        "visibility": "visible"
      },
      "paint": {
        "line-blur": 0.4,
        "line-color": "rgb(230, 204, 207)",
        "line-dasharray": [2, 2],
        "line-opacity": 1,
        "line-width": {"base": 1.3, "stops": [[3, 1], [22, 15]]}
      }
    },
    {
      "id": "boundary_country_z0-4",
      "type": "line",
      "metadata": {"mapbox:group": "a14c9607bc7954ba1df7205bf660433f"},
      "source": "openmaptiles",
      "source-layer": "boundary",
      "maxzoom": 5,
      "filter": ["all", ["==", "admin_level", 2], ["!has", "claimed_by"]],
      "layout": {"line-cap": "round", "line-join": "round"},
      "paint": {
        "line-blur": {"base": 1, "stops": [[0, 0.4], [22, 4]]},
        "line-color": "rgb(230, 204, 207)",
        "line-opacity": 1,
        "line-width": {"base": 1.1, "stops": [[3, 1], [22, 20]]}
      }
    },
    {
      "id": "boundary_country_z5-",
      "type": "line",
      "metadata": {"mapbox:group": "a14c9607bc7954ba1df7205bf660433f"},
      "source": "openmaptiles",
      "source-layer": "boundary",
      "minzoom": 5,
      "filter": ["==", "admin_level", 2],
      "layout": {"line-cap": "round", "line-join": "round"},
      "paint": {
        "line-blur": {"base": 1, "stops": [[0, 0.4], [22, 4]]},
        "line-color": "rgb(230, 204, 207)",
        "line-opacity": 1,
        "line-width": {"base": 1.1, "stops": [[3, 1], [22, 20]]}
      }
    }
  ],
  "id": "positron"
}
